

Probabilistic Modelling for Unsupervised Analysis of Human Behaviour in Smart Cities
- PMID: 32023966
- PMCID: PMC7038491
- DOI: 10.3390/s20030784
Probabilistic Modelling for Unsupervised Analysis of Human Behaviour in Smart Cities
Abstract
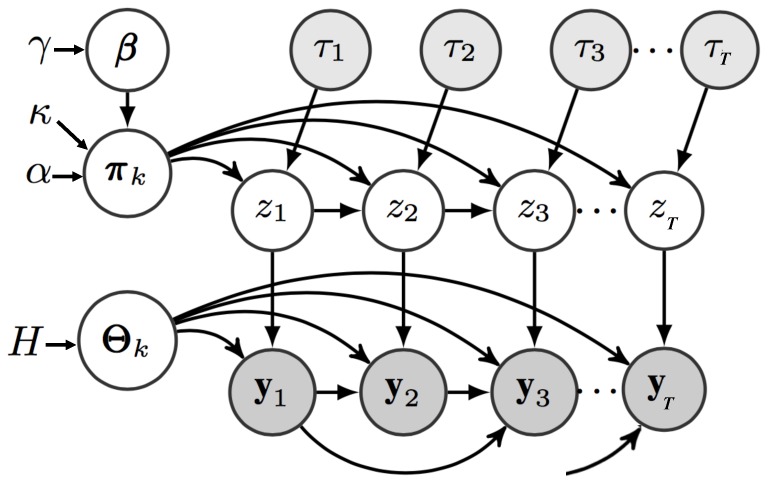
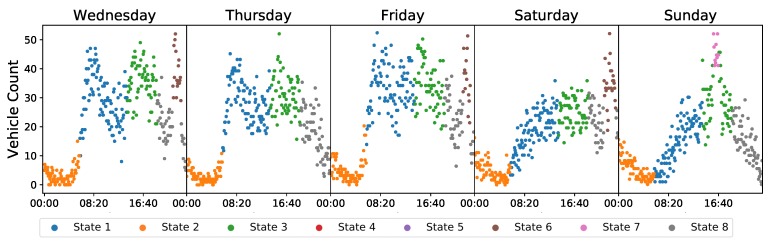
The growth of urban areas in recent years has motivated a large amount of new sensor applications in smart cities. At the centre of many new applications stands the goal of gaining insights into human activity. Scalable monitoring of urban environments can facilitate better informed city planning, efficient security, regular transport and commerce. A large part of monitoring capabilities have already been deployed; however, most rely on expensive motion imagery and privacy invading video cameras. It is possible to use a low-cost sensor alternative, which enables deep understanding of population behaviour such as the Global Positioning System (GPS) data. However, the automated analysis of such low dimensional sensor data, requires new flexible and structured techniques that can describe the generative distribution and time dynamics of the observation data, while accounting for external contextual influences such as time of day or the difference between weekend/weekday trends. In this paper, we propose a novel time series analysis technique that allows for multiple different transition matrices depending on the data's contextual realisations all following shared adaptive observational models that govern the global distribution of the data given a latent sequence. The proposed approach, which we name Adaptive Input Hidden Markov model (AI-HMM) is tested on two datasets from different sensor types: GPS trajectories of taxis and derived vehicle counts in populated areas. We demonstrate that our model can group different categories of behavioural trends and identify time specific anomalies.
Keywords: probabilistic modelling; smart city; time series; trajectory analysis.
Conflict of interest statement
The authors declare no conflict of interest.
Figures


References
-
- Jang S., Jo H., Cho S., Mechitov K., Rice J.A., Sim S.H., Jung H.J., Yun C.B., Spencer B.F., Jr., Agha G. Structural health monitoring of a cable-stayed bridge using smart sensor technology: Deployment and evaluation. Smart Struct. Syst. 2010;6:439–459. doi: 10.12989/sss.2010.6.5_6.439. - DOI
-
- Castro M., Jara A.J., Skarmeta A.F. Smart lighting solutions for smart cities; Proceedings of the 2013 27th International Conference on Advanced Information Networking and Applications Workshops; Barcelona, Spain. 25–28 March 2013; pp. 1374–1379.
-
- Masse R.A.C., Ochoa-Zezzatti A., García V., Mejía J., Gonzalez S. Application of IoT with haptics interface in the smart manufacturing industry. Int. J. Comb. Optim. Probl. Inform. 2019;10:57–70.
-
- De Marsico M., Mecca A., Barra S. Walking in a smart city: Investigating the gait stabilization effect for biometric recognition via wearable sensors. Comput. Electr. Eng. 2019;80:106501. doi: 10.1016/j.compeleceng.2019.106501. - DOI
MeSH terms
LinkOut - more resources
Full Text Sources
