

Characteristics and Dysbiosis of the Gut Microbiome in Renal Transplant Recipients
- PMID: 32024079
- PMCID: PMC7074359
- DOI: 10.3390/jcm9020386
Characteristics and Dysbiosis of the Gut Microbiome in Renal Transplant Recipients
Abstract
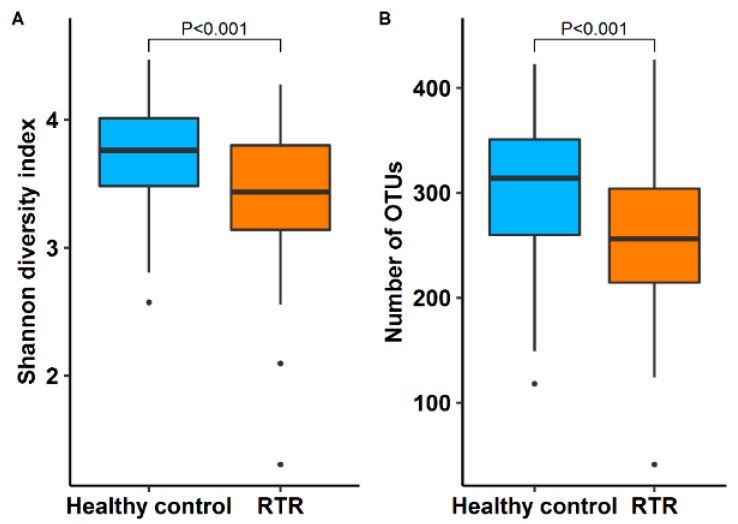
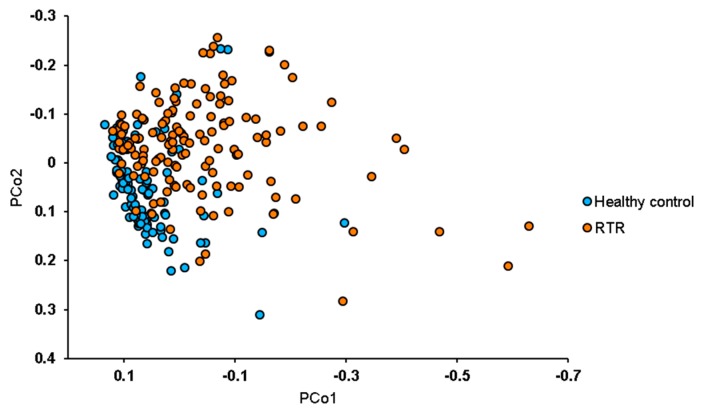
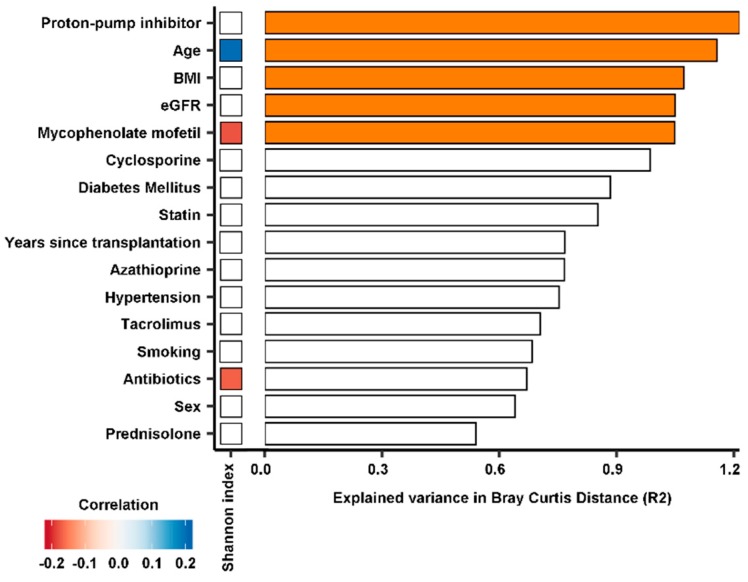
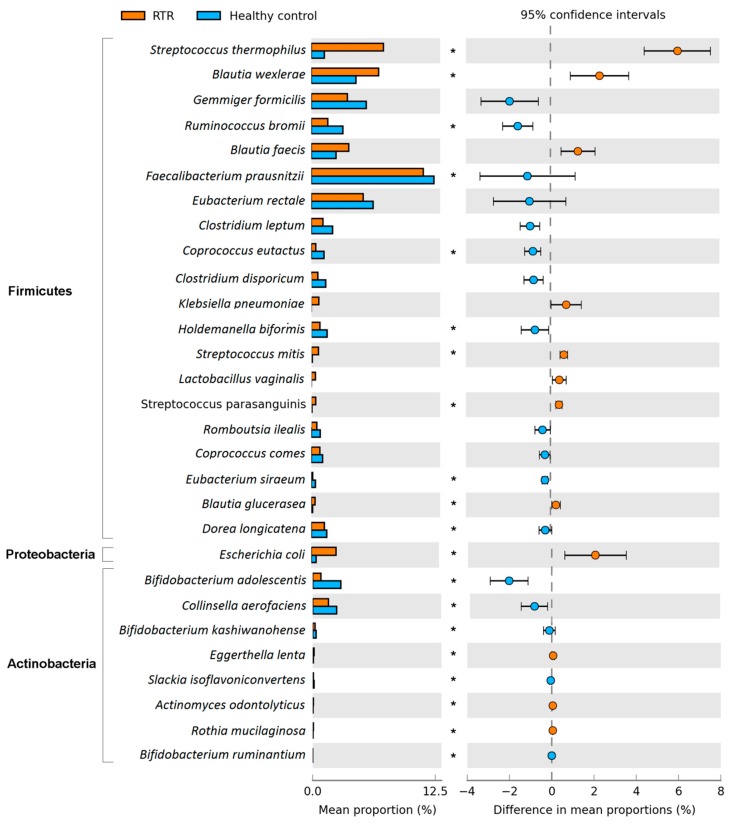
Renal transplantation is life-changing in many aspects. This includes changes to the gut microbiome likely due to exposure to immunosuppressive drugs and antibiotics. As a consequence, renal transplant recipients (RTRs) might suffer from intestinal dysbiosis. We aimed to investigate the gut microbiome of RTRs and compare it with healthy controls and to identify determinants of the gut microbiome of RTRs. Therefore, RTRs and healthy controls participating in the TransplantLines Biobank and Cohort Study (NCT03272841) were included. We analyzed the gut microbiome using 16S rRNA sequencing and compared the composition of the gut microbiome of RTRs to healthy controls using multivariate association with linear models (MaAsLin). Fecal samples of 139 RTRs (50% male, mean age: 58.3 ± 12.8 years) and 105 healthy controls (57% male, mean age: 59.2 ± 10.6 years) were collected. Median time after transplantation of RTRs was 6.0 (1.5-12.5)years. The microbiome composition of RTRs was significantly different from that of healthy controls, and RTRs had a lower diversity of the gut microbiome (p < 0.01). Proton-pump inhibitors, mycophenolate mofetil, and estimated glomerular filtration rate (eGFR) are significant determinants of the gut microbiome of RTRs (p < 0.05). Use of mycophenolate mofetil correlated to a lower diversity (p < 0.01). Moreover, significant alterations were found in multiple bacterial taxa between RTRs and healthy controls. The gut microbiome of RTRs contained more Proteobacteria and less Actinobacteria, and there was a loss of butyrate-producing bacteria in the gut microbiome of RTRs. By comparing the gut microbiome of RTRs to healthy controls we have shown that RTRs suffer from dysbiosis, a disruption in the balance of the gut microbiome.
Keywords: 16S rRNA sequencing; Proteobacteria; butyrate-producing bacteria; diarrhea; gut microbiome; gut microbiota; immunosuppressive medication; kidney transplantation; renal transplant recipient.
Conflict of interest statement
The authors declare no conflict of interest.
Figures
References
-
- Ekberg H., Kyllönen L., Madsen S., Grave G., Solbu D., Holdaas H. Clinicians underestimate gastrointestinal symptoms and overestimate quality of life in renal transplant recipients: A multinational survey of nephrologists. Transplantation. 2007;84:1052–1054. doi: 10.1097/01.tp.0000284983.89207.1a. - DOI - PubMed
-
- Bunnapradist S., Neri L., Wong W., Lentine K.L., Burroughs T.E., Pinsky B.W., Takemoto S.K., Schnitzler M.A. Incidence and Risk Factors for Diarrhea Following Kidney Transplantation and Association with Graft Loss and Mortality. Am. J. Kidney Dis. 2008;51:478–486. doi: 10.1053/j.ajkd.2007.11.013. - DOI - PubMed
LinkOut - more resources
Full Text Sources
Other Literature Sources
Medical
Research Materials
Miscellaneous
