

Estimating Urine Albumin-to-Creatinine Ratio from Protein-to-Creatinine Ratio: Development of Equations using Same-Day Measurements
- PMID: 32024663
- PMCID: PMC7062208
- DOI: 10.1681/ASN.2019060605
Estimating Urine Albumin-to-Creatinine Ratio from Protein-to-Creatinine Ratio: Development of Equations using Same-Day Measurements
Erratum in
-
Erratum.J Am Soc Nephrol. 2020 May;31(5):1140. doi: 10.1681/ASN.2020030291. J Am Soc Nephrol. 2020. PMID: 32354988 Free PMC article. No abstract available.
Abstract
Background: Urine albumin-to-creatinine ratio (ACR) and protein-to-creatinine ratio (PCR) are used to measure urine protein. Recent guidelines endorse ACR use, and equations have been developed incorporating ACR to predict risk of kidney failure. For situations in which PCR only is available, having a method to estimate ACR from PCR as accurately as possible would be useful.
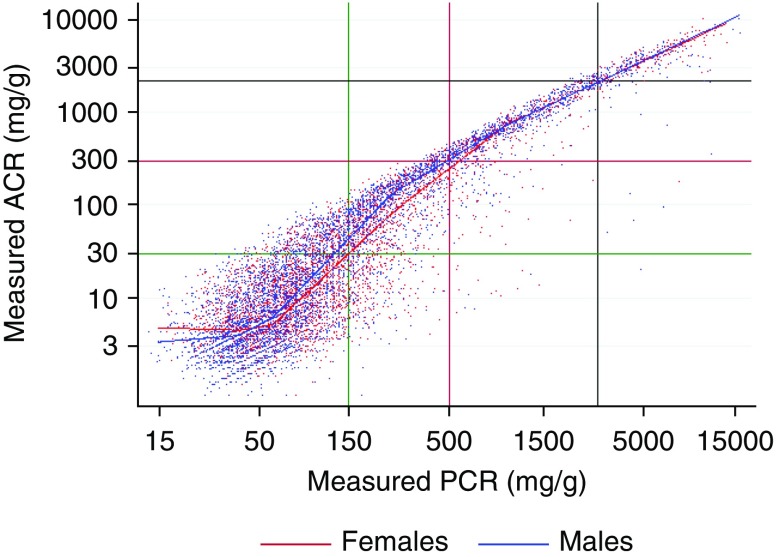
Methods: We used data from a population-based cohort of 47,714 adults in Alberta, Canada, who had simultaneous assessments of urine ACR and PCR. After log-transforming ACR and PCR, we used cubic splines and quantile regression to estimate the median ACR from a PCR, allowing for modification by specified covariates. On the basis of the cubic splines, we created models using linear splines to develop equations to estimate ACR from PCR. In a subcohort with eGFR<60 ml/min per 1.73 m2, we then used the kidney failure risk equation to compare kidney failure risk using measured ACR as well as estimated ACR that had been derived from PCR.
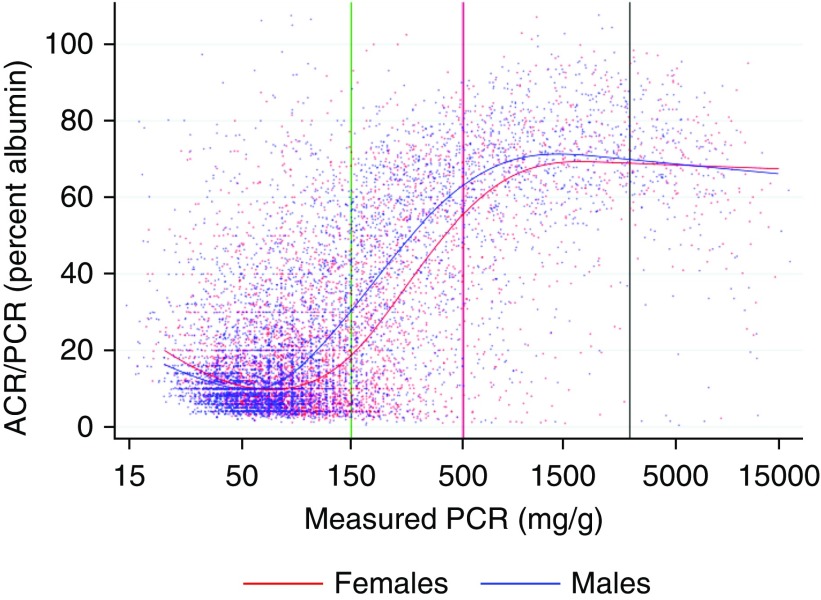
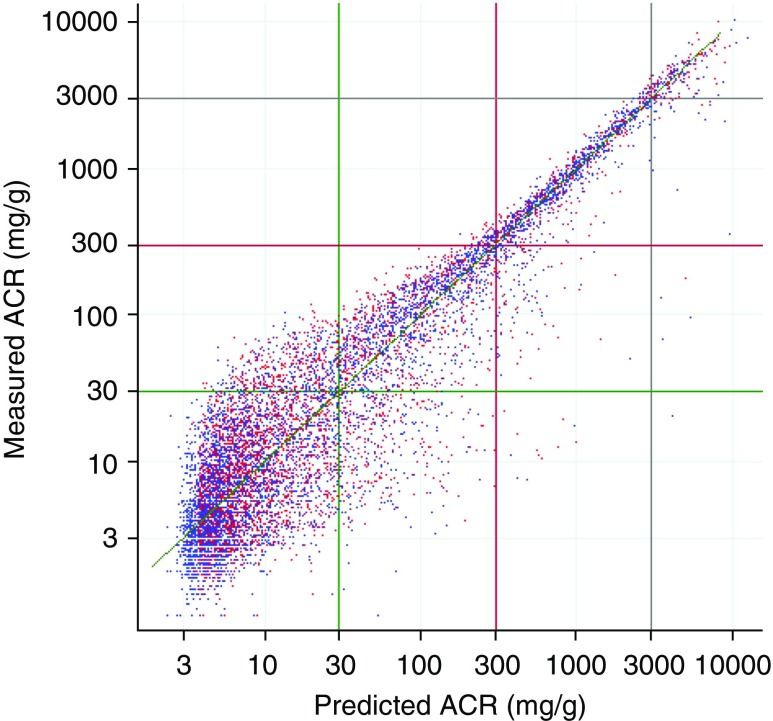
Results: We found a nonlinear association between log(ACR) and log(PCR), with the implied albumin-to-protein ratio increasing from <30% in normal to mild proteinuria to about 70% in severe proteinuria, and with wider prediction intervals at lower levels. Sex was the most important modifier of the relationship between ACR and PCR, with men generally having a higher albumin-to-protein ratio. Estimates of kidney failure risk were similar using measured ACR and ACR estimated from PCR.
Conclusions: We developed equations to estimate the median ACR from a PCR, optionally including specified covariates. These equations may prove useful in certain retrospective clinical or research applications where only PCR is available.
Keywords: albuminuria; chronic kidney disease; gender difference; proteinuria.
Copyright © 2020 by the American Society of Nephrology.
Figures


Comment in
-
Aligning Albuminuria and Proteinuria Measurements.J Am Soc Nephrol. 2020 Mar;31(3):452-453. doi: 10.1681/ASN.2020010049. Epub 2020 Feb 5. J Am Soc Nephrol. 2020. PMID: 32024664 Free PMC article. No abstract available.
-
The Estimation Formula for the Urinary Albumin-Creatinine Ratio Based on the Protein-Creatinine Ratio Are Not Valid for a Kidney Transplant and a Living Donor Cohort.J Am Soc Nephrol. 2020 Aug;31(8):1915-1916. doi: 10.1681/ASN.2020050545. Epub 2020 Jul 8. J Am Soc Nephrol. 2020. PMID: 32737207 Free PMC article. No abstract available.
-
Authors' Reply.J Am Soc Nephrol. 2020 Aug;31(8):1916-1917. doi: 10.1681/ASN.2020050707. Epub 2020 Jul 8. J Am Soc Nephrol. 2020. PMID: 32737208 Free PMC article. No abstract available.
References
-
- Matsushita K, van der Velde M, Astor BC, Woodward M, Levey AS, de Jong PE, et al.; Chronic Kidney Disease Prognosis Consortium: Association of estimated glomerular filtration rate and albuminuria with all-cause and cardiovascular mortality in general population cohorts: A collaborative meta-analysis. Lancet 375: 2073–2081, 2010. - PMC - PubMed
-
- Hemmelgarn BR, Manns BJ, Lloyd A, James MT, Klarenbach S, Quinn RR, et al.; Alberta Kidney Disease Network: Relation between kidney function, proteinuria, and adverse outcomes. JAMA 303: 423–429, 2010. - PubMed
-
- Tangri N, Stevens LA, Griffith J, Tighiouart H, Djurdjev O, Naimark D, et al.: A predictive model for progression of chronic kidney disease to kidney failure. JAMA 305: 1553–1559, 2011. - PubMed
Publication types
MeSH terms
Substances
LinkOut - more resources
Full Text Sources
Other Literature Sources
Medical
Research Materials
Miscellaneous
