. 2020 Feb 5;11(1):734.
doi: 10.1038/s41467-019-13929-1.

Combined burden and functional impact tests for cancer driver discovery using DriverPower

Collaborators, Affiliations

Combined burden and functional impact tests for cancer driver discovery using DriverPower

Shimin Shuai et al. Nat Commun. .

Erratum in

Abstract

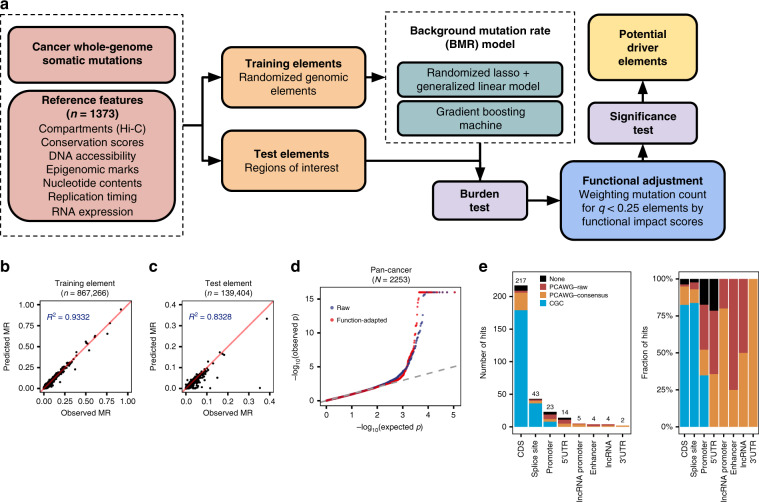
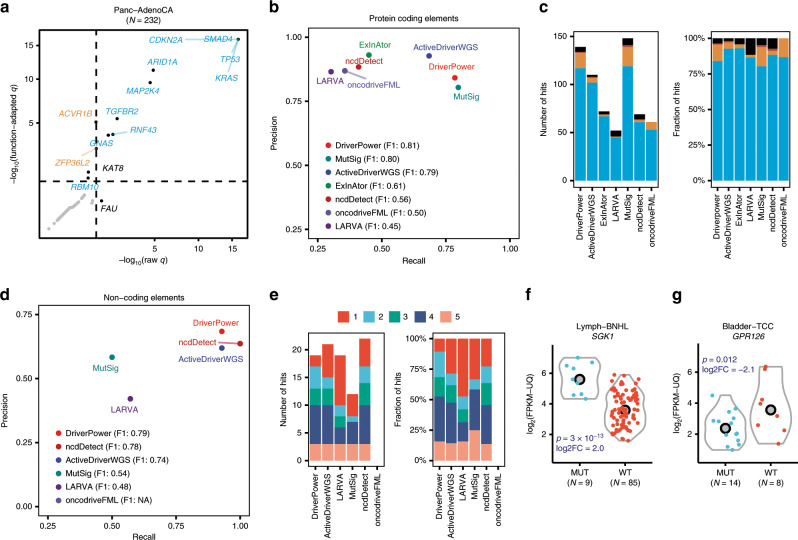
The discovery of driver mutations is one of the key motivations for cancer genome sequencing. Here, as part of the ICGC/TCGA Pan-Cancer Analysis of Whole Genomes (PCAWG) Consortium, which aggregated whole genome sequencing data from 2658 cancers across 38 tumour types, we describe DriverPower, a software package that uses mutational burden and functional impact evidence to identify driver mutations in coding and non-coding sites within cancer whole genomes. Using a total of 1373 genomic features derived from public sources, DriverPower's background mutation model explains up to 93% of the regional variance in the mutation rate across multiple tumour types. By incorporating functional impact scores, we are able to further increase the accuracy of driver discovery. Testing across a collection of 2583 cancer genomes from the PCAWG project, DriverPower identifies 217 coding and 95 non-coding driver candidates. Comparing to six published methods used by the PCAWG Drivers and Functional Interpretation Working Group, DriverPower has the highest F1 score for both coding and non-coding driver discovery. This demonstrates that DriverPower is an effective framework for computational driver discovery.


Conflict of interest statement

The authors declare no competing interests.

Figures

Fig. 1
Fig. 1. Summary of method and results.
a DriverPower overview. b, c For the training and test element sets, comparison of the predicted (Y axis) and observed (X axis) mutation rate in the pan-cancer cohort. d The raw and function-adapted p value quantile-quantile (QQ)-plot for all test elements in the pan-cancer cohort. Function-adapted p values are p values with the incorporation of functional impact scores. e Number and fraction of non-coding driver candidates called by DriverPower contained within three reference driver sets (CGC, PCAWG-consensus or PCAWG-raw). For each element type, the number of candidates is also shown above the bar.
Fig. 2
Fig. 2. Benchmarking DriverPower driver discovery performance.
a Comparison of CDS results with or without functional adjustment for Panc-AdenoCA. Dashed lines in a represent the q value = 0.1 threshold. Function-adapted q values are q values with the incorporation of functional impact scores. Only significant genes are labelled (colour legend is the same as Fig. 1e). b, c Benchmark results for coding genes compared with six other driver discovery methods. d, e Benchmark results for 3′-UTR, 5′-UTR, promoter and enhancer sets. b, d Show the precision and recall for each method according to results of 26 tumour cohorts (no melanoma and lymphoma). c Shows the number and fraction of coding driver candidates called by each method that are contained within reference gene sets. The coloured columns in c correspond to different reference driver sets (colour legend is the same as Fig. 1e). e Shows the number and fraction of non-coding driver candidates called by each method that are also called by others. The coloured columns in e correspond to the number of methods that agree on a driver candidate. f Differential expression analysis for the CDS and splice site of SGK1 in Lymph-BNHL. g Differential expression analysis for the GPR126 enhancer in Bladder-TCC. MUT indicates samples with mutated element and WT indicates samples without mutated element. Copy number corrected p values from the likelihood ratio test and the log2 fold changes (log2FC) are shown in blue.

References

    1. Stratton MR, Campbell PJ, Futreal PA. The cancer genome. Nature. 2009;458:719–724. doi: 10.1038/nature07943. - DOI - PMC - PubMed
    1. Vogelstein B, et al. Cancer genome landscapes. Science. 2013;339:1546–1558. doi: 10.1126/science.1235122. - DOI - PMC - PubMed
    1. Khurana E, et al. Role of non-coding sequence variants in cancer. Nat. Rev. Genet. 2016;17:93–108. doi: 10.1038/nrg.2015.17. - DOI - PubMed
    1. Garraway LA, Lander ES. Lessons from the cancer Genome. Cell. 2013;153:17–37. doi: 10.1016/j.cell.2013.03.002. - DOI - PubMed
    1. Martincorena I, Campbell PJ. Somatic mutation in cancer and normal cells. Science. 2015;349:1483–1489. doi: 10.1126/science.aab4082. - DOI - PubMed

Publication types