. 2020 Feb 5;11(1):736.
doi: 10.1038/s41467-019-13885-w.

High-coverage whole-genome analysis of 1220 cancers reveals hundreds of genes deregulated by rearrangement-mediated cis-regulatory alterations

Collaborators, Affiliations

High-coverage whole-genome analysis of 1220 cancers reveals hundreds of genes deregulated by rearrangement-mediated cis-regulatory alterations

Yiqun Zhang et al. Nat Commun. .

Erratum in

Abstract

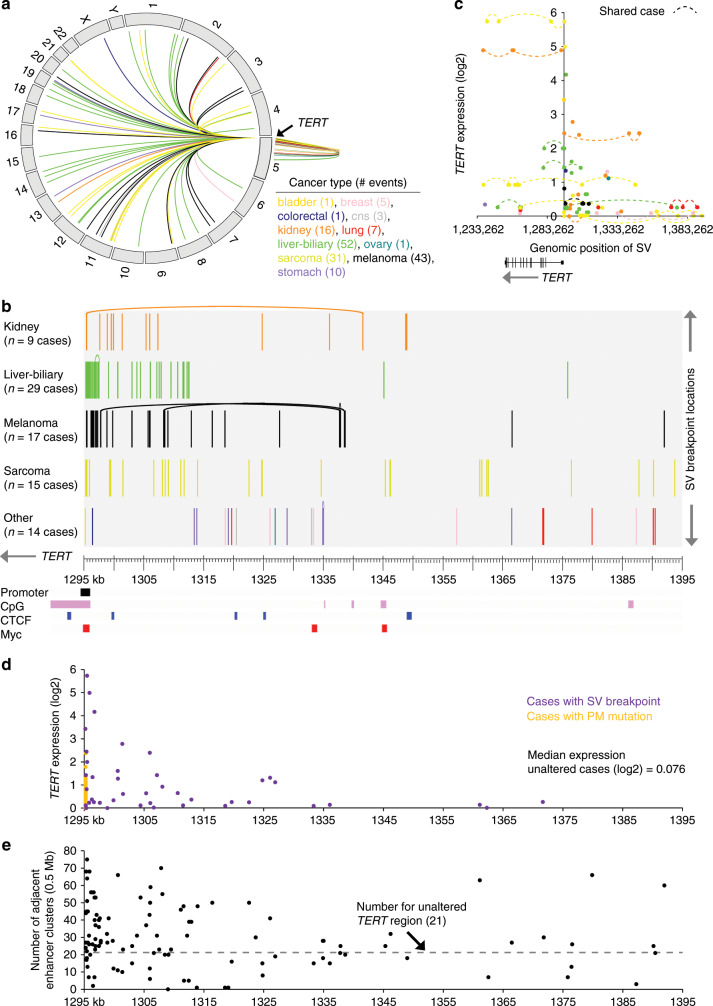
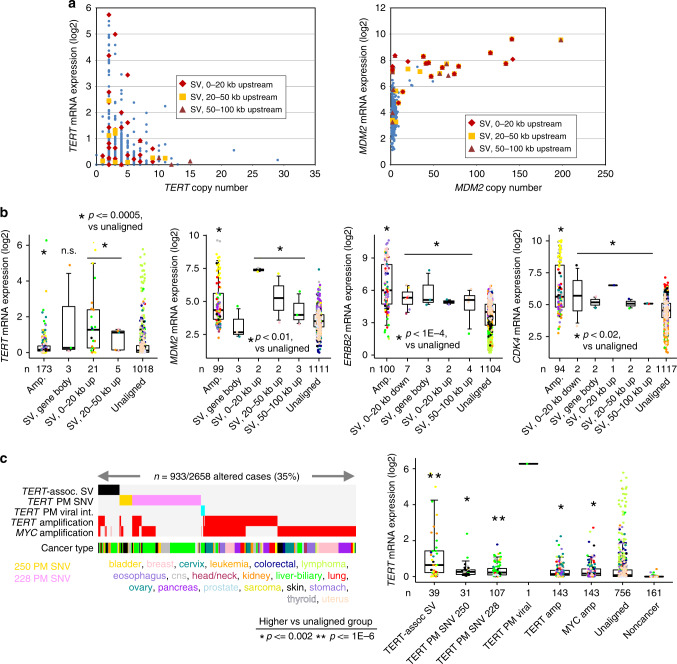
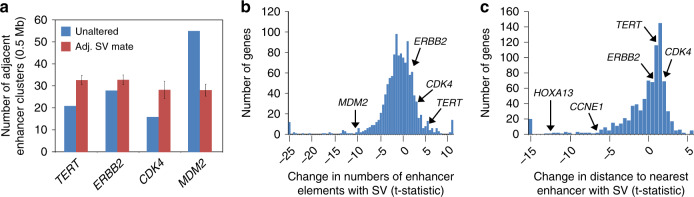
The impact of somatic structural variants (SVs) on gene expression in cancer is largely unknown. Here, as part of the ICGC/TCGA Pan-Cancer Analysis of Whole Genomes (PCAWG) Consortium, which aggregated whole-genome sequencing data and RNA sequencing from a common set of 1220 cancer cases, we report hundreds of genes for which the presence within 100 kb of an SV breakpoint associates with altered expression. For the majority of these genes, expression increases rather than decreases with corresponding breakpoint events. Up-regulated cancer-associated genes impacted by this phenomenon include TERT, MDM2, CDK4, ERBB2, CD274, PDCD1LG2, and IGF2. TERT-associated breakpoints involve ~3% of cases, most frequently in liver biliary, melanoma, sarcoma, stomach, and kidney cancers. SVs associated with up-regulation of PD1 and PDL1 genes involve ~1% of non-amplified cases. For many genes, SVs are significantly associated with increased numbers or greater proximity of enhancer regulatory elements near the gene. DNA methylation near the promoter is often increased with nearby SV breakpoint, which may involve inactivation of repressor elements.


Conflict of interest statement

The authors declare no competing interests.

Figures

Fig. 1
Fig. 1. Structural Variant (SV) breakpoints associated with altered expression of nearby genes.
a Numbers of SV breakpoints identified as occurring within a gene body, 0–20 kb upstream of a gene, 20–50 kb upstream of a gene, 50–100 kb upstream of a gene, or 0–20 kb downstream of a gene. For each SV set, the breakdown by alteration class is indicated. SVs with breakpoints located within a given gene are not included in the other upstream or downstream SV sets for that same gene. b For each of the SV sets from part (a), numbers of significant genes (p < 0.001, FDR < 4%), showing correlation between expression and associated SV event. Numbers above and below zero point of y-axis denote positively and negatively correlated genes, respectively. Linear regression models also evaluated significant associations when correcting for cancer type (red) and for both cancer type and gene copy number (green). c Heat map of significance patterns for genes from part (b) (from the model correcting for both cancer type and gene copy number). Red, significant positive correlation; blue, significant negative correlation; black, not significant (p > 0.05); gray, not assessed (<3 SV events for given gene in the given genomic region). d Significantly enriched Gene Ontology (GO) terms for genes positively correlated (p < 0.001 and FDR < 4%) with occurrence of SV upstream of the gene (for either 0–20 kb, 20–50 kb, or 50–100 kb SV sets). P-values by one-sided Fisher’s exact test. e Patterns of SV versus expression for selected gene sets from part (d) (telomerase holoenzyme complex, top; eukaryotic translation initiation factor 2B complex, middle; insulin receptor binding, bottom). Differential gene expression patterns relative to the median across sample profiles. See also Supplementary Data 1, 2 and Supplementary Fig. 1.
Fig. 2
Fig. 2. SVs associated with TERT and its increased expression.
a Circos plot showing all intra- and interchromosomal rearrangements 0–100 kb from the TERT locus. b By cancer type, SV breakpoint locations within the region ~100 kb upstream of TERT. Curved line connects two breakpoints common to the same SV. TERT promoter, CpG Islands, and CTCF and Myc binding sites along the same region are also indicated. c Gene expression levels of TERT corresponding to SVs with breakpoints located in the genomic region 0–20 kb downstream to 100 kb upstream of the gene (116 SV breakpoints involving 47 cases). d Where data available, gene expression levels of TERT corresponding to SVs from part (b). Expression levels associated with TERT promoter (PM) mutation are also represented. Median expression for unaltered cases represents cases without TERT alteration (SV, promoter mutation, amplification, viral integration) or MYC amplification. For part (d), where multiple SVs were found in the same tumor, the SV breakpoint that was closest to the TERT start site was used for plotting the expression. e Numbers of enhancer elements within a 0.5 Mb region upstream of each rearrangement breakpoint are positioned according to breakpoint location. For unaltered TERT, 21 enhancer elements were 0.5 Mb upstream of the gene. See also Supplementary Data 3.
Fig. 3
Fig. 3. SV breakpoints in proximity to key genes uniquely contribute to cases of high expression.
a For 1220 cancer cases, copy number versus expression for TERT (left) and MDM2 (right). Cases with SV events upstream of the gene are indicated. b Box plots of expression for TERT, MDM2, ERBB2, and CDK4 by alteration class (“amp.” or gene amplification: 5 or more copies, SV breakpoint within gene body, SV breakpoint 0–20 kb downstream of gene, SV breakpoint 0–20 kb upstream of gene, SV breakpoint 20–50 kb upstream of gene, SV breakpoint 50–100 kb upstream of gene, or none of the above, i.e., “unaligned”). Cases with both SV breakpoint and amplification are assigned here within the amplification group. Asterisks (“*”) denote statistically significant differences versus unaligned group as indicated. c Left: Alterations involving TERT (SV breakpoint 0–50 kb upstream of gene, somatic mutation in promoter, viral integration within TERT promoter, 5 or more gene copies of TERT or MYC) found in the set of 1220 cancers cases having both whole-genome sequencing and RNA data available. Right: Box plot of TERT expression by alteration class. “TERT amp” group does not include cases with other TERT-related alterations (SV, Single Nucleotide Variant or “SNV”, viral). P-values by Mann–Whitney U-test; “*” denotes significant differences versus unaligned group with p < = 0.002, and “**” denotes significant differences with p < 1E−6. n.s., not significant (p > 0.05). Box plots represent 5, 25, 50, 75, and 95%. Points in box plots are colored according to tumor type as indicated in part (c).
Fig. 4
Fig. 4. SVs associated with PD1/PDL1 genes and their increased expression.
a Patterns of SV, gene amplification (5 or more copies), RNF38->PDCD1LG2 gene fusion, and differential expression for CD274 (PD1 gene) and PDCD1LG2 (PDL1 gene), for the subset of cases with associated SV or amplification for either gene. Differential gene expression patterns relative to the median across sample profiles. b Gene expression levels of CD274 and of PDCD1LG2, corresponding to the position of SV breakpoints located in the surrounding genomic region on chromosome 9 (representing 66 SV breakpoints involving 19 cases). Median expression for unaltered cases represents cases without SV or amplification. See also Supplementary Data 4.
Fig. 5
Fig. 5. Translocation of enhancer elements associated with SV breakpoints near genes.
a For TERT, ERBB2, CDK4, and MDM2, average number of enhancer elements within a 0.5 Mb region upstream of each rearrangement breakpoint (considering the respective SV sets occurring 0–20 kb upstream of each gene), as compared with the number of enhancers for the unaltered gene. All differences are significant with p < 0.01 (paired t-test). Error bars denote standard error. b For 1233 genes with at least 7 SV breakpoints 0–20 kb upstream and with breakpoint mate on the distal side from the gene, histogram of t-statistics (paired t-test) comparing numbers of enhancer elements 0.5 Mb region upstream of rearrangement breakpoints with the number for the unaltered gene. Positive versus negative t-statistics denote greater versus fewer enhancers, respectively, associated with the SVs. c For 829 genes (with at least 5 SV breakpoints 0–20 kb upstream and with breakpoint mate on the distal side from the gene, where the breakpoint occurs between the gene start site and its nearest enhancer in the unaltered scenario), histogram of t-statistics (paired t-test) comparing the distance of the closest enhancer element upstream of rearrangement breakpoints with the distance for the unaltered gene. Negative t-statistics denote a shorter distance associated with the SV breakpoints. See also Supplementary Data 5.
Fig. 6
Fig. 6. Altered DNA methylation patterns associated with SV breakpoints near genes.
a Histogram of t-statistics for correlation between gene expression and DNA methylation (by Pearson’s using log-transformed expression and logit-transformed methylation), for both the entire set of 8256 genes (blue) associated with CpG islands represented on DNA methylation array platform and the subset of 263 genes (red) on methylation platform and positively correlated in expression (p < 0.001 and FDR < 4%, “OE” for “overexpressed”) with occurrence of upstream SV breakpoint (for either 0–20 kb, 20–50 kb, or 50–100 kb SV sets). b Histogram of t-statistics for correlation between gene expression and SV event (by Pearson’s using logit-transformed methylation), for both the entire set of 2316 genes (blue) with at least three cases with SV breakpoints 0–20 kb upstream and represented on methylation platform and the subset of 97 genes (red) on methylation platform and positively correlated in expression (p < 0.001 and FDR < 4%) with occurrence of SV breakpoint 0–20 kb upstream. c DNA methylation of the CpG site cg02545192 proximal to the TERT core promoter in cases with SV breakpoint 0–20 kb or 20–50 kb upstream of TERT, in cases with TERT promoter (PM) activation mutation (SNV), in cases with TERT amplification (“amp.”), and in the rest of cases (unaligned). P-values by t-test on logit-transformed methylation beta values; “*” denotes significant differences versus unaligned group with p < = 0.0001. Box plots represent 5, 25, 50, 75, and 95%. Points in box plots are colored according to tumor type as indicated. See also Supplementary Data 6 and Supplementary Fig. 2.

References

    1. Huang FW, et al. Highly recurrent TERT promoter mutations in human melanoma. Science. 2013;339:957–959. doi: 10.1126/science.1229259. - DOI - PMC - PubMed
    1. Horn S, et al. TERT promoter mutations in familial and sporadic melanoma. Science. 2013;339:959–961. doi: 10.1126/science.1230062. - DOI - PubMed
    1. Davis C, et al. The somatic genomic landscape of chromophobe renal cell carcinoma. Cancer Cell. 2014;26:319–330. doi: 10.1016/j.ccr.2014.07.014. - DOI - PMC - PubMed
    1. Yang L, et al. Analyzing somatic genome rearrangements in human cancers by using whole-exome sequencing. Am. J. Hum. Genet. 2016;98:843–856. doi: 10.1016/j.ajhg.2016.03.017. - DOI - PMC - PubMed
    1. Yang L, et al. Diverse mechanisms of somatic structural variations in human cancer genomes. Cell. 2013;153:919–929. doi: 10.1016/j.cell.2013.04.010. - DOI - PMC - PubMed

Publication types