. 2020 Feb 5;11(1):732.
doi: 10.1038/s41467-020-14407-9.

Estimating growth patterns and driver effects in tumor evolution from individual samples

Affiliations

Estimating growth patterns and driver effects in tumor evolution from individual samples

Leonidas Salichos et al. Nat Commun. .

Abstract

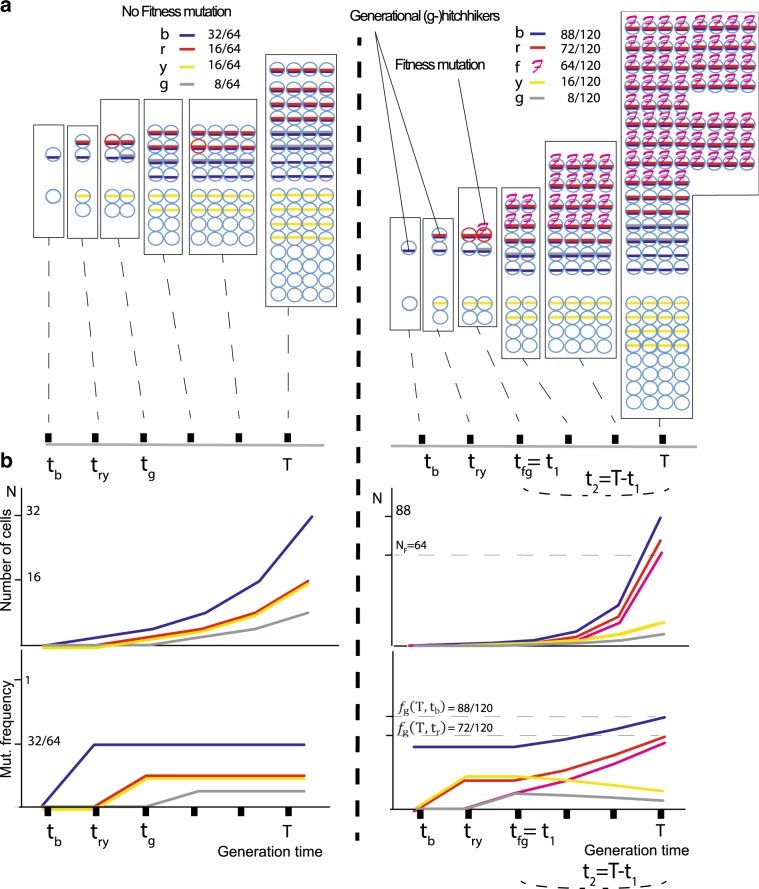
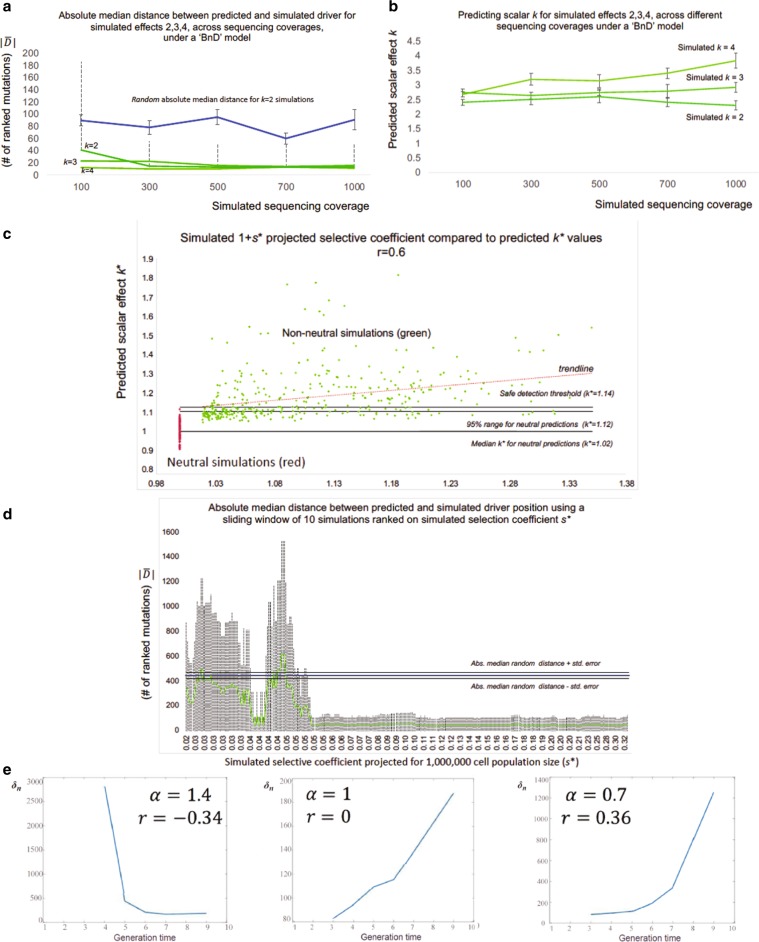
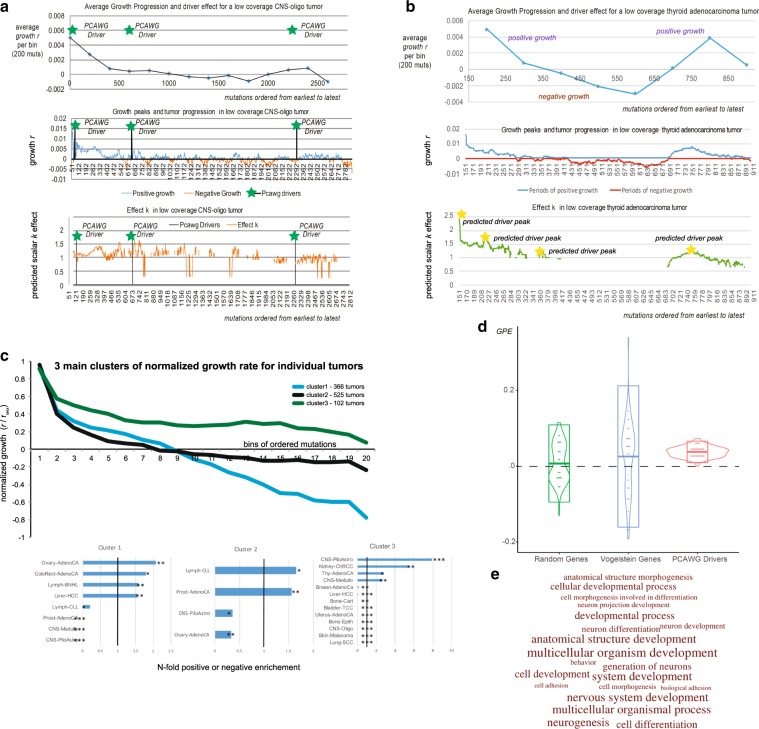
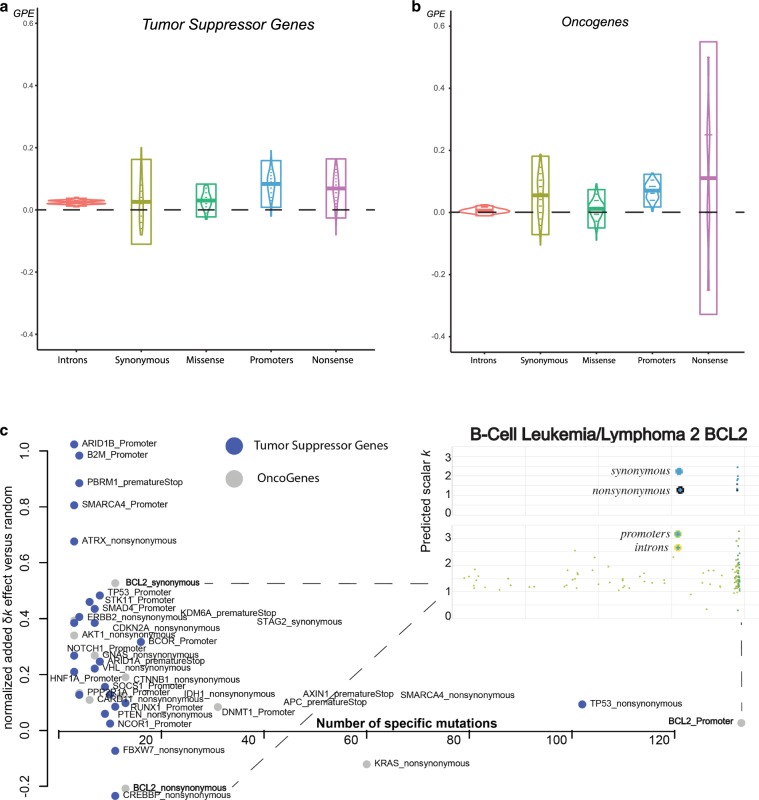
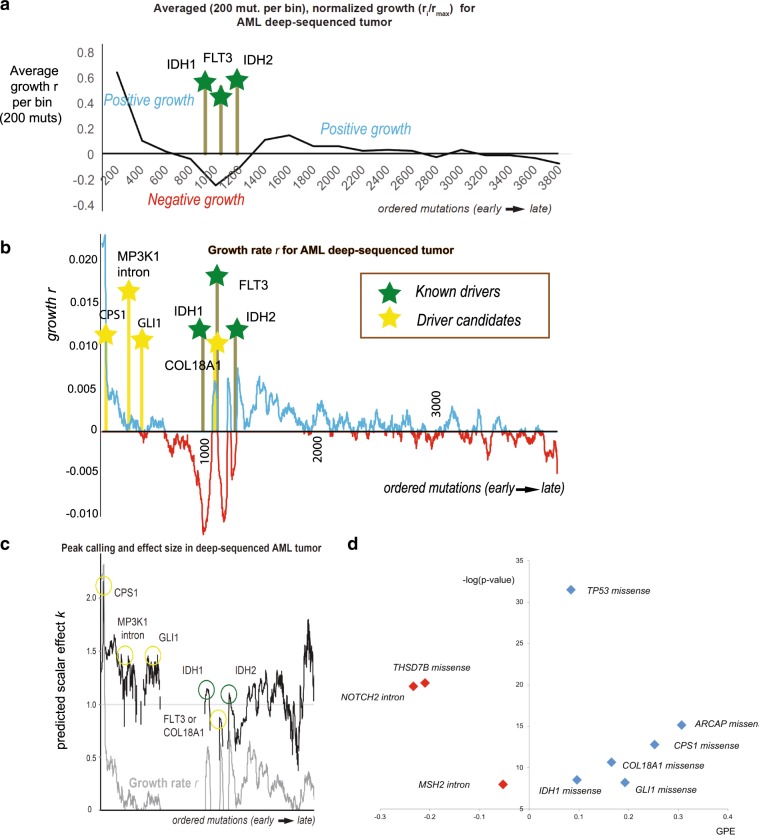
Tumors accumulate thousands of mutations, and sequencing them has given rise to methods for finding cancer drivers via mutational recurrence. However, these methods require large cohorts and underperform for low recurrence. Recently, ultra-deep sequencing has enabled accurate measurement of VAFs (variant-allele frequencies) for mutations, allowing the determination of evolutionary trajectories. Here, based solely on the VAF spectrum for an individual sample, we report on a method that identifies drivers and quantifies tumor growth. Drivers introduce perturbations into the spectrum, and our method uses the frequency of hitchhiking mutations preceding a driver to measure this. As validation, we use simulation models and 993 tumors from the Pan-Cancer Analysis of Whole Genomes (PCAWG) Consortium with previously identified drivers. Then we apply our method to an ultra-deep sequenced acute myeloid leukemia (AML) tumor and identify known cancer genes and additional driver candidates. In summary, our framework presents opportunities for personalized driver diagnosis using sequencing data from a single individual.


Conflict of interest statement

The authors declare no competing interests.

Figures

Fig. 1
Fig. 1. (g−)Hitchhikers’ frequency depends on driver’s effect.
We consider a simple population of cancer cells that grows exponentially N(t) = ert; for simplicity, we assign one mutation per cell division. At the time of biopsy T, the frequency of a mutation occurring at time tn would be equal to fnT,tn=er(Ttn)erT=ertn. At time t1, a mutation occurs that increases the growth rate r of the specific subpopulation by a scalar multiplier k, such that the new population is now expanding as NF=ekrt2. Thus, at the time of biopsy T = t1 + t2, we expect a generational (g−) hitchhiking mutation that occurred at time tm < t1 to have a frequency equal to fgT,tm=erTtm+NFert2Ntot, where Ntot is the total number of cells (or mutations) and NF is the number of cells that contain the fitness mutation that occurred at t1 and expanded for t2. Therefore NF=ekrt2. In a, we show the mutational frequencies at the time of biopsy T for two growth models; one neutral and one with a fitness mutation occurring at time t1 = tfg. Hitchhiking mutations “b” (blue), “r” (red), as well as passenger mutations “g” (gray) and “y” (yellow), also occur at different time points. b Under an exponential model with a fitness mutation occurring at time t1 = tfg, hitchhikers “b” and “r” show an increased frequency compared to neutral, subject to time and effect of the fitness mutation. Passenger mutations “y” and “g” that occurred before or with the fitness mutation, but on a different cell lineage, end up with lower frequencies. We characterize mutations “b” and “r” as generational (g−) hitchhikers since they mark the population’s generational growth.
Fig. 2
Fig. 2. Deeper coverage and stronger drivers improve predictions.
In a, using 541 simulations of tumor growth under a birth-and death model, we show the absolute median distance D~ as in “absolute number of ordered mutations” between predicted and simulated driver for sequencing depths. With the exception of k = 2 for 100× (two-tailed t test P = 0.015), we were able to detect the driver’s presence (P < 0.005). Blue line represents the random D~ as derived by selecting a random mutation from each simulation and calculate the absolute distance to the simulated driver. Dotted lines represent the 2 × σ deviation from D~ while capped bars the median’s standard error. For convenience, we only show bars for k = 2. In b, Using the same simulations, lower coverage provides less accurate k predictions with a lower effect. Capped bars represent the standard error of the median effect prediction. The three lines represent simulations with simulated effect of 2–4. In c, using the “Williams et al. 2018” algorithm, we simulated 360 nonneutral and 140 neutral tumors for 10,000 cells. Then, we adjusted our effect predictions for n* equal to 1,000,000. In addition, we also adjusted the simulated selection coefficient s* for the same populations. Pearson’s r between the simulated adjusted coefficient “1 + s*” against adjusted predicted k* was 0.6. In d, after ranking s* for every nonneutral simulation, we used a sliding window of 20 simulations to estimate D~ (and 2 ×σ) between the simulated and predicted driver within every window. Dotted lines represent 2 × σ deviation. When s* > 0.05 our driver detection became highly accurate. Blue line represents D~ for random predictions (444.5), while black lines represent median standard error (24.5). Simulated s* have been projected for n* = 1,000,000. In e, using Kingman’s coalescent theory, we show that growth estimator r^ remains qualitatively unchanged even for non g-hitchhikers. As mutational density δn increases with n, and hence with time, r^ estimator is predicted to take positive values for both constant and varying populations. Similarly, for negative growth, δn decreases with time. We let α > 1 corresponding to a decreasing and α < 1 corresponding to an increasing population.
Fig. 3
Fig. 3. Growth patterns and growth associations using 993 linear tumors.
Across 993 linear tumors from PCAWG consortium we expect an under-selection mutation to be associated with periods of positive growth. We compared several mutation types (driver mutation, mutation within geneX, within GO categoryX), to a random distribution from their respective sample for association with positive growth. a, b The averaged growth progression, mutational growth, and mutational effect, for a single low-coverage CNS-oligo tumor and a single low-coverage thyroid adenocarcinoma tumor without any PCAWG-identified drivers. Green asterisks denote the ordered position of a PCAWG-predicted driver within the sample. Yellow asterisks denote a growth peak and putative driver presence. In c, we derived three main growth patterns (steady growth, sigmoid growth, and stagnation/shrinkage) for 993 linear tumors, as they were grouped using a k-means clustering algorithm. Various cancer types showed specific enrichment or depletion for the three clusters (levels of significance for Fisher’s tests for enrichment noted as *, **, and *** for p < 0.05, 0.01, and 0.001). In d, PCAWG drivers and Vogelstein genes show significant positive growth enrichment compared to a list of random highly mutated genes. Boxplots represent 2 × σ deviation, lines represent the mean, while violin plots are trimmed to data range. e We show the GO enrichment for the 20 most affected biological processes, when we use 293 genes, significantly associated with periods of positive growth.
Fig. 4
Fig. 4. Tumor-suppressor gene and oncogene elements show growth enrichment.
We show the positive growth enrichment across different mutation types (introns, synonymous, missense, nonsense, and promoters). For a, Vogelstein tumor suppressor genes and b Vogelstein oncogenes, boxplots represent 2 × σ deviation, lines represent the mean, while violin plots are trimmed to data range. In c, we plot gene elements (e.g., {GeneX_mutation type}) from Vogelstein gene list that showed significant positive or negative enrichment. We further zoom in to BCL2’s genomic region to map missense, nonsynonymous, promoter, and intronic mutations.
Fig. 5
Fig. 5. Tumor progression on model AML liquid tumor.
In a, we show the averaged growth progression for an AML ultra-deep-sequenced tumor. We ordered the sample’s mutations from highest to lowest frequency and divided them into bins of 200 mutations. Three cancer mutations hit the tumor to establish a permanent growth (cancer mutations denoted by green bars). In b, we plot the mutational growth ri−1 for each mutation across tumor progression. The three cancer genes (IDH1 missense, FLT3 missense, and IDH2 missense) aligned well with 3 of our top 5 growth peaks (two-tailed t test p < 2.2e−16). Candidate driver mutations -denoted by yellow bar—that we identified from our PCAWG database as being associated with positive growth (see also “(d)”) aligned well with early—previously unjustified growth peaks. In c, we show each mutation’s effect in tumor progression. Effect peaks corresponds to putative drivers. d By using our PCAWG database from our previous analysis, we tested which mutations from the deep-sequenced sample were associated with positive growth. The x-axis represents positive growth enrichment, while the y-axis shows the level of significance as the negative logarithm of a two-tailed t test p value (−log(p value) > 5. Overall, we found 6 mutation types that showed significant positive enrichment across 993 PCAWG tumors, including TP53 missense (appeared during metastasis), IDH1 missense, COL18A1 missense, CPS1 missense, GLI1 missense, and SRCAP missense. Missense TP53 and SRCAP mutations are not included in graph (b) as they were metastatic mutations. For association with positive growth we tested all missense mutations (e.g., CPS1 missense), and every mutation in the sample from Vogelstein cancer genes (e.g., NOTCH2 intron).

References

    1. Heng HHQ, et al. Stochastic cancer progression driven by non-clonal chromosome aberrations. J. Cell. Physiol. 2006;208:461–472. doi: 10.1002/jcp.20685. - DOI - PubMed
    1. Loeb LA. Human cancers express mutator phenotypes: origin, consequences and targeting. Nat. Rev. Cancer. 2011;11:450–457. doi: 10.1038/nrc3063. - DOI - PMC - PubMed
    1. Nowell PC. The clonal evolution of tumor cell populations. Science. 1976;194:23–28. doi: 10.1126/science.959840. - DOI - PubMed
    1. Navin N, et al. Inferring tumor progression from genomic heterogeneity. Genome Res. 2010;20:68–80. doi: 10.1101/gr.099622.109. - DOI - PMC - PubMed
    1. Navin N, et al. Tumour evolution inferred by single-cell sequencing. Nature. 2011;472:90–94. doi: 10.1038/nature09807. - DOI - PMC - PubMed

Publication types