. 2020 Feb 5;11(1):722.
doi: 10.1038/s41467-019-14172-4.

Regulation of heterotopic ossification by monocytes in a mouse model of aberrant wound healing

Affiliations

Regulation of heterotopic ossification by monocytes in a mouse model of aberrant wound healing

Michael Sorkin et al. Nat Commun. .

Abstract

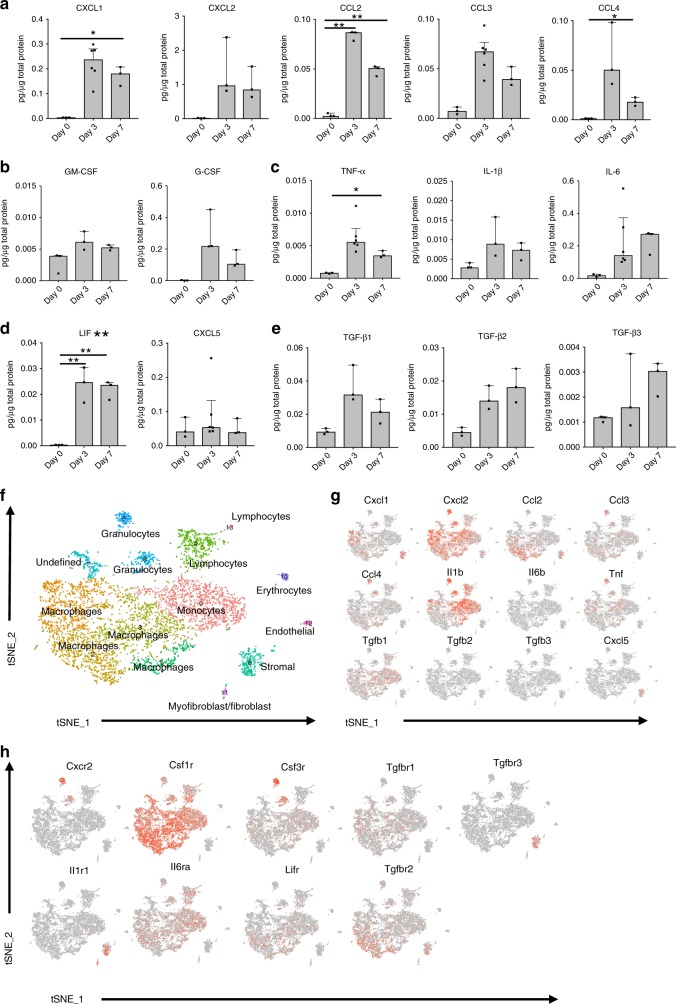
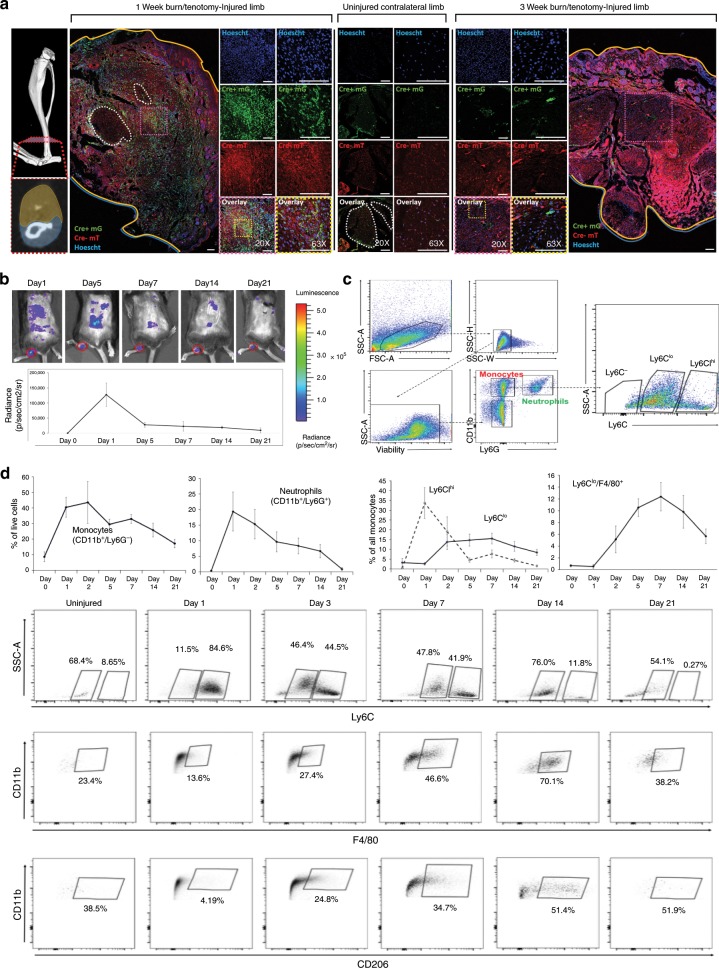
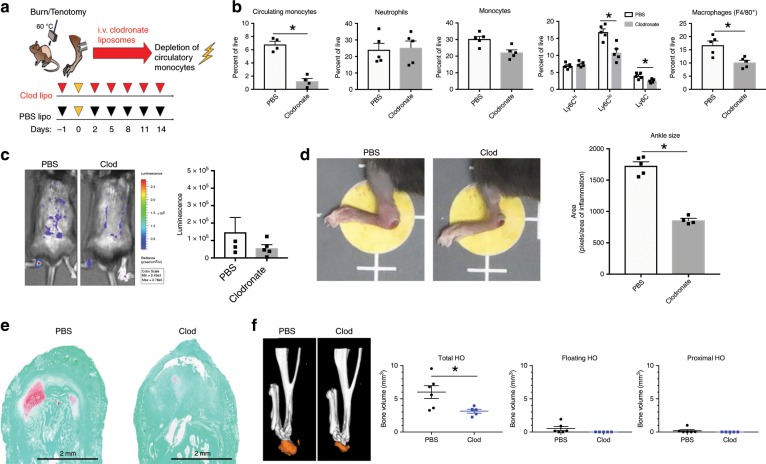
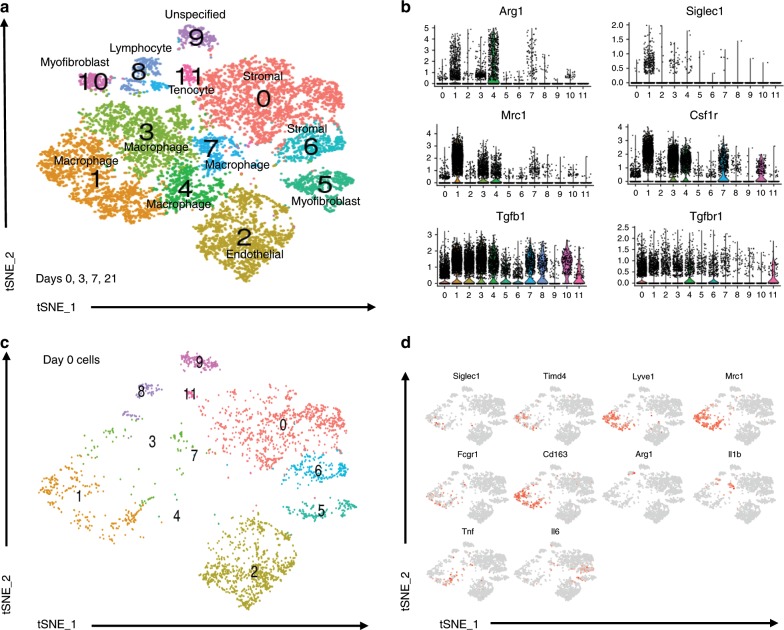
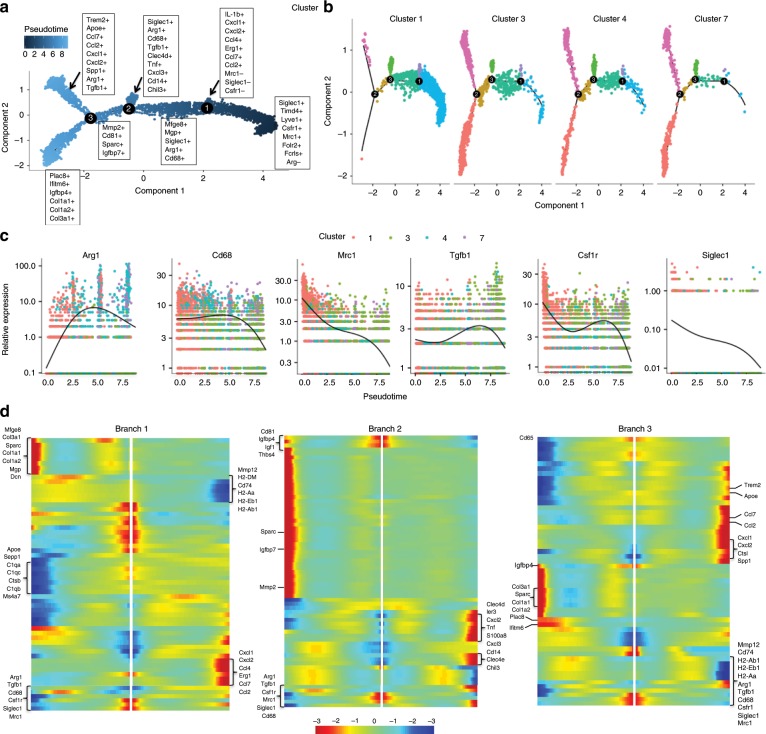
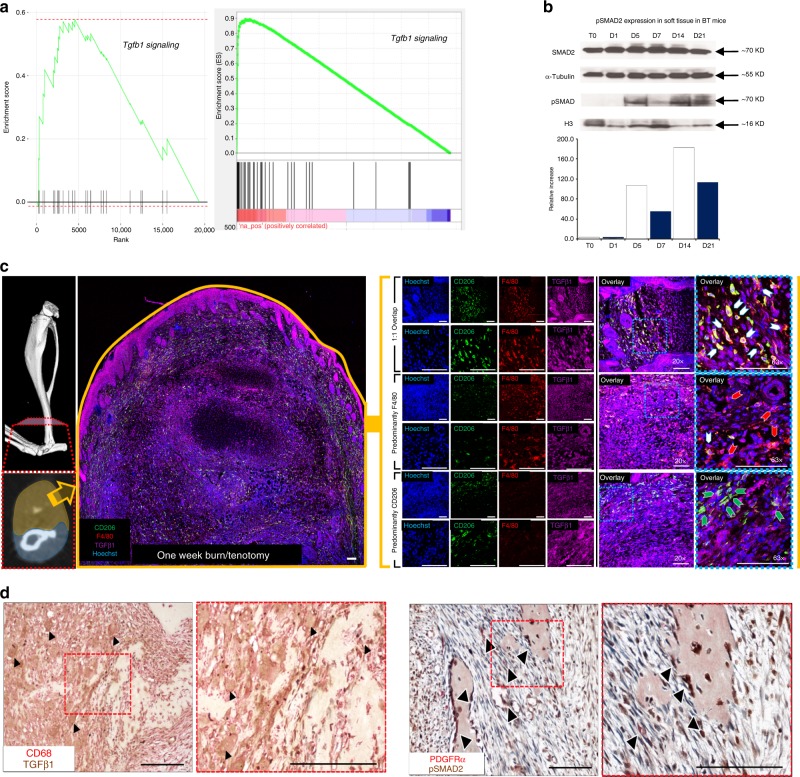
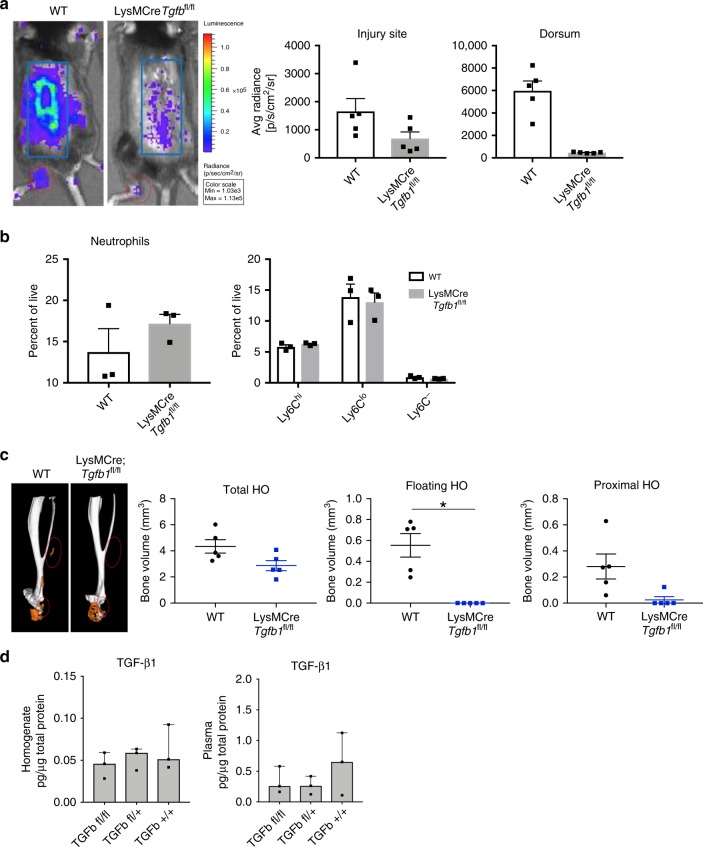
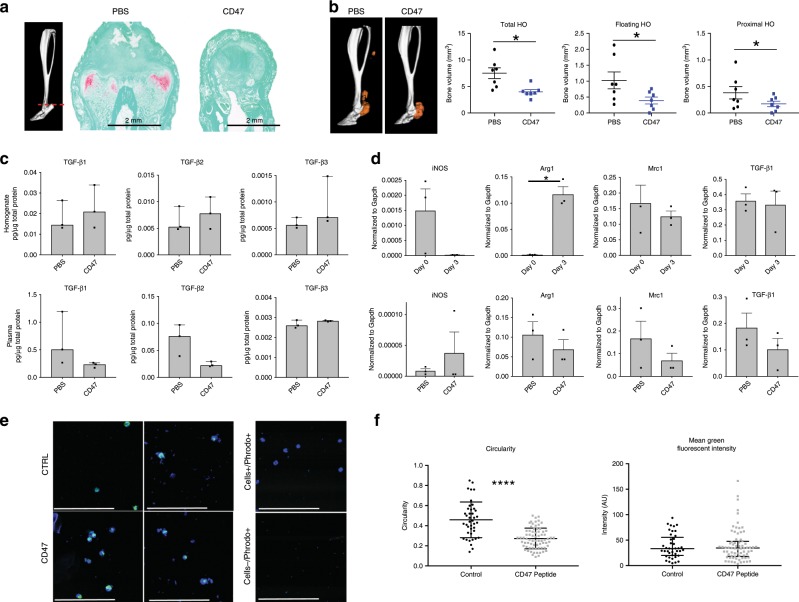
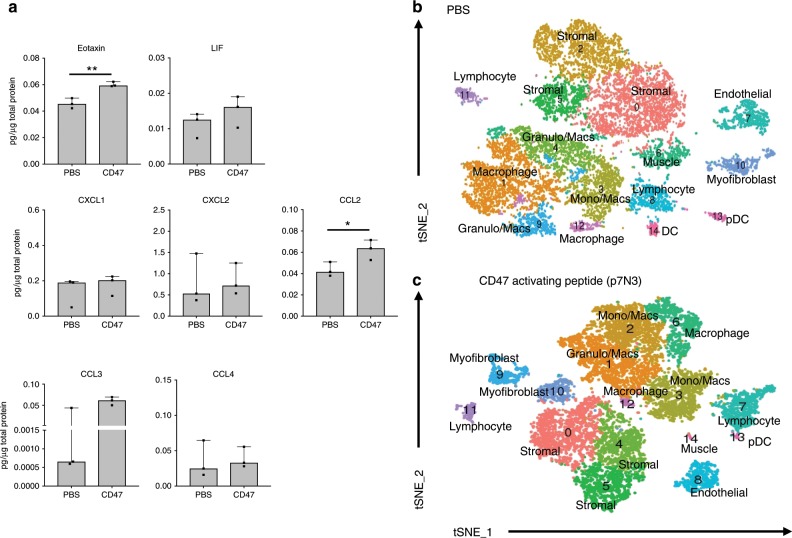
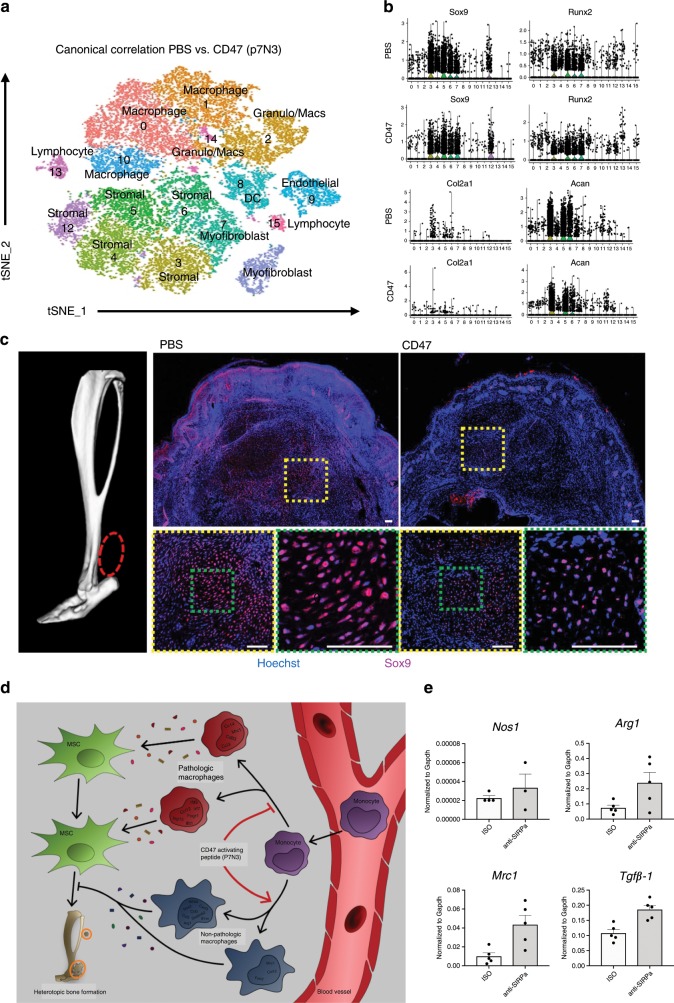
Heterotopic ossification (HO) is an aberrant regenerative process with ectopic bone induction in response to musculoskeletal trauma, in which mesenchymal stem cells (MSC) differentiate into osteochondrogenic cells instead of myocytes or tenocytes. Despite frequent cases of hospitalized musculoskeletal trauma, the inflammatory responses and cell population dynamics that regulate subsequent wound healing and tissue regeneration are still unclear. Here we examine, using a mouse model of trauma-induced HO, the local microenvironment of the initial post-injury inflammatory response. Single cell transcriptome analyses identify distinct monocyte/macrophage populations at the injury site, with their dynamic changes over time elucidated using trajectory analyses. Mechanistically, transforming growth factor beta-1 (TGFβ1)-producing monocytes/macrophages are associated with HO and aberrant chondrogenic progenitor cell differentiation, while CD47-activating peptides that reduce systemic macrophage TGFβ levels and help ameliorate HO. Our data thus implicate CD47 activation as a therapeutic approach for modulating monocyte/macrophage phenotypes, MSC differentiation and HO formation during wound healing.


Conflict of interest statement

The authors declare no competing interests.

Figures

Fig. 1
Fig. 1. Characterization of the inflammatory niche and immune cell infiltrate at the site of the extremity injury reveals a role for monocytes and macrophages in the initial phases of the pathogenesis of HO.
ac Injury site homogenates harvested from burn/tenotomy mice on day 0, 3, and 7 post burn/tenotomy. a Monocyte/Macrophage associated factors. b Monocyte/Macrophage and neutrophil maturation factors. c Cytokines stimulated by monocyte factors. d TGF family members. e Stem cell maintaining factors. Levels of cytokines and chemokines in pg/ug of total protein, data represented as the median with interquartile range. Changes in cytokines and chemokines across day 3 and day 7 vs. day 0 were analyzed by an analysis of variance (ANOVA) with post-hoc Dunnett test (n = 3 mice/time point) significance. Non-heteroscedastic data identified by Levene’s test for homogeneity of variances were alternatively analyzed by Welch statistic and post-hoc Dunnett T3. Degrees of freedom (df or df1) across samples = 2. F statistic and significant post-hoc p-values respectively: CXCL1: 30.359, p(D0 vs. D7) = 0.036, CXCL2: 8.504, CCL2: 268.773, p(D0 vs. D3) = 0.000, p(D0 vs. D7) = 0.000, CCL3: 16.430, CCL4: 22.441, p(D0 vs. D3) = 0.014, G-CSF: 12.579, GM-CSF: 4.988, IL-1b: 3.486, IL-6: 13.019, TNF-α: 38.435, p(D0 vs. D7) = 0.019, TGF-β1: 9.156, TGF-β2: 11.376, TGF-β3: 7.362, CCL5: 0.825, CXCL5: 0.825, LIF: 25.368, p(D0 vs. D3) = 0.001, p(D0 vs. D7) = 0.002 *p < .05 **p < .01. f t-SNE dimensionality reduction analysis of single cell sequencing from day 3 cells harvested at the extremity injury site revealed 14 distinct cell clusters (representative, performed in triplicate). g, h Feature plots displaying the single cell gene expression of g monocyte/macrophage cytokines and chemokines increased in the homogenates and h their receptors. Source data are provided as a Source Data file.
Fig. 2
Fig. 2. Monocyte-derived macrophages are important in the initial immune response to musculoskeletal injury and persist 3 weeks after injury.
a Immunofluorescence of LysmCre+/−/mTmGfl/fl mice at 1 and 3 weeks after injury localizing EGFP+ myeloid cells. Scale bars correspond to 100 μm. b In vivo measurement of inflammation with imaging of myeloperoxidase (MPO) activity. n = 3 mice per indicated time point. Top: representative images of each time point (scale shown: blue = low, red = high). Bottom: quantification of the total bioluminescent signal at the injury site using standardized region of interest (ROIs). c Gating strategy for flow cytometry analysis to identify inflammatory cell populations. d Left: Quantification of recruitment of inflammatory cell populations over time was analyzed using flow cytometry (n = 4 mice per time point). Right: Representative flow cytometry plots demonstrating dynamic changes in Ly6C, F4/80 and CD206 monocyte populations over 3 weeks (n = 4 mice per time point). Source data are provided as a Source Data file.
Fig. 3
Fig. 3. Macrophage depletion reduces acute inflammation and aberrant musculoskeletal wound healing.
a Schematic of experimental set-up. b Flow cytometry analysis of injury site 1 week after burn/tenotomy in mice treated with clodronate or PBS for monocytes (CD11b+ Ly6G); neutrophils (CD11b+Ly6G+); classical monocytes (CD11b+ Ly6G Ly6Chi), alternatively activated monocytes (CD11b+ Ly6G Ly6Clo) and macrophages (F4/80+). Circulating monocytes: n = 4/group, df = 8, t = −0.213, p = 0.000. Injury site: n = 4/group, df = 8. Neutrophils: t = −0.213,p = 0.837; Monocytes: t = 3.490, p = 0.008; Ly6C: t = 3.193, p = 0.013; Ly6Clow: t = 4.139, p = 0.003; Ly6Chi: t = −0.979, p = 0.356; F4/80 macrophages: t = 3.552, p = 0.007. c IVIS imaging of MPO activity 1 week after injury in mice treated with clodronate or control (n = 4 mice per treatment). Total bioluminescent signal at the injury site using standardized region of interest (ROIs) was calculated and presented as total flux in photons per second per ROI. df = 3.182, t = 1.995, p = 0.135. d Left: representative images of ankle edema present in each treatment group. Right: quantification of ankle size. n(PBS) = 5, n(Clod) = 4, df = 7, t = 11.350, p = 0.000. e Representative Safranin O staining of tendon injury site 3 weeks after burn/tenotomy in clodronate and PBS treated mice. n = 3/group. f MicroCT analysis of tenotomy site 9 weeks after burn/tenotomy in clodronate and PBS control treated mice. Left: representative 3D reconstruction. Right: quantification of unthresholded total HO, floating HO (HO not associated with tibia or calcaneus) and proximal HO (HO proximal to the calcaneus). n(PBS) = 6, n(Clod) = 5. Total HO: t = 3.302, df = 5.312, p = 0.020; Floating HO: t = 1.867, df = 5.002, p = 0.121; Proximal HO: t = 1.313, df = 9, p = 0.222. All analyses assess for homoscedasticity and difference in means via Levene’s F-test and two-tailed Student’s t-test, respectively. *p < 0.05. Source data are provided as a Source Data file.
Fig. 4
Fig. 4. Single cell RNA sequencing reveal multiple monocyte and macrophage clusters during trauma induced HO.
a Day 0, 3, 7, and 21 combined canonical correlation analysis and T-distributed stochastic neighbor embedding (t-SNE) plot identified 12 distinct cell clusters based on gene expression differences. b Violin plots of monocyte/macrophage markers (Siglec1, Arg1, Mrc1, Csfr1), Tgfb1, and Tgfbr1. c t-SNE plot displaying only those cells in the canonical correlation analysis from day 0. d Feature plots of monocyte/macrophage genes expressed to identify possible resident macrophages at the extremity injury site from day 0 cells.
Fig. 5
Fig. 5. Trajectory analysis of monocyte and macrophages from scRNA occupy differential activation states.
a Focused Monocle pseudotime trajectory analysis including only the monocyte/macrophage defined clusters 1, 3, 4, and 7 from Fig. 4a. b Monocyte/ macrophage clusters superimposed on pseudotime branches. c Cluster-defined gene expression plotted as a function of pseudotime. d Heatmaps of differentially expressed genes ordered based on their common kinetics through pseudotime displayed at each trajectory branch point as defined in our Monocle trajectory analysis of the monocyte/macrophage clusters (5a).
Fig. 6
Fig. 6. TGF-β1 expressing macrophages are present during HO formation.
a Left: GSEA analysis of microarray data collected from buffy coat of human burn injury patients at increased risk of HO compared to post-surgical control patients. Right: GSEA analysis of RNAseq performed of tendon injury site 3 weeks after burn/tenotomy in mice. b Western blot of whole tissue protein collected from the injury site of C57BL/6 J mice after burn/tenotomy at indicated time points. A western blot for p-SMAD2 and H3 was performed on the nuclear fraction and SMAD2 and alpha-Tubulin were performed on the cytosolic fraction. n = 5 were pooled for each time point. c Co-localization of F4/80+ and TGF-β1 at tendon injury site 1 week after burn/tenotomy. Scale bars correspond to 100 μm. d Left: Co-localization of CD68+ and TGF-β1 in early human HO. Right: Co-localization of p-SMAD2 and PDGFRα in human HO. Source data are provided as a Source Data file.
Fig. 7
Fig. 7. TGF-β1 expression in monocyte-derived macrophages contributes to their pathological phenotype and HO formation.
a Representative images of IVIS analysis for MPO of C57BL/6 J and LysMCre-Tgfb1fl/fl mice bred on a C57BL/6 J background at 1 week after burn/tenotomy. Right: quantification of total bioluminescence/region of interest. n = 5/group. Injury site: t = 1.898, df = 8, p = 0.094; dorsum: t = 6.385, df = 4.007, p = 0.003. b Quantification of neutrophils and monocyte subpopulations based on Ly6C using flow cytometry of injury site 1 week after burn/tenotomy in C57BL/6 J and LysMCre-Tgfb1fl/fl mice bred on a C57BL/6 J background. n = 4 mice/group. n = 3/group. Neutrophils: t = −1.125, fd = 4, p = 0.324; Ly6C-: t = 1.685, df = 4, p = 0.167; Ly6Clo: t = 0.315, df = 4, p = 0.768; Ly6Chi: t = −1.272, df = 4, p = 0.272. c MicroCT analysis of tenotomy site 9 weeks after burn/tenotomy in C57BL/6 J and LysMCre-Tgfb1fl/fl mice. Left: Representative 3D reconstruction. Right: Quantification of total HO, floating HO (not associated with tibia or calcaneus) and proximal HO (all HO proximal to calcaneus). n = 5/group. Total HO: t = 2.290, df = 0, p = 0.051; Floating HO: t = 4.591, df = 4, p = 0.008; Proximal HO: t = 2.578, df = 8, p = 0.033. d Levels of TGFβ1 in pg/ug total protein from homogenates from the extremity injury and plasma from LysMCre-Tgfb1fl/fl, LysMCre-Tgfb1fl/wt, or wild type mice 3 days after burn/tenotomy n = 3 mice in each genotype. n = 3/group, df across groups = 2. F statistics: homogenate TGFB1: 0.588, plasma TGFB1: 1.008. All pairwise comparisons were analyzed for homoscedasticity and difference in means via Levene’s F-test and two-tailed Student’s t-test, respectively. Homoscedastic and heteroscedastic multi-group analyses were performed via ANOVA + post-hoc Dunnett’s test and Welch’s comparison of means + post-hoc Dunnett’s T3 test, respectively. *p < 0.05, **p < 0.01. Source data are provided as a Source Data file.
Fig. 8
Fig. 8. CD47-activating peptide treatment alters macrophage phenotype.
a Representative Safranin O stain of tendon injury site 3 weeks after burn/tenotomy in p7N3 (CD47 agonist) treated and PBS control mice. n = 3/group. b MicroCT analysis of tenotomy site 9 weeks after burn/tenotomy in PBS and p7N3 (CD47 agonist) treated mice. Left: Representative 3D reconstruction. Right: Quantification of total HO, floating HO and proximal HO. n = 7/group. Total HO: t = 3.415, df = 7.840, p = 0.009; Floating HO: t = 2.201, df = 12, p = 0.048; Proximal HO: t = 2.686, df = 8.549, p = 0.026. c Levels of TGF-β1, TGFβ2, and TGFβ3 in pg/ug total protein and represented as median with interquartile range from Top: homogenates from the extremity injury (TGF-β1: t = −0.635, df = 4, p = 0.560; TGF-β2: t = −0.643, df = 4, p = 0.555; TGF-β3: t = −1.272, df = 2.186, p = 0.322) and Bottom: plasma from PBS and p7N3 (CD47) peptide treated mice 3 days after burn/tenotomy (TGF-β1: t = 1.544, df = 2.037, p = 0.260; TGF-β2: t = 2.747, df = 4, p = 0.052; TGF-β3: t = −1.492, df = 4, p = 0.210). n = 3 mice per treatment group. d qPCR analysis of M1 (iNos) and M2 (Arg1 and Mrc1) macrophage markers and Tgfb1 in macrophages isolated from the extremity injury site of naive (day 0), burn/tenotomy day 3, burn/tenotomy day 3 treated with PBS, and burn/tenotomy day 3 treated with p7N3 (CD47) peptide. Day 0 vs. Day 3—iNOS: t = 2.020, df = 2, p = 0.181; Arg1: t = −6.084, df = 3, p = 0.009; Mrc1: t = 0.703, df = 4, p = 0.521; Tgfb1: t = 0.253, df = 4, p = 0.812. PBS vs. CD47 – iNOS: t = −0.834, df = 2.043, p = 0.491; Arg1: t = 0.895, df = 4, p = 0.421; Mrc1: t = 1.176, df = 4, p = 0.305; Tgfb1: t = 1.186, df = 4, p = 0.301. e Representative images of phagocytosis assay using macrophages isolated from the extremity injury at day 3 after burn/tenotomy in mice treated with PBS or p7N3 (CD47). PBS n = 3, CD47 n = 4 approximately 25 cells/mouse. f Measurement of cellular circularity Circularity: t = 6.119, df = 55.537, p = 0.000 and quantification of mean fluorescent intensity phagocytosed by each macrophage. MFI: t = −0.357, df = 111, p = 0.722. Source data are provided as a Source Data file.
Fig. 9
Fig. 9. CD47-activating peptide treatment alters the transcriptional profile of macrophages.
a Changes in cytokine and chemokine levels from homogenates in mice treated with PBS or p7N3 (CD47-activating peptide) 3 days after burn/tenotomy. Eotaxin: t = −5.838, df = 4, p = 0.004; LIF: t = −1.162, df = 4, p = 0.310; IL15: t = −2.550, df = 4, p = 0.063; CXCL1: t = −0.604, df = 4, p = 0.578; CCL2: t = −2.870, df = 4, p = 0.045; CCL3: t = −1.492, df = 2, p-0.274; CCL4: t = −0.218, df = 4, p = 0.838. b, c t-SNE dimensionality reduction analysis of single cell sequencing performed on cells from 1 week burn/tenotomy harvested from the site of extremity injury revealed 15 distinct cell clusters in both b PBS and c p7N3 (CD47) treated mice (representative performed in triplicate). Source data are provided as a Source Data file.
Fig. 10
Fig. 10. CD47-activating peptide treatment alters mesenchymal stem cell differentiation independent of the action of SIRPα.
a PBS and p7N3 (CD47 agonist) treatment combined canonical correlation analysis and T-distributed stochastic neighbor embedding (t-SNE) plot identified 16 distinct cell clusters based on gene expression differences. b Violin plots for expression of chondrogenic and osteogenic genes. c Immunofluorescence for SOX9 in p7N3 (CD47 agonist) treated and PBS vehicle control specimens 10 days after burn/tenotomy. Scale bar represents 100 μm. All pairwise comparisons were analyzed for homoscedasticity and difference in means via Levene’s F-test and two-tailed Student’s t-test, respectively. *p < 0.05, **p < 0.01. d Cartoon diagram of macrophage participation in the formation of HO and mechanism of action of p7N3, CD47-activating peptide treatment. e Normalized expression of Nos2, Arg1, Mrc1, and Tgfβ1 from macrophages isolated from the HO site after burn/tenotomy and treatment with vehical (veh) or anti-SIRPα. Source data are provided as a Source Data file.

References

    1. Sluys KP, Shults J, Richmond TS. Health related quality of life and return to work after minor extremity injuries: A longitudinal study comparing upper versus lower extremity injuries. Injury. 2016;47:824–831. doi: 10.1016/j.injury.2016.02.019. - DOI - PMC - PubMed
    1. Lin SH, Lee HY, Chang YY, Jang Y, Wang JD. Estimation of life expectancies and loss-of-life expectancies for workers with permanent occupational disabilities of the extremities–a 21-year follow-up study. Scand. J. Work Environ. Health. 2012;38:70–77. doi: 10.5271/sjweh.3194. - DOI - PubMed
    1. Agarwal S, Sorkin M, Levi B. Heterotopic ossification and hypertrophic scars. Clin. Plast. Surg. 2017;44:749–755. doi: 10.1016/j.cps.2017.05.006. - DOI - PMC - PubMed
    1. Dolan CP, Dawson LA, Muneoka K. Digit tip regeneration: merging regeneration biology with regenerative medicine. Stem Cells Transl. Med. 2018;7:262–270. doi: 10.1002/sctm.17-0236. - DOI - PMC - PubMed
    1. Zhang B, Li S, Miao D, Zhao C, Wang L. Risk factors of cage subsidence in patients with ossification of posterior longitudinal ligament (OPLL) after anterior cervical discectomy and fusion. Med. Sci. Monit. 2018;24:4753–4759. doi: 10.12659/MSM.910964. - DOI - PMC - PubMed

Publication types

MeSH terms