. 2020 Feb 5;11(1):715.
doi: 10.1038/s41467-020-14605-5.

Transcriptional effects of copy number alterations in a large set of human cancers

Affiliations

Transcriptional effects of copy number alterations in a large set of human cancers

Arkajyoti Bhattacharya et al. Nat Commun. .

Abstract

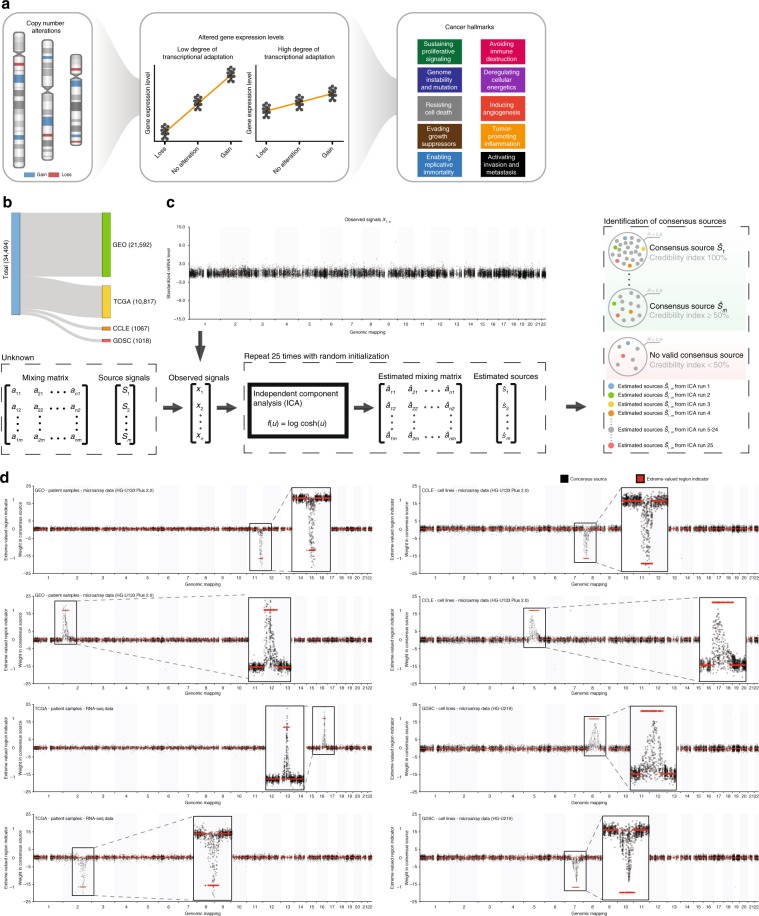
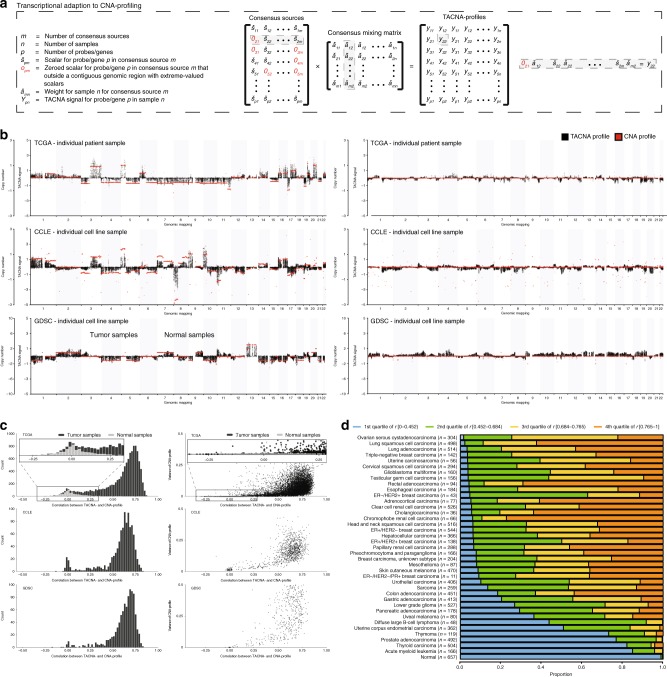
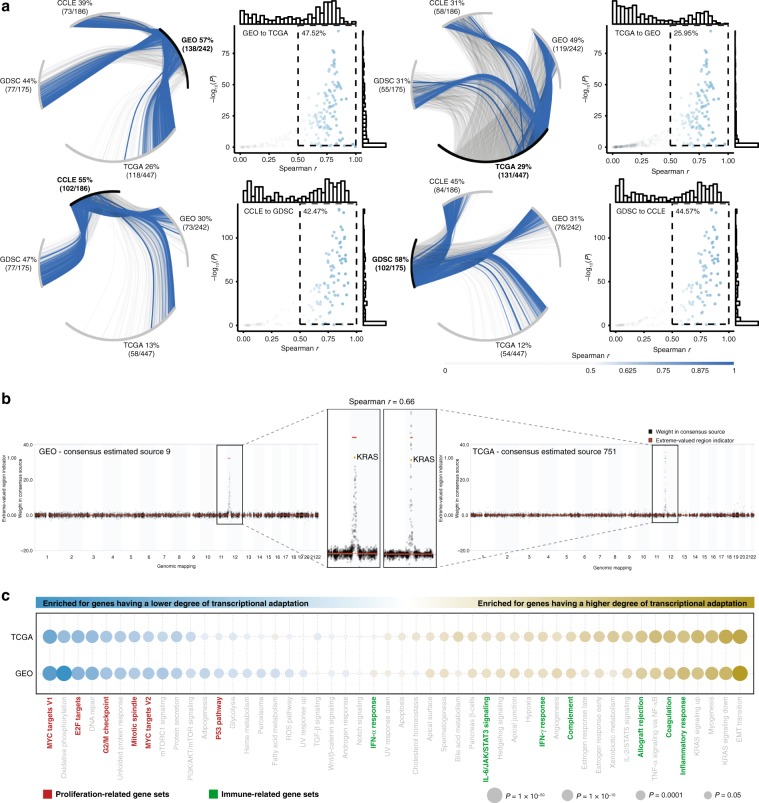
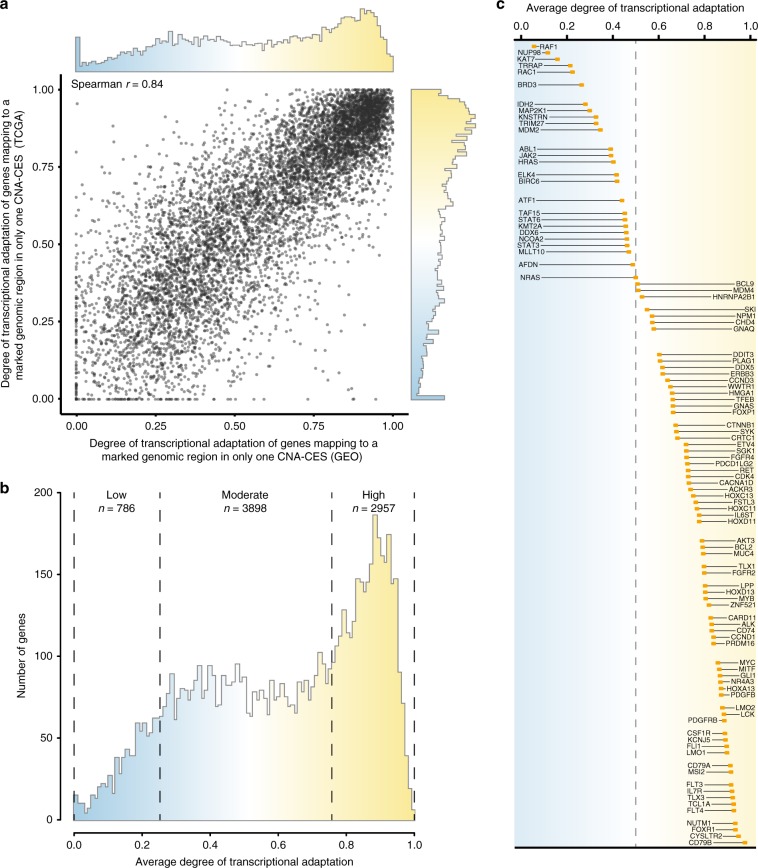
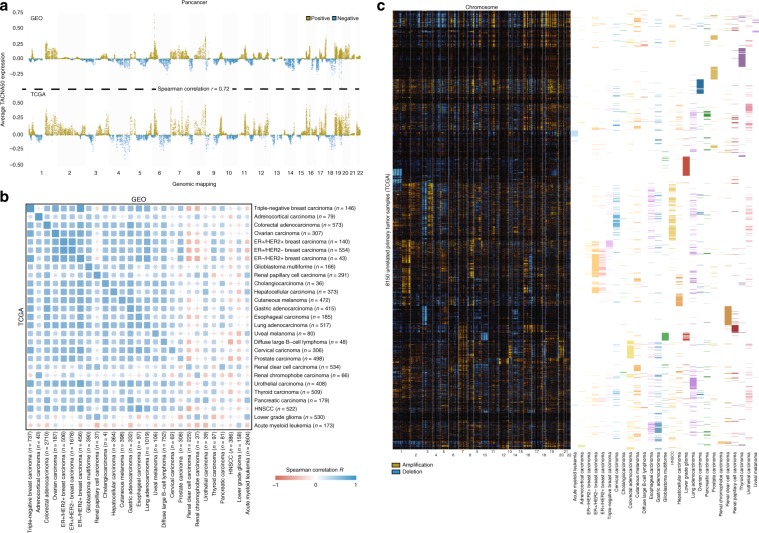
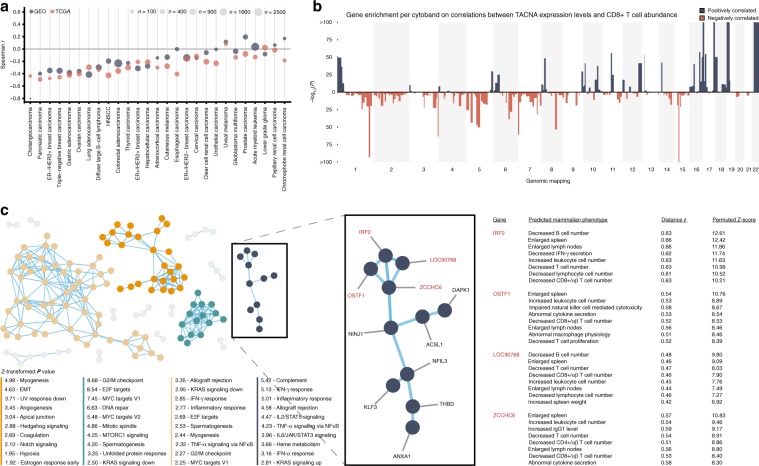
Copy number alterations (CNAs) can promote tumor progression by altering gene expression levels. Due to transcriptional adaptive mechanisms, however, CNAs do not always translate proportionally into altered expression levels. By reanalyzing >34,000 gene expression profiles, we reveal the degree of transcriptional adaptation to CNAs in a genome-wide fashion, which strongly associate with distinct biological processes. We then develop a platform-independent method-transcriptional adaptation to CNA profiling (TACNA profiling)-that extracts the transcriptional effects of CNAs from gene expression profiles without requiring paired CNA profiles. By applying TACNA profiling to >28,000 patient-derived tumor samples we define the landscape of transcriptional effects of CNAs. The utility of this landscape is demonstrated by the identification of four genes that are predicted to be involved in tumor immune evasion when transcriptionally affected by CNAs. In conclusion, we provide a novel tool to gain insight into how CNAs drive tumor behavior via altered expression levels.


Conflict of interest statement

E.G.E.d.V. reports institutional financial support for advisory board/consultancy from Sanofi, Daiichi, Sankyo, NSABP, Pfizer and Merck, and institutional financial support for clinical trials or contracted research from Amgen, Genentech, Roche, AstraZeneca, Synthon, Nordic Nanovector, G1 Therapeutics, Bayer, Chugai Pharma, CytomX Therapeutics and Radius Health, all unrelated to the submitted work. All other authors declare no competing interests.

Figures

Fig. 1
Fig. 1. Data acquisition and decomposition of gene expression profiles.
a CNAs can promote tumor progression via altering expression levels of genes located at the affected genomic regions. However, due to transcriptional adaptation mechanisms, changes in gene copy number at the genomic level do not always translate proportionally into altered mRNA expression levels. Unraveling the degree of transcriptional adaptation to CNAs for all genes will greatly contribute to our knowledge how CNAs drive tumor progression. b Number of gene expression profiles collected from GEO, TCGA, CCLE, and GDSC. c Identification of underlying regulatory factors of the mRNA transcriptome. We hypothesized that the observed gene expression in a gene expression profile is the result of (i) the effect of underlying regulatory factors (i.e., source signals) on expression levels of individual genes and (ii) the activity of these underlying regulatory factors in a complex biopsy (i.e., mixing matrix). ICA was used to capture the number and nature of these underling regulatory factors for all four datasets separately. This resulted in estimated sources, representing the effects of independent underlying regulatory factors on the expression levels of individual genes, and a mixing matrix reflecting the activity of each estimated source in each gene expression profile. ICA was run 25 times with random initialization, followed by consensus sources estimation using a credibility index ≥50%. d Examples of CNA-CESs harboring a pattern in which only genes mapping to a specific contiguous genomic region had a high absolute weight. The red line shows whether genomic regions were marked as having a significant number of genes with a high absolute weight by the detection algorithm (i.e., extreme-valued region indicator).
Fig. 2
Fig. 2. Transcriptional adaptation to CNA profiling (TACNA profiling).
a Transcriptional adaptation to CNA (TACNA) profiling. For each dataset, weights of genes mapping to a contiguous genomic region in CNA-CESs marked by the detection algorithm were retained in the CES matrix. Weights of genes that mapped outside marked genomic regions were instead set to zero. Next, TACNA profiles were calculated as the product between this transformed CES matrix and the consensus mixing matrix. b Examples of TACNA profiles illustrating that the resulting patterns clearly matched those in their paired, independently generated CNA profiles. c Left panel: distribution of Pearson correlations between TACNA profiles and paired CNA profiles for the TCGA, CCLE, and GDSC datasets. Right panel: variance observed in CNA profiles versus the Pearson correlation between CNA profiles and paired TACNA profiles for the TCGA, CCLE, and GDSC datasets. d Quartiles distribution plot of Pearson correlations between TACNA profiles and paired CNA profiles, per tumor type in the TCGA dataset. ER: estrogen receptor; HER2: human epidermal growth factor receptor 2; PR: progesterone receptor.
Fig. 3
Fig. 3. Degree of transcriptional adaptation to CNAs.
a Citrus plots showing the Spearman correlations between CNA-CESs in the reference dataset, depicted in bold, with CNA-CESs in the other three datasets. Blue lines indicate r > 0.5. Correlations are calculated based on the weights of genes in marked genomic regions of the CNA-CESs under investigation. Each scatterplot with marginal histograms shows the correlations versus their −log10 transformed P values. The inset shows correlations > 0.5 having a P value < 0.05. b Example of a CNA-CESs in the GEO dataset that is highly correlated with a CNA-CES in the TCGA dataset with KRAS having a low degree of transcriptional adaptation to CNAs. Spearman correlation coefficient was derived using the genes mapping to the extreme-valued region from either of the CNA-CESs (n = 38). c Enrichment results using two-sided Welch’s t-test for the MSigDB Hallmark collection. A yellow bubble indicates enrichment for genes with a high degree of transcriptional adaptation to CNAs, and a blue bubble indicates a low degree. The size of the bubble corresponds to the significance level. Only CNA-CESs having at least 50 genes in their marked region were included. EMT: epithelial-mesenchymal transition; ROS: reactive oxygen species.
Fig. 4
Fig. 4. Degree of transcriptional adaptation to CNAs per individual gene.
a Degree of transcriptional adaptation to CNAs for individual genes mapping to a marked genomic region in a single CNA-CES in both the GEO and TCGA dataset (n = 7641). b Distribution of the average degree of transcriptional adaptation to CNAs for genes mapping to a marked genomic region in a single CNA-CES in both the GEO and TCGA dataset. c Average degree of transcriptional adaptation to CNA for a set of oncogenes obtained from the Catalogue of Somatic Mutations in Cancer Gene Census.
Fig. 5
Fig. 5. The landscape of transcriptional effects of CNAs in a large set of cancer samples.
a Average pan-cancer TACNA profiles in GEO and TCGA dataset. Spearman correlation coefficient was derived using the 15,389 genes which were present in both datasets. b Distance matrix of Spearman correlations between average TACNA profiles in the GEO dataset and TCGA dataset for overlapping tumor types. The size and transparency of a square corresponds to the absolute correlation coefficient. HNSCC: head and neck squamous cell carcinoma. c Hierarchical clustering of the landscape of transcriptional effects of CNAs in the TCGA dataset for 8150 cancer samples of tumor types also present in the GEO dataset.
Fig. 6
Fig. 6. Transcriptional effects of CNAs in relation to inferred immunological phenotypes.
a Per tumor type, Spearman correlations between inferred CNA burden and an expression-based metric describing CD8+ T cell activity for each sample. b Manhattan plot showing, the enrichment (−log10 P value on the y-axis) for genes with a strong correlation between TACNA expression level and inferred CD8+ T cell abundance per cytogenetic band defined according to the MSigDB Positional gene sets collection. c Left panel: constructed co-functionality network for the top 350 genes with the highest inverse correlation between their TACNA expression levels and CD8+ T cell abundance. Middle panel: cluster in which genes share strong predicted co-functionality (r > 0.8) within the co-functionality network that was enriched with genes predicted to be involved in immunological processes (e.g., complement, inflammatory response, and IFN-γ response). Right panel: a GBA strategy with >106,000 expression profiles in combination with the gene set collection obtained from the Mammalian Phenotype (MP) Ontology predicted for the genes IRF2, OSTF1, LOC90768, and ZCCHC6 that altered transcription results in a decreased CD8+/αβ T cell number.

References

    1. Negrini S, Gorgoulis VG, Halazonetis TD. Genomic instability an evolving hallmark of cancer. Nat. Rev. Mol. Cell Biol. 2010;11:220–228. doi: 10.1038/nrm2858. - DOI - PubMed
    1. Davoli T, et al. Cumulative haploinsufficiency and triplosensitivity drive aneuploidy patterns and shape the cancer genome. Cell. 2013;155:948–962. doi: 10.1016/j.cell.2013.10.011. - DOI - PMC - PubMed
    1. Stranger BE, et al. Relative impact of nucleotide and copy number variation on gene expression phenotypes. Science. 2007;315:848–853. doi: 10.1126/science.1136678. - DOI - PMC - PubMed
    1. Henrichsen CN, et al. Segmental copy number variation shapes tissue transcriptomes. Nat. Genet. 2009;41:424–429. doi: 10.1038/ng.345. - DOI - PubMed
    1. Tang YC, Amon A. Gene copy-number alterations: a cost-benefit analysis. Cell. 2013;152:394–405. doi: 10.1016/j.cell.2012.11.043. - DOI - PMC - PubMed

Publication types