. 2020 Feb 5;11(1):730.
doi: 10.1038/s41467-020-14351-8.

Inferring structural variant cancer cell fraction

Collaborators, Affiliations

Inferring structural variant cancer cell fraction

Marek Cmero et al. Nat Commun. .

Erratum in

  • Author Correction: Inferring structural variant cancer cell fraction.
    Cmero M, Yuan K, Ong CS, Schröder J; PCAWG Evolution and Heterogeneity Working Group; Corcoran NM, Papenfuss T, Hovens CM, Markowetz F, Macintyre G; PCAWG Consortium. Cmero M, et al. Nat Commun. 2022 Dec 8;13(1):7568. doi: 10.1038/s41467-022-32338-5. Nat Commun. 2022. PMID: 36481724 Free PMC article. No abstract available.

Abstract

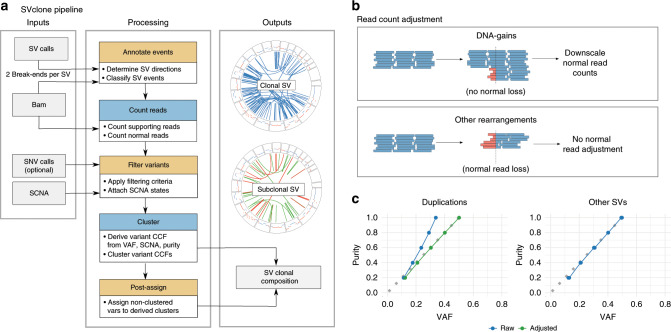
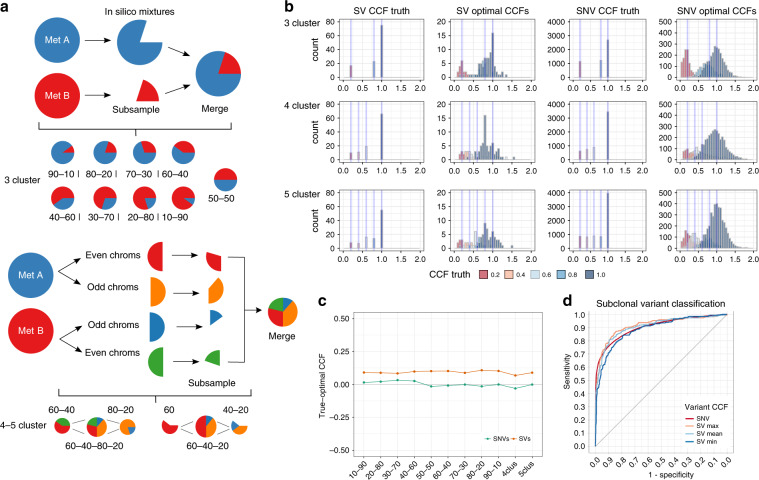
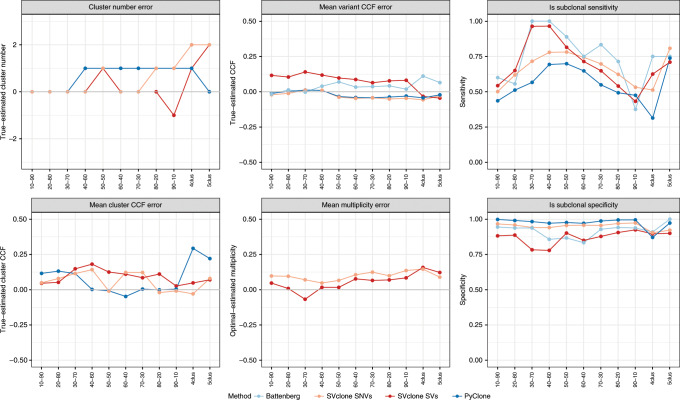
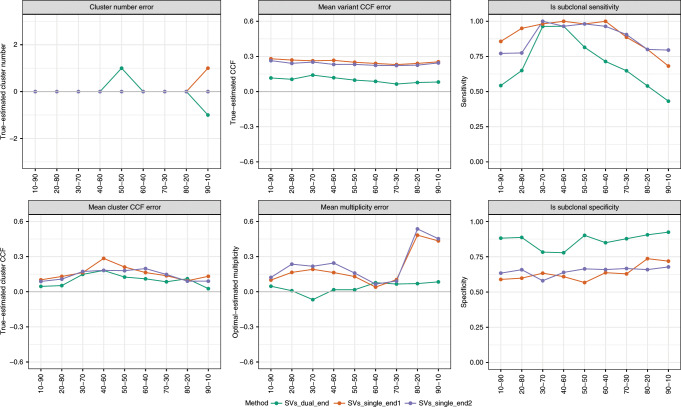
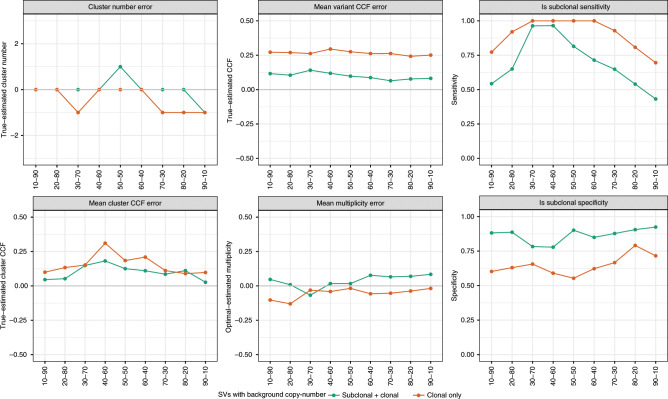
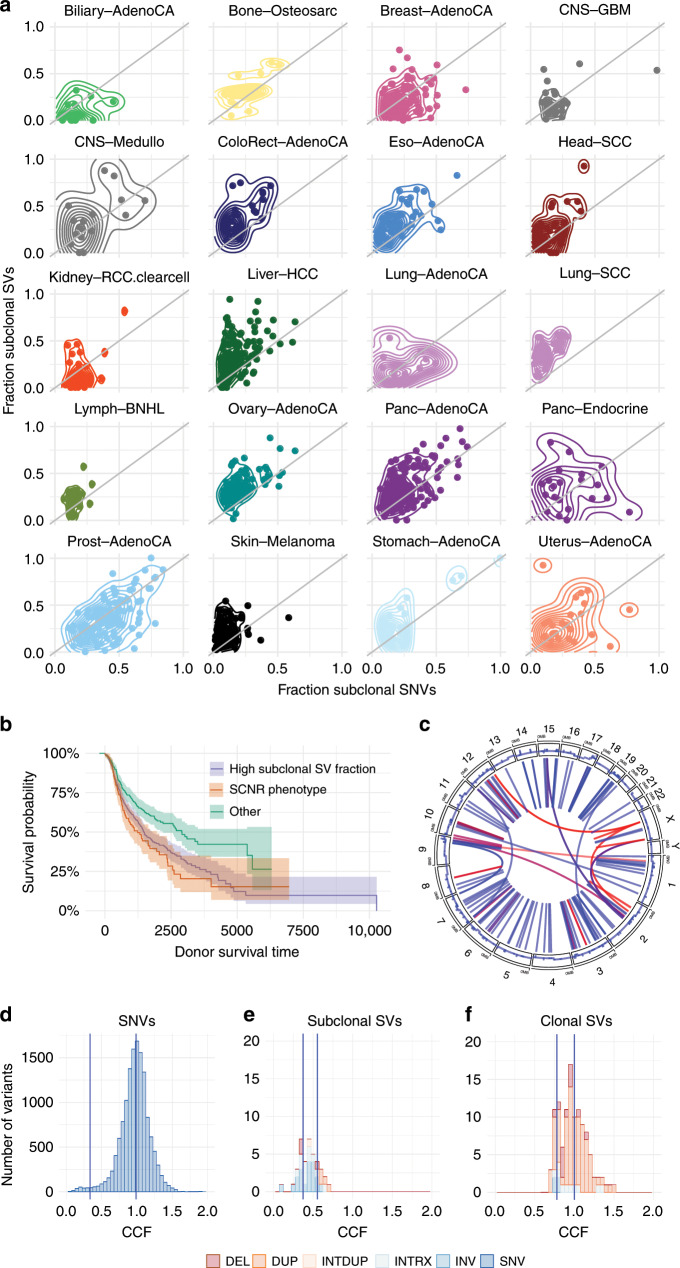
We present SVclone, a computational method for inferring the cancer cell fraction of structural variant (SV) breakpoints from whole-genome sequencing data. SVclone accurately determines the variant allele frequencies of both SV breakends, then simultaneously estimates the cancer cell fraction and SV copy number. We assess performance using in silico mixtures of real samples, at known proportions, created from two clonal metastases from the same patient. We find that SVclone's performance is comparable to single-nucleotide variant-based methods, despite having an order of magnitude fewer data points. As part of the Pan-Cancer Analysis of Whole Genomes (PCAWG) consortium, which aggregated whole-genome sequencing data from 2658 cancers across 38 tumour types, we use SVclone to reveal a subset of liver, ovarian and pancreatic cancers with subclonally enriched copy-number neutral rearrangements that show decreased overall survival. SVclone enables improved characterisation of SV intra-tumour heterogeneity.


Conflict of interest statement

R.B. owns equity in Ampressa Therapeutics. G.G. receives research funds from IBM and Pharmacyclics and is an inventor on patent applications related to MuTect, ABSOLUTE, MutSig, MSMuTect and POLYSOLVER. I.L. is a consultant for PACT Pharma. B.J.R. is a consultant at and has ownership interest (including stock, patents, etc.) in Medley Genomics. All the other authors have no competing interests.

Figures

Fig. 1
Fig. 1. Pipeline schematic and VAF calculation adjustment.
a A flow-chart of the SVclone pipeline. b A schematic showing the adjustments required for DNA-gains (top) and all other rearrangements (bottom). From left to right, each segment shows an unaffected locus, the effect of the variant type on reads at the breakpoint, and the resulting adjustment strategy required to normalise the allele frequency. Red portions of the reads show soft-clips, i.e. the portion of the reads mapping to the other end of the breakpoint. c The effect of adjusting raw VAFs in duplications (left), and unadjusted VAFs for other SVs (right), at purity levels at 20–100% in 20% increments, where the expected VAF is half the purity level (dotted line).
Fig. 2
Fig. 2. In silico mixing strategy and optimal CCF calculation metrics.
a A schematic illustrating the subsampling and merging process used to create in silico mixtures of real tumour samples. The top diagram shows the three-cluster in silico mixtures, created by mixing the two metastasis samples in different proportions. The bottom diagram shows the methodology for creating the four- and five-cluster mixtures, which separates each mixture sample into even and odd chromosomes, then subsamples these samples to create additional clusters. The resultant CCFs are based on the subsampling percentage of each odd or even chromosome sample, rather than the sample proportion (as in the three-cluster mixtures). b The CCF ground truth (based on sample membership) versus optimal SV and SNV results (based on transformed variant allele frequencies from the true cluster mean) for a representative three-cluster mixture and the four- and five-cluster mixtures. c Mean per-variant CCF error of optimal SNV and SV CCFs compared with the expected, ground truth CCF. d ROC curves for classifying variants as clonal or subclonal based on optimal variant CCFs.
Fig. 3
Fig. 3. Clustering performance metrics versus existing methods.
Performance of SVclone’s SV and SNV models, compared with Battenberg (SCNAs) and PyClone (SNVs) run on the in silico mixtures. The first column shows the cluster number error (three-inferred cluster number), and the mean CCF error, where true and inferred clusters are matched based on their order (see Methods). The second column shows the mean variant CCF and multiplicity error compared with the ground truth CCF. The third column shows the subclonal classification sensitivity and specificity using sample membership of the variant (i.e. a variant is classified as clonal if present in both samples of the mixture, and subclonal otherwise).
Fig. 4
Fig. 4. SV clustering performance for dual versus single-end models.
Performance of SVclone run on three-cluster in silico mixtures using either both breakends of an SV, or a single end. The first column shows the cluster number error (three-inferred cluster number), and the mean CCF error, where true and inferred clusters are matched based on their order (see Methods). The second column shows the mean variant CCF and multiplicity error compared with the ground truth CCF. The third column shows the subclonal classification sensitivity and specificity using sample membership of the variant (i.e. a variant is classified as clonal if present in both samples of the mixture, and subclonal otherwise).
Fig. 5
Fig. 5. SV clustering performance incorporating background subclonal copy-number states.
Performance of SVclone run across the three-cluster in silico mixtures using either clonal background copy-number states, or clonal plus subclonal states. The first column shows the cluster number error (three-inferred cluster number), and the mean CCF error, where true and inferred clusters are matched based on their order (see Methods). The second column shows the mean variant CCF and multiplicity error compared with the ground truth CCF. The third column shows the subclonal classification sensitivity and specificity using sample membership of the variant (i.e. a variant is classified as clonal if present in both samples of the mixture, and subclonal otherwise).
Fig. 6
Fig. 6. Application of SVclone to PCAWG cohort.
a A 2D density plot of the fraction of subclonal SVs versus SNVs for PCAWG samples (n = 1169) (a variant under 0.7 CCF was considered subclonal). b Survival curves representing patients divided into those with a SCNR pattern, those with high subclonal SV fraction, or neither. c A circos plots for an example SCNR pattern tumour (Liver Hepatocellular carcinoma, tumour WGS aliquot 2bff30d5-be79-4686-8164-7a7d9619d3c0). The outside track represents the copy number across the genome and the inner lines indicate SVs. Blue lines represent clonal SVs and red lines represent subclonal SVs. d A CCF histogram of sample 2bff30d5-be79-4686-8164-7a7d9619d3c0’s SNVs. e A CCF histogram of 2bff30d5-be79-4686-8164-7a7d9619d3c0’s subclonal SV’s colour coded by SV category. f A CCF histogram of 2bff30d5-be79-4686-8164-7a7d9619d3c0’s clonal SVs.

References

    1. Nowell PC. The clonal evolution of tumor cell populations. Science. 1976;194:23–28. doi: 10.1126/science.959840. - DOI - PubMed
    1. Ding L, et al. Clonal evolution in relapsed acute myeloid leukaemia revealed by whole-genome sequencing. Nature. 2012;481:506–510. doi: 10.1038/nature10738. - DOI - PMC - PubMed
    1. Gerlinger M, et al. Genomic architecture and evolution of clear cell renal cell carcinomas defined by multiregion sequencing. Nat. Genet. 2014;46:225–233. doi: 10.1038/ng.2891. - DOI - PMC - PubMed
    1. McGranahan N, Swanton C. Biological and therapeutic impact of intratumor heterogeneity in cancer evolution. Cancer Cell. 2015;27:15–26. doi: 10.1016/j.ccell.2014.12.001. - DOI - PubMed
    1. Aparicio S, Caldas C. The implications of clonal genome evolution for cancer medicine. N. Engl. J. Med. 2013;368:842–851. doi: 10.1056/NEJMra1204892. - DOI - PubMed

Publication types

MeSH terms