. 2020 Feb 5;11(1):735.
doi: 10.1038/s41467-019-13983-9.

Integrative pathway enrichment analysis of multivariate omics data

Collaborators, Affiliations

Integrative pathway enrichment analysis of multivariate omics data

Marta Paczkowska et al. Nat Commun. .

Erratum in

Abstract

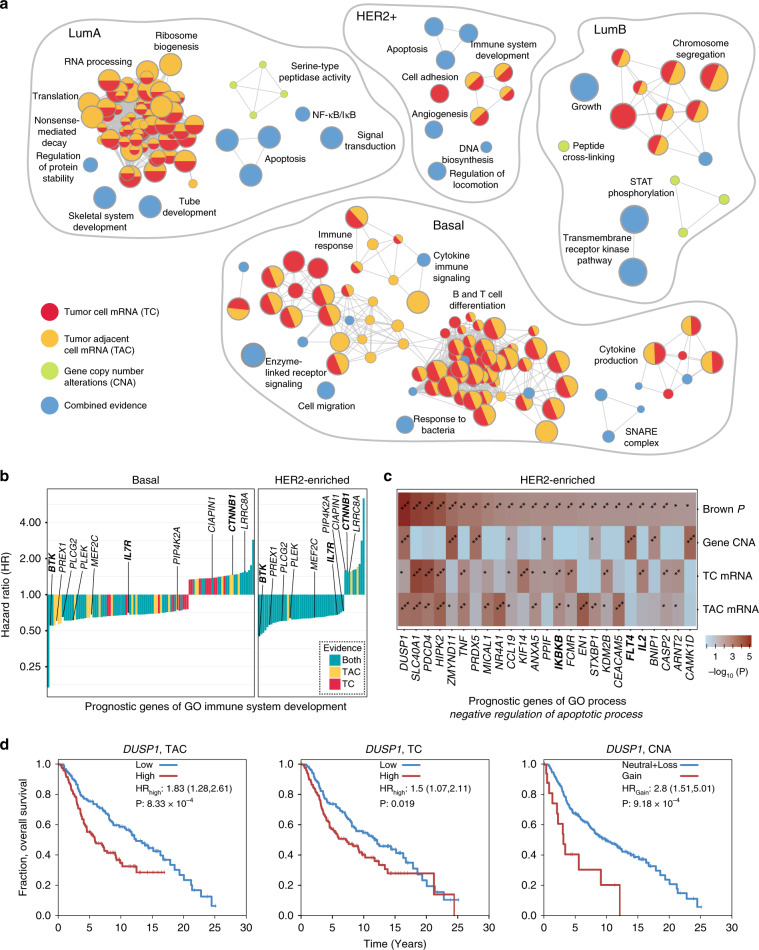
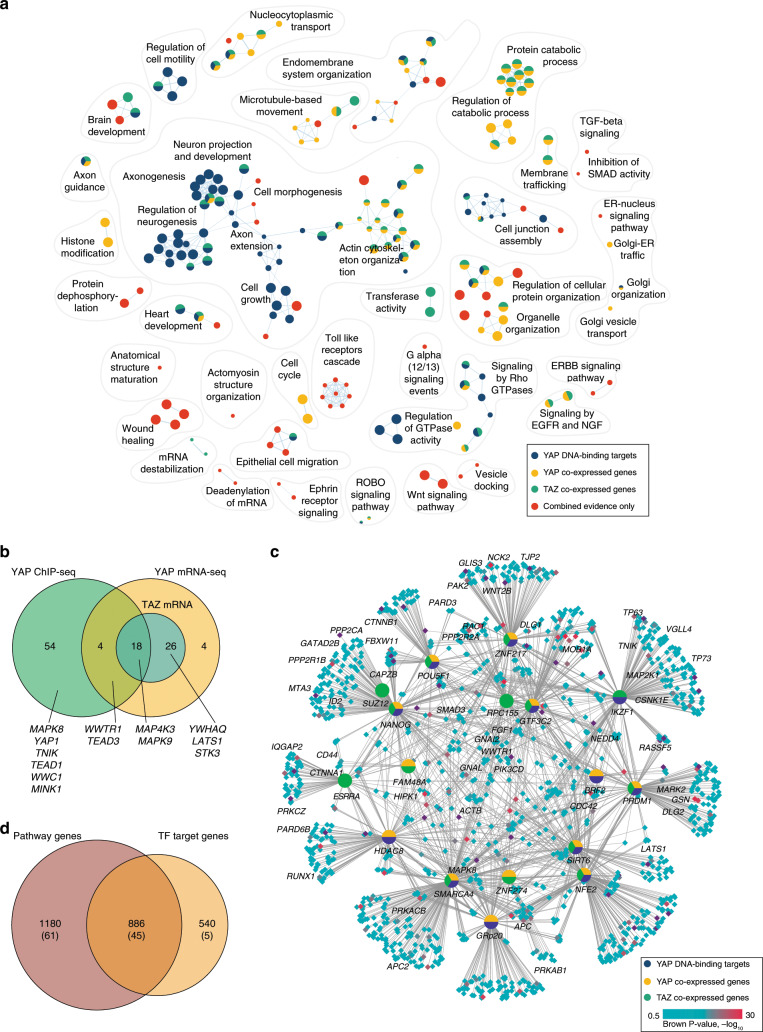
Multi-omics datasets represent distinct aspects of the central dogma of molecular biology. Such high-dimensional molecular profiles pose challenges to data interpretation and hypothesis generation. ActivePathways is an integrative method that discovers significantly enriched pathways across multiple datasets using statistical data fusion, rationalizes contributing evidence and highlights associated genes. As part of the ICGC/TCGA Pan-Cancer Analysis of Whole Genomes (PCAWG) Consortium, which aggregated whole genome sequencing data from 2658 cancers across 38 tumor types, we integrated genes with coding and non-coding mutations and revealed frequently mutated pathways and additional cancer genes with infrequent mutations. We also analyzed prognostic molecular pathways by integrating genomic and transcriptomic features of 1780 breast cancers and highlighted associations with immune response and anti-apoptotic signaling. Integration of ChIP-seq and RNA-seq data for master regulators of the Hippo pathway across normal human tissues identified processes of tissue regeneration and stem cell regulation. ActivePathways is a versatile method that improves systems-level understanding of cellular organization in health and disease through integration of multiple molecular datasets and pathway annotations.


Conflict of interest statement

The authors declare no competing interests.

Figures

Fig. 1
Fig. 1. Method overview.
a ActivePathways requires as input (1) a matrix of gene P-values for different omics datasets, and (2) a collection of gene sets corresponding to biological pathways and processes. b In step (1), gene P-values are merged using the Brown procedure and filtered to produce an integrated gene list that combines evidence from datasets and is ranked by decreasing significance with a lenient threshold. In step (2), pathway enrichment analysis is conducted on the integrated gene list using the ranked hypergeometric test that determines the optimal level of enrichment in the ranked gene sub-list for every pathway. In step (3), separate gene lists are compiled from individual input datasets and analyzed for pathway enrichment using the ranked hypergeometric test, to find supporting evidence for each pathway from the integrative analysis. c ActivePathways provides a list of enriched pathways in the integrated gene list, the associated genes with significant Brown P-values, and annotations of evidence supporting each pathway. Results of ActivePathways are visualized as enrichment maps where nodes correspond to pathways and pathways with many shared genes are connected into networks representing broader biological themes.
Fig. 2
Fig. 2. Pathway enrichment analysis of cancer driver genes with ActivePathways.
a Bar plot shows number of significantly enriched pathways (Q < 0.05) among predicted driver genes with coding and non-coding mutations in the PCAWG dataset. The majority of pathways detected by ActivePathways are supported by protein-coding mutations, as expected (dark green bars), while non-coding mutations (orange, red) reveal additional pathways. Pathways shown in dark red are found only in the integrated gene list of coding and non-coding mutations but not in gene lists of individual mutation scores. b Enrichment map shows pathways enriched in frequently mutated genes in the adenocarcinoma cohort of 1773 tumors. Nodes in the network represent pathways and similar pathways with many common genes are connected. Groups of similar pathways are indicated. Nodes are colored by supporting evidence from coding and non-coding cancer mutations. Arrow indicates kidney developmental processes. c The group of enriched kidney developmental processes is apparent from integrated evidence of coding and non-coding mutations but is not found among coding or non-coding candidate genes separately. d Heatmap shows P-values of driver genes involved in kidney developmental processes, including driver genes found in the driver analysis (indicated with #) and additional genes only found in the pathway analysis. Top row shows merged P-values from the Brown procedure. Genes listed in the Cancer Gene Census (CGC) database are indicated in boldface letters. e Pathway analysis recovers most genes of the driver list from PCAWG (orange asterisks), as well as additional infrequently mutated genes apparent due to their pathway associations. Additional known cancer genes detected in the pathway analysis are listed (green dots) and occur more frequently than expected from chance alone.
Fig. 3
Fig. 3. Prognosis-associated pathways in four molecular subtypes of breast cancer.
a Enrichment maps of prognostic pathways and processes were found in an integrative analysis of mRNA abundance in tumor cells (TC), tumor-adjacent cells (TAC), and gene copy number alterations (CNA) of the METABRIC dataset. Multicolored nodes indicate pathways that were prognostic according to several types of molecular evidence. Blue nodes indicate pathways that were only apparent through merging of molecular signals. b Hazard ratios (HR) of prognostic genes related to immune system development in basal and HER2-enriched subtypes of breast cancer. Strongest HR value of TC, TAC is shown. Genes commonly found in basal and HER2-enriched tumors are shown. Known cancer genes are shown in boldface. c Heatmap shows genes, corresponding log-rank P-values, and merged Brown P-values related to the GO process ‘negative regulation of apoptotic process’ that was found by integrating prognostic omics data in HER2-enriched breast cancer. d Kaplan–Meier plots show the strongest prognostic signal related to apoptotic signaling, the phosphatase DUSP1 that significantly associates with reduced patient survival through increased tumor-adjacent mRNA level (left), increased tumor mRNA level (center) and gene copy number amplification (right). Log-rank P-values are shown.
Fig. 4
Fig. 4. Integrative pathway enrichment analysis of Hippo target genes across human tissues.
a Enrichment map of GO processes and Reactome pathways enriched in the target genes of transcriptional regulators YAP and TAZ of the Hippo pathway. Co-expressed target genes of YAP and TAZ across normal human tissues of the GTEx dataset (pathways are shown in green and yellow, respectively) and DNA-binding target genes of YAP from ChIP-seq experiments (shown in blue) were analyzed. Pathways only found through the integration of ChIP-seq and RNA-seq data are shown in red. b Euler diagram shows 106 Hippo-related genes that were significantly enriched in the detected pathways and supported by a combination of signals in RNA-seq and ChIP-seq datasets. Core Hippo genes detected in the analysis are listed. c Regulatory network of 17 TFs and 1,426 target genes detected in the ActivePathways analysis of gene sets representing transcription factor target genes. Transcription factors with enriched target genes in the YAP/TAZ regulome are shown in multi-colored circles. Target genes are colored by increasing statistical significance (turquoise to red). d Integrative analysis of pathways and GO processes is complementary to the analysis of transcription factor targets. Euler diagram shows total number of pathway-associated identified in the analysis of GO and Reactome terms (left) and TF target genes from ENCODE (right). Numbers of Hippo-related genes are shown in brackets.
Fig. 5
Fig. 5. Benchmarking of ActivePathways.
a Comparison of ActivePathways with six additional pathway and network analysis methods used in the PCAWG pathway and network consensus analysis. ActivePathways best recovers the consensus lists of pathway-implicated driver genes with coding and non-coding mutations (indicated by asterisk). The consensus lists are shown in the leftmost bars of the plot and have been compiled through a majority vote of the seven methods in the PCAWG pathway and network analysis working group. b Comparison of ActivePathways (leftmost bars) and common pathway enrichment analysis using multiple significance cut-offs of PCAWG gene lists with protein-coding and non-coding mutations. ActivePathways shows increased sensitivity of pathway analysis even at the most lenient gene list significance cut-offs and recovers additional pathways only detected through integration of multiple datasets (dark red).

References

    1. Reimand J, et al. Pathway enrichment analysis and visualization of omics data using g:Profiler, GSEA, cytoscape and enrichmentmap. Nat. Protoc. 2019;14:482–517. doi: 10.1038/s41596-018-0103-9. - DOI - PMC - PubMed
    1. Weinstein JN, et al. The Cancer Genome Atlas Pan-Cancer analysis project. Nat. Genet. 2013;45:1113–1120. doi: 10.1038/ng.2764. - DOI - PMC - PubMed
    1. Hudson TJ, et al. International network of cancer genome projects. Nature. 2010;464:993–998. doi: 10.1038/nature08987. - DOI - PMC - PubMed
    1. The ICGC/TCGA Pan-Cancer Analysis of Whole Genomes Consortium. Pan-cancer analysis of whole genomes. Nature10.1038/s41586-020-1969-6 (2020).
    1. GTEx Consortium. The Genotype-Tissue Expression (GTEx) project. Nat. Genet. 2013;45:580–585. doi: 10.1038/ng.2653. - DOI - PMC - PubMed

Publication types

MeSH terms

Substances