
Pathway and network analysis of more than 2500 whole cancer genomes

Matthew A Reyna et al. Nat Commun. .

Erratum in

  • Author Correction: Pathway and network analysis of more than 2500 whole cancer genomes.
    Reyna MA, Haan D, Paczkowska M, Verbeke LPC, Vazquez M, Kahraman A, Pulido-Tamayo S, Barenboim J, Wadi L, Dhingra P, Shrestha R, Getz G, Lawrence MS, Pedersen JS, Rubin MA, Wheeler DA, Brunak S, Izarzugaza JMG, Khurana E, Marchal K, von Mering C, Sahinalp SC, Valencia A; PCAWG Drivers and Functional Interpretation Working Group; Reimand J, Stuart JM, Raphael BJ; PCAWG Consortium. Reyna MA, et al. Nat Commun. 2022 Dec 8;13(1):7566. doi: 10.1038/s41467-022-32334-9. Nat Commun. 2022. PMID: 36481610 Free PMC article. No abstract available.

Abstract

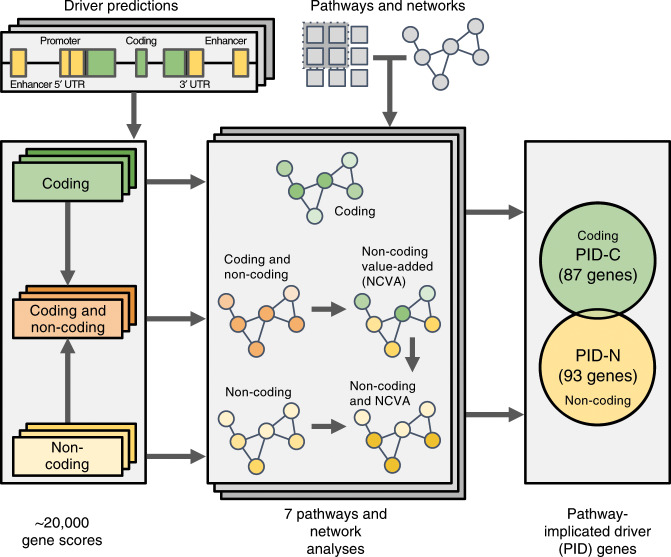
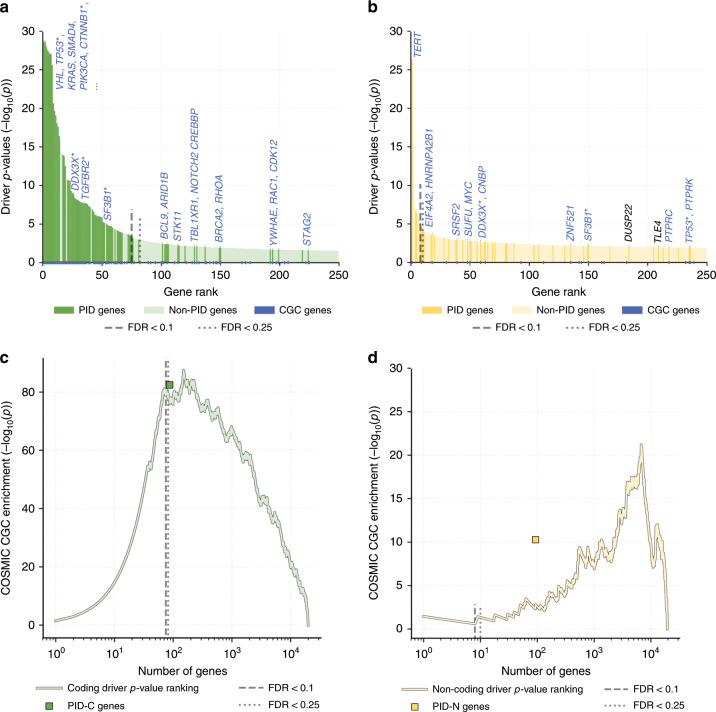
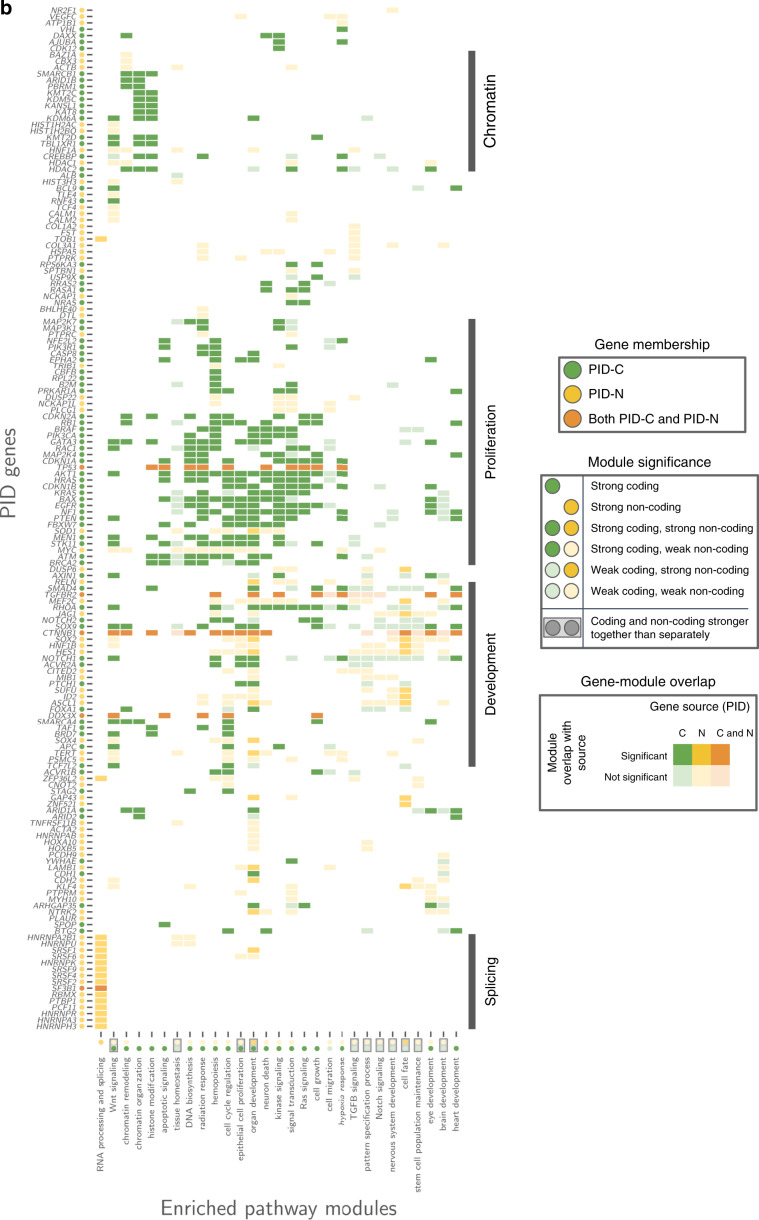
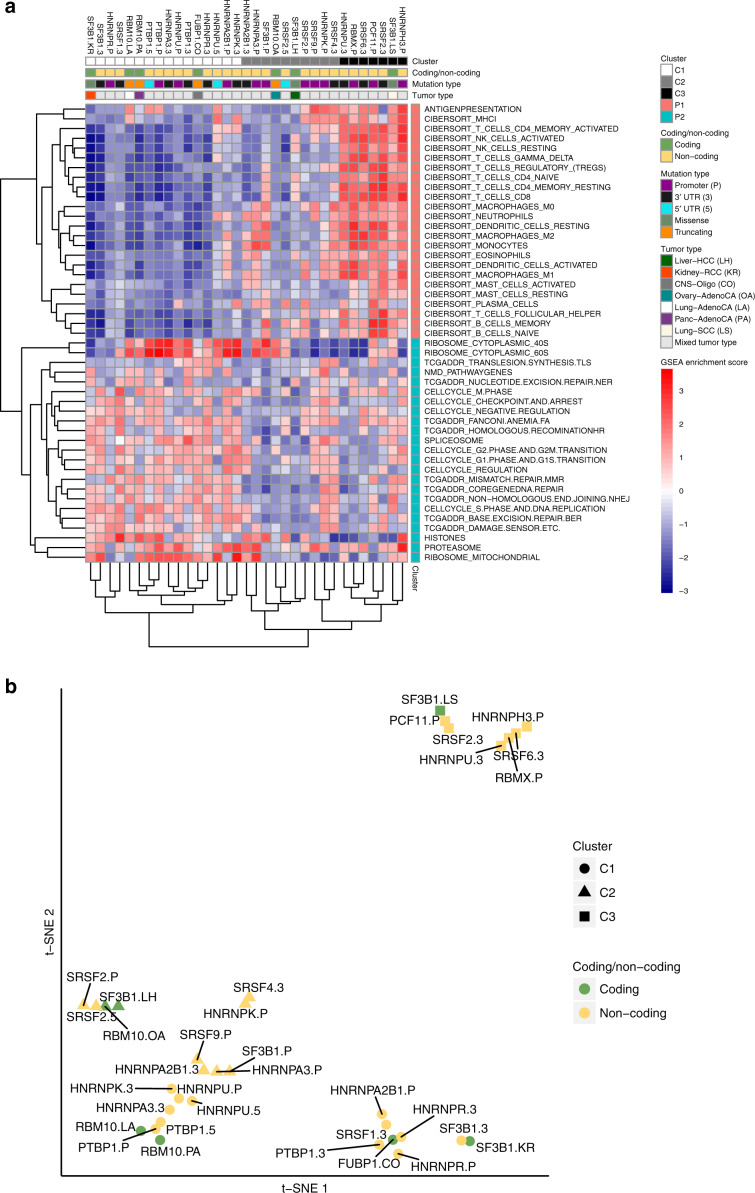
The catalog of cancer driver mutations in protein-coding genes has greatly expanded in the past decade. However, non-coding cancer driver mutations are less well-characterized and only a handful of recurrent non-coding mutations, most notably TERT promoter mutations, have been reported. Here, as part of the ICGC/TCGA Pan-Cancer Analysis of Whole Genomes (PCAWG) Consortium, which aggregated whole genome sequencing data from 2658 cancer across 38 tumor types, we perform multi-faceted pathway and network analyses of non-coding mutations across 2583 whole cancer genomes from 27 tumor types compiled by the ICGC/TCGA PCAWG project that was motivated by the success of pathway and network analyses in prioritizing rare mutations in protein-coding genes. While few non-coding genomic elements are recurrently mutated in this cohort, we identify 93 genes harboring non-coding mutations that cluster into several modules of interacting proteins. Among these are promoter mutations associated with reduced mRNA expression in TP53, TLE4, and TCF4. We find that biological processes had variable proportions of coding and non-coding mutations, with chromatin remodeling and proliferation pathways altered primarily by coding mutations, while developmental pathways, including Wnt and Notch, altered by both coding and non-coding mutations. RNA splicing is primarily altered by non-coding mutations in this cohort, and samples containing non-coding mutations in well-known RNA splicing factors exhibit similar gene expression signatures as samples with coding mutations in these genes. These analyses contribute a new repertoire of possible cancer genes and mechanisms that are altered by non-coding mutations and offer insights into additional cancer vulnerabilities that can be investigated for potential therapeutic treatments.


Conflict of interest statement

P.B. receives grant funding from Novartis from an unrelated project. R.B. owns equity in Ampressa Therapeutics. G.G. receives research funds from IBM and Pharmacyclics and is an inventor on patent applications related to MuTect, ABSOLUTE, MutSig, MSMuTect, and POLYSOLVER. B.J.R. is a consultant at and has an ownership interest (including stock, patents, etc.) in Medley Genomics. Remaining authors have no competing interests.

Figures

Fig. 1
Fig. 1. Overview of the pathway and network analysis approach.
Coding, non-coding, and combined gene scores were derived for each gene by aggregating driver p-values from the PCAWG driver predictions in individual elements, including annotated coding and non-coding elements (promoter, 5′ UTR, 3′ UTR, and enhancer). These gene scores were input to five network analysis algorithms (CanIsoNet, Hierarchical HotNet, an induced subnetwork analysis (Reyna and Raphael, in preparation), NBDI, and SSA-ME), which utilize multiple protein–protein interaction networks, and to two pathway analysis algorithms (ActivePathways and a hypergeometric analysis (Vazquez)), which utilize multiple pathway/gene-set databases. We defined a non-coding value-added (NCVA) procedure to determine genes whose non-coding scores contribute significantly to the results of the combined coding and non-coding analysis, where NCVA results for a method augment its results on non-coding data. We defined a consensus procedure to combine significant pathways and networks identified by these seven algorithms. The 87 pathway-implicated driver genes with coding variants (PID-C) are the set of genes reported by a majority (≥4/7) of methods on the coding data. The 93 pathway-implicated driver genes with non-coding variants (PID-N) are the set of genes reported by a majority of methods on non-coding data or in their NCVA results. Only five genes (CTNNB1, DDX3X, SF3B1, TGFBR2, and TP53) are both PID-C and PID-N genes.
Fig. 2
Fig. 2. Pathway and driver analysis identifies driver genes in the long tail of the driver p-values for coding and non-coding mutations.
a Pathway and network methods identify significant coding driver mutations. Driver p-values on protein-coding elements for 250 genes with most significant coding driver p-values; dashed and dotted lines indicate FDR = 0.1 and 0.25, respectively. Dark green bars are PID-C genes, and light green bars are non-PID-C genes. Blue squares below the x-axis indicate COSMIC Cancer Gene (CGC) Census genes. In total, 31 of 87 PID-C genes have coding driver p-values with FDR > 0.1. Several PID-C genes are labeled, including all CGC genes with coding FDR > 0.1. Overlap between PID-C and PID-N genes is indicated with asterisks. Source data are provided as a Source Data file. b Pathway and network methods identify rare non-coding driver mutations. Driver p-values on non-coding elements (promoter, 5′ UTR, and 3′ UTR of gene) for 250 genes with most significant non-coding driver p-values; dashed and dotted lines indicate FDR = 0.1 and 0.25, respectively. Dark yellow bars are PID-N genes, and light yellow bars are non-PID-N genes. Blue squares are as above. In total, 3 (TERT, HES1, and TOB1) of 93 PID-N genes have non-coding driver p-values with FDR ≤ 0.1, while 90 have FDR > 0.1 . Several PID-N genes are labeled, including PID-N genes with significant in cis gene expression changes (see Fig. 3) and all PID-N genes with non-coding FDR > 0.25. Overlap between PID-C and PID-N genes is indicated with asterisks. Source data are provided as a Source Data file. c Statistical significance of overlap between top-ranked genes according to coding driver p-values and PID-C genes with CGC genes. Fisher’s exact test p-values and driver FDR thresholds of 0.1 and 0.25 are highlighted. Green squares indicate overlap between PID-C genes and CGC genes. Source data are provided as a Source Data file. d Statistical significance of overlap of genes ranked by driver p-values on non-coding (promoter, 5′ UTR, 3′ UTR) elements and CGC genes. Driver FDR thresholds of 0.1 and 0.25 are highlighted. Yellow square indicates overlap between PID-N genes and CGC genes. Source data are provided as a Source Data file.
Fig. 3
Fig. 3. Gene expression changes are correlated with mutations in PID-N genes.
Evolutionary conservation of genomic elements estimated with PhyloP are shown as gray features. H3 histone lysine 4 tri-methylation sites (H3K4me3) measured in GM12878 HapMap B-lymphocytes cell lines are highlighted in the green track, indicating active promoter regions near transcription start sites. Boxplot center lines show the median, boxplot bounds show the first quartile Q1 and the third quartile Q3, and whiskers show 1.5 (Q3–Q1) below and above Q1 and Q3, respectively. a TP53 promoter. TP53 coding and non-coding genomic loci with zoomed-in view of the TP53 promoter region. TP53 promoter mutations (six mutations in Biliary-AdenoCA, ColoRect-AdenoCA, Kidney-ChRCC, Lung-SCC, Ovary-AdenoCA, and Panc-AdenoCA cancer types) correlate significantly (Wilcoxon rank-sum test p = 0.001, FDR = 0.087) with reduced TP53 gene expression, where FPKM-UQ is upper quartile normalized fragments per kilobase million. Samples with copy-number gains and losses in the TP53 promoter region are annotated in red and blue, respectively. Two of the six TP53 promoter mutations overlap with transcription factor-binding sites (with one mutation matching three motifs). Source data are provided as a Source Data file. b TLE4 promoter. TLE4 coding and non-coding genomic loci with zoomed-in view of TLE4 promoter region. TLE4 promoter mutations in Liver-HCC samples (three mutations) correlate (Wilcoxon rank-sum test p = 0.02, FDR = 0.2) with lower TLE4 gene expression. Samples with copy-number gains and losses annotated in red and blue, respectively. One of the three TLE4 promoter mutations has a transcription factor-binding site for ZNF263. Source data are provided as a Source Data file. c TCF4 promoter. TCF4 coding and non-coding genomic loci with zoomed-in view of TCF4 promoter region. TCF4 promoter mutations in Lung-SCC samples (three mutations) correlate (Wilcoxon rank-sum test p = 0.03, FDR = 0.27) with lower TCF4 gene expression. Samples with copy-number gains and losses annotated in red and blue, respectively. One of the three TCF4 promoter mutations has a transcription factor-binding site for ZEB1. Source data are provided as a Source Data file.
Fig. 4
Fig. 4. Pathway and network modules containing PID-C and PID-N genes.
a Network of functional interactions between PID-C and PID-N genes. Nodes represent PID-C and PID-N genes and edges show functional interactions from the ReactomeFI network (gray), physical protein–protein interactions from the BioGRID network (blue), or interactions recorded in both networks (purple). Node color indicates PID-C genes (green), PID-N genes (yellow), or both PID-C and PID-N genes (orange); node size is proportional to the score of the gene; and the pie chart diagram in each node represents the relative proportions of coding and non-coding mutations associated with the corresponding gene. Dotted outlines indicate clusters of genes with roles in chromatin organization and cell proliferation, which predominantly contain PID-C genes; development, which includes comparable amounts of PID-C and PID-N genes; and RNA splicing, which contains PID-N genes. A core cluster of genes with many known drivers is also indicated. b Pathway modules containing PID-C and PID-N genes. Each row in the matrix corresponds to a PID-C or PID-N gene, and each column in the matrix corresponds to a pathway module enriched in PID-C and/or PID-N genes (see the Methods section). A filled entry indicates a gene (row) that belongs to one or more pathways (column) colored according to gene membership in PID-C genes (green), PID-N genes (yellow), or both PID-C and PID-N genes (orange). A dark colored entry indicates that a PID-C or PID-N gene belongs to a pathway that is significantly enriched for PID-C or PID-N genes, respectively. A lightly colored entry indicates that a PID-C or PID-N gene belongs to a pathway that is significantly enriched for the union of PID-C and PID-N genes, but not for PID-C or PID-N genes separately. Enrichments are summarized by circles adjacent each pathway module name and PID gene name. Boxed circles indicate that a pathway module contains a pathway that is significantly more enriched for the union of the PID-C and PID-N genes than the PID-C and PID-N results separately. The enriched modules and PID genes are clustered into four biological processes: chromatin, development, proliferation, and RNA splicing as indicated.
Fig. 5
Fig. 5. RNA splicing factors are targeted primarily by non-coding mutations and alter expression of similar pathways as coding mutations in splicing factors.
a Heatmap of Gene Set Enrichment Analysis (GSEA) Normalized Enrichment Scores (NES). The columns of the matrix indicate non-coding mutations in splicing-related PID-N genes and coding mutations in splicing genes reported in ref. , and the rows of the matrix indicate 47 curated gene sets. Red heatmap entries represent an upregulation of the pathway in the mutated samples with respect to the non-mutated samples, and blue heatmap entries represent a downregulation. The first column annotation indicates mutation cluster membership according to common pathway regulation. The second column annotation indicates whether a mutation is a non-coding mutation in a PID-N gene or a coding mutation, with the third column annotation specifies the aberration type (promoter, 5′ UTR, 3′ UTR, missense, or truncating). The fourth column annotation indicates the cancer type for coding mutations. The mutations cluster into three groups: C1, C2, and C3. The pathways cluster into two groups: P1 and P2, where P1 contains an immune signature gene sets and P2 contains cell-autonomous gene sets. b t-SNE plot of mutated elements. Gene expression signatures for samples with non-coding mutations clusters in splicing-related PID-N genes with gene expression signatures for coding mutations in previously published splicing factors. The shape of each point denotes the mutation cluster assignment (C1, C2, or C3), and the color represents whether the corresponding gene is a PID-N gene with non-coding mutations or a splicing factor gene with coding mutations.

References

    1. Gonzalez-Perez A, et al. Computational approaches to identify functional genetic variants in cancer genomes. Nat. Methods. 2013;10:723–729. doi: 10.1038/nmeth.2562. - DOI - PMC - PubMed
    1. Garraway LA, Lander ES. Lessons from the cancer genome. Cell. 2013;153:17–37. doi: 10.1016/j.cell.2013.03.002. - DOI - PubMed
    1. Vogelstein B, et al. Cancer genome landscapes. Science. 2013;339:1546–1558. doi: 10.1126/science.1235122. - DOI - PMC - PubMed
    1. Lawrence MS, et al. Discovery and saturation analysis of cancer genes across 21 tumour types. Nature. 2014;505:495–501. doi: 10.1038/nature12912. - DOI - PMC - PubMed
    1. Horn S, et al. TERT promoter mutations in familial and sporadic melanoma. Science. 2013;339:959–961. doi: 10.1126/science.1230062. - DOI - PubMed

Publication types