. 2020 Feb 5;10(1):1861.
doi: 10.1038/s41598-020-58821-x.

RefDNN: a reference drug based neural network for more accurate prediction of anticancer drug resistance

Affiliations

RefDNN: a reference drug based neural network for more accurate prediction of anticancer drug resistance

Jonghwan Choi et al. Sci Rep. .

Abstract

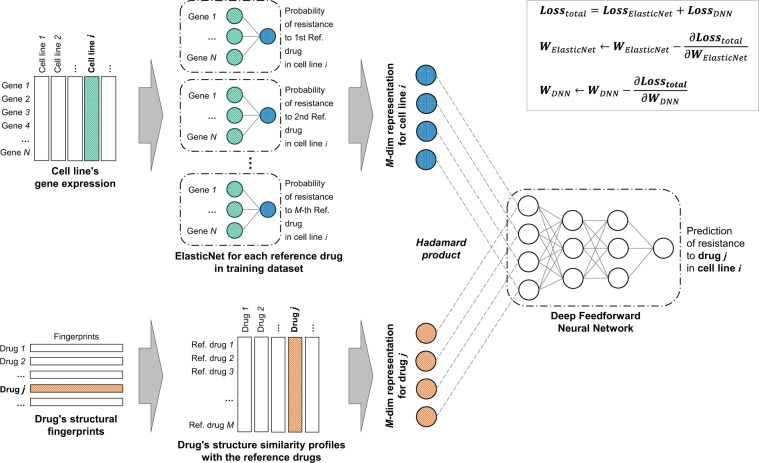
Cancer is one of the most difficult diseases to treat owing to the drug resistance of tumour cells. Recent studies have revealed that drug responses are closely associated with genomic alterations in cancer cells. Numerous state-of-the-art machine learning models have been developed for prediction of drug responses using various genomic data and diverse drug molecular information, but those methods are ineffective to predict drug response to untrained drugs and gene expression patterns, which is known as the cold-start problem. In this study, we present a novel deep neural network model, termed RefDNN, for improved prediction of drug resistance and identification of biomarkers related to drug response. RefDNN exploits a collection of drugs, called reference drugs, to learn representations for a high-dimensional gene expression vector and a molecular structure vector of a drug and predicts drug response labels using the reference drug-based representations. These calculations come from the observation that similar chemicals have similar effects. The proposed model not only outperformed existing computational prediction models in most comparative experiments, but also showed more robust prediction for untrained drugs and cancer types than traditional machine learning models. RefDNN exploits the ElasticNet regularization to deal with high-dimensional gene expression data, which allows identification of gene markers associated with drug resistance. Lastly, we described an application of RefDNN in exploring a new candidate drug for liver cancer. As the proposed model can guarantee good prediction of drug responses to untrained drugs for given gene expression patterns, it may be of potential benefit in drug repositioning and personalized medicine.


Conflict of interest statement

The authors declare no competing interests.

Figures

Figure 1
Figure 1
Evaluation of drug-resistance prediction performance of RefDNN on GDSC and CCLE datasets. (a) Results on GDSC dataset and (b) Results on CCLE dataset. The predictive power is computed by 5 metrics, accuracy, AUCROC, precision, recall, and F1score. A value on each bar is the average of accuracy values in the nested 5-fold cross-validation. An error bar represents the standard deviation in the cross validation. The significance of predictive performance differences between RefDNN and others was calculated using the Welch’s t-test and Benjamini-Hochberg procedure. Single and double asterisk symbols mean p < 0.05 and p < 0.01, respectively.
Figure 2
Figure 2
Comparison of the prediction performance of RefDNN with the state-of-the-art prediction models. (a) Receiver operating characteristic (ROC) curves of 5-fold cross-validation on GDSC dataset, (b) ROC curves on CCLE dataset, (c) Precision-Recall curve on GDSC dataset, and (d) Precision-Recall curve on CCLE dataset. The mean and standard deviation of accuracy of each model are shown in the plot legend. All p-values computed by Welch’s t-test were less than 0.05.
Figure 3
Figure 3
Prediction performance of RefDNN for untrained drugs and cancer types. (a) Box plots for AUCROC values of RefDNN and baseline models in LODOCV; (b) Box plots of AUCPR values in LODOCV; (c) Box plots for AUCROC values in LOCOCV; (d) Box plots of AUCPR values in LOCOCV. Differences in predictive performances between RefDNN and other machine learning models were assessed using the Wilcoxon signed-rank test and the Bonferroni correction. Single and double asterisk symbols mean p < 0.05 and p < 0.01, respectively.
Figure 4
Figure 4
Identification and validation of biomarkers related to drug resistance. (a) Procedure of identification of biomarker candidates using RefDNN; (b) Top 10 candidate genes associated with nilotinib resistance and their expression patterns in cell lines resistant (red) and sensitive (blue) to nilotinib in GDSC dataset; (c) Validation of the relationship between IC50 of nilotinib and 8 differentially expressed candidate genes (MYOF, UBC, GNAS, NQO1, RACK1, FAU, LGALS3, and RPS23) in GDSC dataset using CCLE dataset. For each gene, a set of cell lines in CCLE dataset was divided into high and low expression groups by means of gene expression levels; All p-values were computed using the Mann-Whitney U test and corrected by the Benjamini-Hochberg procedure. Single and double asterisk symbols mean p < 0.05 and p < 0.01, respectively.
Figure 5
Figure 5
Prediction of drug sensitivity to FDA-approved anticancer agents of HCC cell lines. Rows and columns are anticancer drugs and HCC cell lines, respectively. The probability of sensitivity is computed by 1-probability of resistance. A score higher than 0.5 means that the corresponding row drug may be a novel repositioned drug for treatment of the corresponding column cell line.
Figure 6
Figure 6
Overview of RefDNN. RefDNN consists of multiple ElasticNet classifiers trained by predicting the drug resistance labels of an input cell line to M reference drugs for generating a representation of gene expression data and a deep feedforward neural network classifier trained by taking two data representations of drug fingerprint data and cell line’s gene expression data and predicting the resistance of an input drug in the cell line. The drug representation is a drug structure similarity profile computed by the Tanimoto coefficient between fingerprints of an input and reference drugs. Whole weights of ElasticNet and DNN classifiers in RefDNN are updated by the gradient of total loss defined by the sum of ElasticNet loss and DNN loss.

References

    1. Azuaje F. Computational models for predicting drug responses in cancer research. Briefings Bioinf. 2016;18:820–829. - PMC - PubMed
    1. Costello JC, et al. A community effort to assess and improve drug sensitivity prediction algorithms. Nat. Biotechnol. 2014;32:1202. doi: 10.1038/nbt.2877. - DOI - PMC - PubMed
    1. Dagogo-Jack I, Shaw AT. Tumour heterogeneity and resistance to cancer therapies. Nat. Rev. Clin. Oncol. 2018;15:81. doi: 10.1038/nrclinonc.2017.166. - DOI - PubMed
    1. Yang W, et al. Genomics of Drug Sensitivity in Cancer (GDSC): a resource for therapeutic biomarker discovery in cancer cells. Nucleic Acids Res. 2012;41:D955–D961. doi: 10.1093/nar/gks1111. - DOI - PMC - PubMed
    1. Barretina J, et al. The Cancer Cell Line Encyclopedia enables predictive modelling of anticancer drug sensitivity. Nature. 2012;483:603. doi: 10.1038/nature11003. - DOI - PMC - PubMed

Publication types