. 2020 Feb 5;3(1):56.
doi: 10.1038/s42003-019-0741-7.

Cancer LncRNA Census reveals evidence for deep functional conservation of long noncoding RNAs in tumorigenesis

Collaborators, Affiliations

Cancer LncRNA Census reveals evidence for deep functional conservation of long noncoding RNAs in tumorigenesis

Joana Carlevaro-Fita et al. Commun Biol. .

Erratum in

Abstract

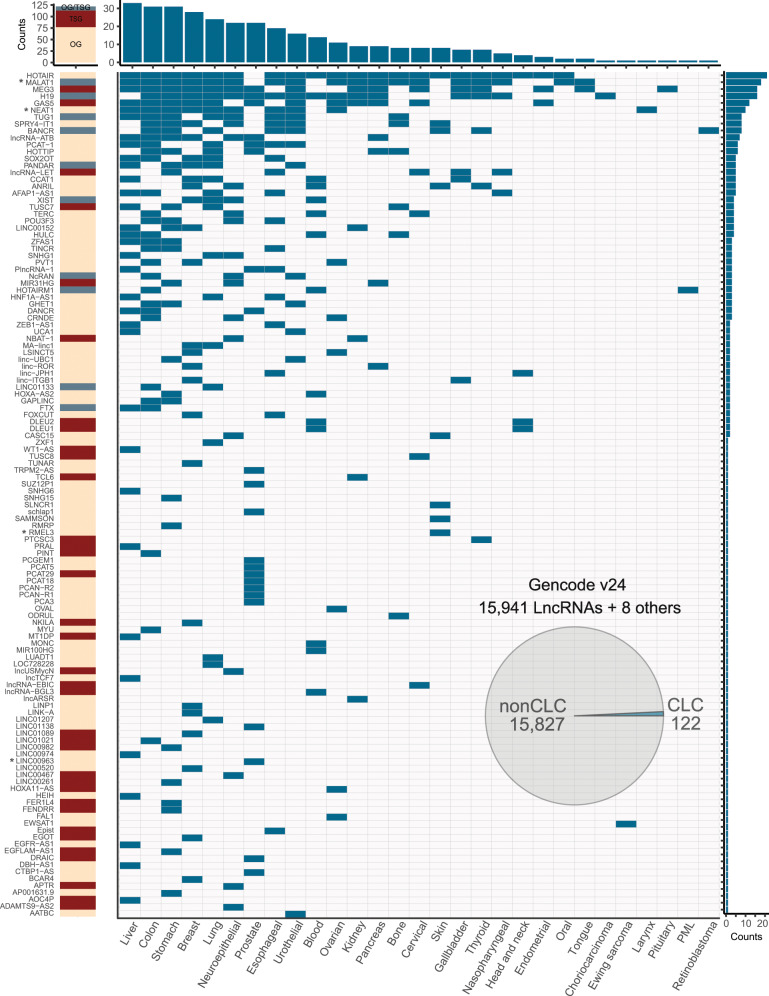
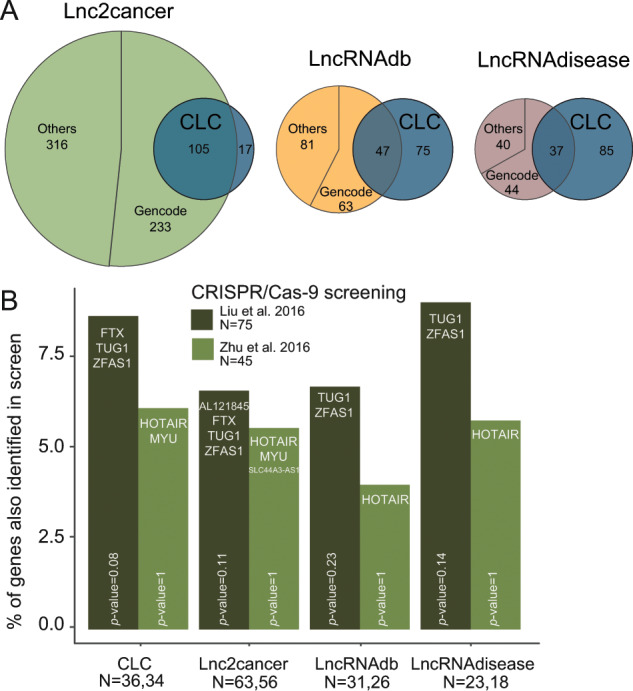
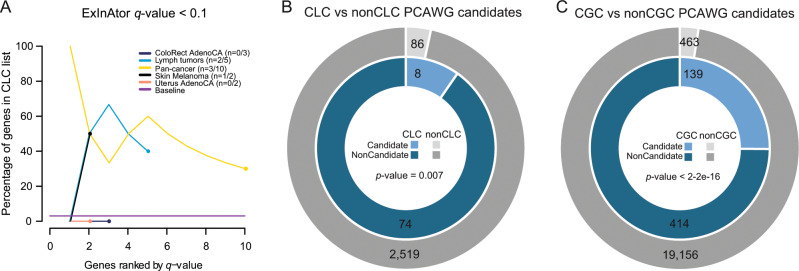
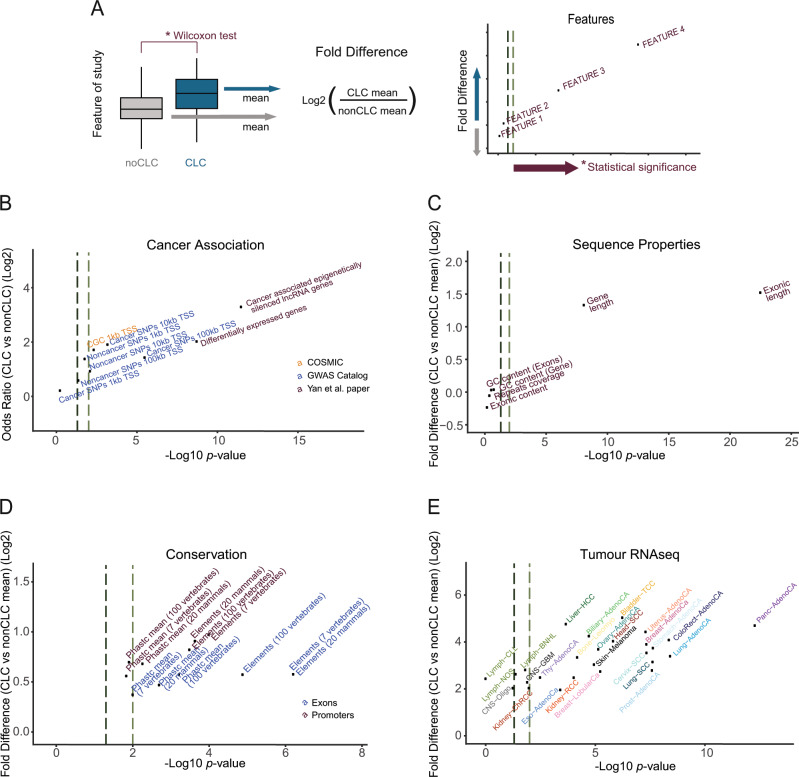
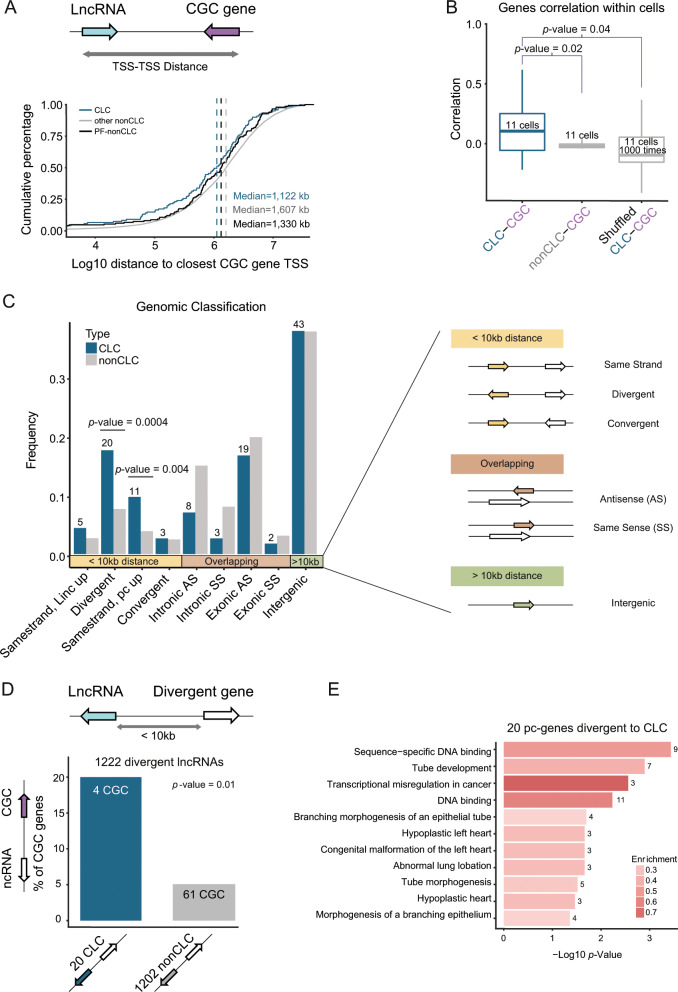
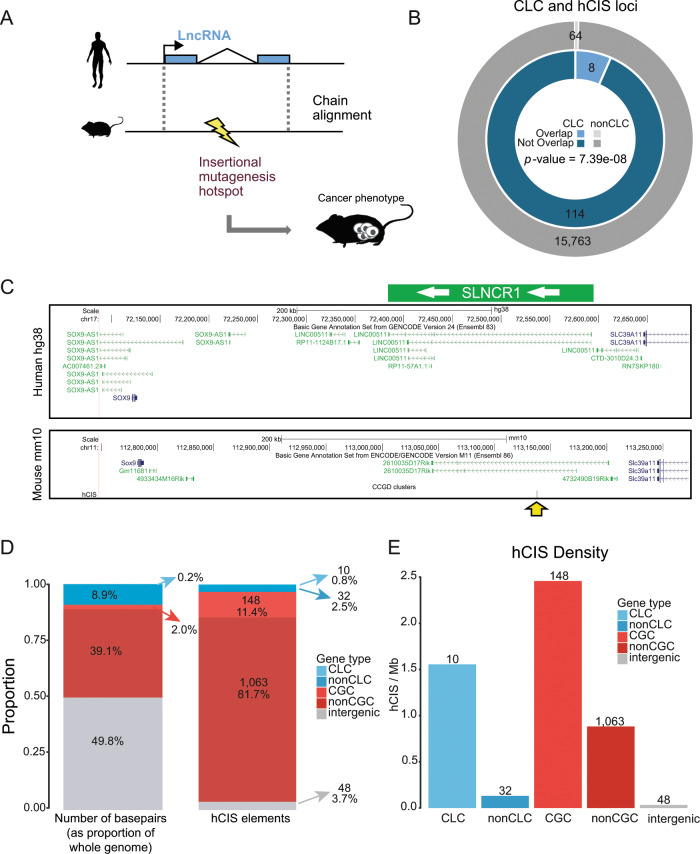
Long non-coding RNAs (lncRNAs) are a growing focus of cancer genomics studies, creating the need for a resource of lncRNAs with validated cancer roles. Furthermore, it remains debated whether mutated lncRNAs can drive tumorigenesis, and whether such functions could be conserved during evolution. Here, as part of the ICGC/TCGA Pan-Cancer Analysis of Whole Genomes (PCAWG) Consortium, we introduce the Cancer LncRNA Census (CLC), a compilation of 122 GENCODE lncRNAs with causal roles in cancer phenotypes. In contrast to existing databases, CLC requires strong functional or genetic evidence. CLC genes are enriched amongst driver genes predicted from somatic mutations, and display characteristic genomic features. Strikingly, CLC genes are enriched for driver mutations from unbiased, genome-wide transposon-mutagenesis screens in mice. We identified 10 tumour-causing mutations in orthologues of 8 lncRNAs, including LINC-PINT and NEAT1, but not MALAT1. Thus CLC represents a dataset of high-confidence cancer lncRNAs. Mutagenesis maps are a novel means for identifying deeply-conserved roles of lncRNAs in tumorigenesis.


Conflict of interest statement

The authors declare no competing interests.

Figures

Fig. 1
Fig. 1. Overview of the Cancer LncRNA Census.
Rows represent the 122 CLC genes, columns represent 29 cancer types. Asterisks next to gene names indicate that they are predicted as drivers by PCAWG, based either on gene or promoter evidence (see Supplementary Data 1). Blue cells indicate evidence for the involvement of a given lncRNA in that cancer type. Left column indicates functional classification: tumour suppressor (TSG), oncogene (OG) or both (OG/TSG). Above and to the right, barplots indicate the total counts of each column/row. The piechart shows the fraction that CLC represents within GENCODE v24 lncRNAs. Note that 8 CLC genes are classified as “pseudogenes” by GENCODE. “nonCLC” refers to all other GENCODE-annotated lncRNAs, which are used as background in comparative analyses.
Fig. 2
Fig. 2. Intersection of CLC with public databases.
a Proportional Venn diagrams displaying the overlap between CLC set and the three indicated databases. Shown are the total numbers of unique human lncRNAs contained in each intersection (note that for LncRNADisease, numbers refer only to cancer-related genes). Databases are divided into genes that belong to GENCODE v24 annotation and others. b Barplot shows the percent of GENCODE v24 lncRNAs of each database that is present in the final list of cancer lncRNA candidates of two CRISPR/Cas-9 cancer screenings (Liu et al. and Zhu et al.). N represents the number of GENCODE v24 lncRNAs from each database that were tested in each of the two CRISPR/Cas-9 screenings. Names of the genes that overlap between the databases and the screenings are shown in each bar. p-values were calculated using Fisher’s exact test.
Fig. 3
Fig. 3. CLC as benchmark for cancer driver predictions.
a CLC benchmarking of ExInAtor driver lncRNA predictions using PCAWG whole genome tumours at q-value (false discovery rate) cutoff of 0.1. Genes sorted increasingly by q-value are ranked on x-axis. Percentage of CLC genes amongst cumulative set of predicted candidates at each step of the ranking (precision), are shown on the y-axis. Black line shows the baseline, being the percentage of CLC genes in the whole list of genes tested. Coloured dots represent the number of candidates predicted under the q-value cutoff of 0.1. “n” in the legend shows the number of CLC and total candidates for each cancer type. b Rate of driver-gene predictions amongst CLC and non-CLC genesets (q-value cutoff of 0.1) by all the individual methods and the combined list of drivers developed in PCAWG. p-value is calculated using Fisher’s exact test for the difference between CLC and non-CLC genesets. c Rate of driver-gene predictions amongst CGC and nonCGC genesets (q-value cutoff of 0.1) by all the individual methods and the combined list of drivers developed in PCAWG. p-value is calculated using Fisher’s exact test for the difference between CGC and nonCGC genesets.
Fig. 4
Fig. 4. Distinguishing features of CLC genes.
a Panel showing a hypothetic feature analysis example to illustrate the content of the following figures. All panels in this figure display features (dots), plotted by their log-fold difference (odds ratio in case of panel (b)) between CLC/non-CLC genesets (y-axis) and statistical significance (x-axis). In all plots dark and light green dashed lines indicate 0.05 and 0.01 significance thresholds, respectively. b Cancer and non-cancer disease-related data from indicated sources: y-axis shows the log2 of the odds ratio obtained by comparing CLC to non-CLC by Fisher’s exact test; x-axis displays the estimated p-value from the same test. “CGC 1 kb TSS” refers to the fraction of genes that have a nearby known CGC cancer protein-coding gene. This is explored in more detail in the next Figure. “Non-cancer SNPs” refers to GWAS SNPs associated with diseases/traits other than cancer. c Sequence and gene properties: y-axis shows the log2 fold difference of CLC/non-CLC means; x-axis represents the p-value obtained. d Evolutionary conservation: “Phastc mean” indicates average base-level PhastCons score; “Elements” indicates percent coverage by PhastCons conserved elements (see Methods). Colours distinguish exons (blue) and promoters (purple). e Tumour RNA-seq: expression levels of lncRNA genes in different cancer tissues obtained from RNA-seq expression data from PCAWG. For (bd), statistical significance was calculated using Wilcoxon test.
Fig. 5
Fig. 5. Evidence for genomic clustering of non-coding and protein-coding cancer genes.
a Cumulative distribution of the genomic distance of lncRNA transcription start site (TSS) to the closest Cancer Gene Census (CGC) (protein-coding) gene TSS. LncRNAs are divided into CLC (n = 122), potentially functional non-CLC genes (PF-non-CLC) (n = 149), and other non-CLC genes (n = 15,678). b Boxplot shows the distribution of the gene expression correlation between CLC and their closest CGC genes in 11 human cell lines, including two control analyses (distance-matched non-CLC-CGC pairs, and shuffled CLC-CGC pairs). Correlation was calculated for gene pairs within each cell type, using Pearson method. p-value for Kolmogorov–Smirnov test is shown. c Genomic classification of lncRNAs. Genes are classified according to distance and orientation to the closest protein-coding gene, and these are grouped into three categories: genes closer than 10 kb to closest protein-coding gene, genes overlapping a protein-coding gene and intergenic genes (>10 kb from closest protein-coding gene). p-values for Fisher’s exact tests are shown. d The percentage of divergent CLC (left bar) and non-CLC (right bar) genes divergent to a cancer protein-coding gene (CGC). Numbers represent numbers of genes with which the percentage is calculated. p-value for Fisher’s exact test is shown. e Functional annotations of the 20 protein-coding genes (pc-genes) divergent to CLC genes from panel (c). Bars indicate the –log10 (corrected) p-value (see Methods) and are coloured based on the “enrichment”: the number of genes that contain the functional term divided by the total number of queried genes. Numbers at the end of the bars correspond to the number of genes that fall into the category.
Fig. 6
Fig. 6. Evidence for ancient conserved cancer roles of lncRNAs.
a Functional conservation of human CLC genes was inferred by the presence of Common Insertion Sites (CIS), identified in transposon-mutagenesis screens, at orthologous regions in the mouse genome. Orthology was inferred from Chain alignments and identified using LiftOver utility. b Number of CLC and non-CLC genes that contain human orthologous common insertion sites (hCIS) (see Table 1). Significance was calculated using Fisher’s exact test. c UCSC browser screenshot of a CLC gene (SLNCR1, ENSG00000227036) intersecting a CIS (yellow arrow). d Number of basepairs and number of overlapping hCIS for cancer driver protein-coding genes (CGC), non-cancer driver protein-coding genes (nonCGC), cancer-related lncRNAs (CLC), rest of GENCODE lncRNAS (non-CLC) and the rest of the genome that do not overlap any of the previous element types (intergenic). Arrows indicate the number of hCIS and the percentage for each element type. e Number of overlapping hCIS per megabase of genomic span for each gene class.

References

    1. Yates LR, Campbell PJ. Evolution of the cancer genome. Nat. Rev. Genet. 2012;13:795–806. doi: 10.1038/nrg3317. - DOI - PMC - PubMed
    1. Guttman M, et al. Chromatin signature reveals over a thousand highly conserved large non-coding RNAs in mammals. Nature. 2009;458:223–7. doi: 10.1038/nature07672. - DOI - PMC - PubMed
    1. Jia H, et al. Genome-wide computational identification and manual annotation of human long noncoding RNA genes. RNA. 2010;16:1478–87. doi: 10.1261/rna.1951310. - DOI - PMC - PubMed
    1. Cabili MN, et al. Integrative annotation of human large intergenic noncoding RNAs reveals global properties and specific subclasses. Genes Dev. 2011;25:1915–27. doi: 10.1101/gad.17446611. - DOI - PMC - PubMed
    1. Derrien, T. et al. The GENCODE v7 catalog of human long noncoding RNAs: analysis of their gene structure, evolution, and expression. Genome Res. 22, 1775–89 (2012). - PMC - PubMed

Publication types