. 2020 Mar;52(3):342-352.
doi: 10.1038/s41588-019-0557-x. Epub 2020 Feb 5.

Comprehensive molecular characterization of mitochondrial genomes in human cancers

Collaborators, Affiliations

Comprehensive molecular characterization of mitochondrial genomes in human cancers

Yuan Yuan et al. Nat Genet. 2020 Mar.

Erratum in

Abstract

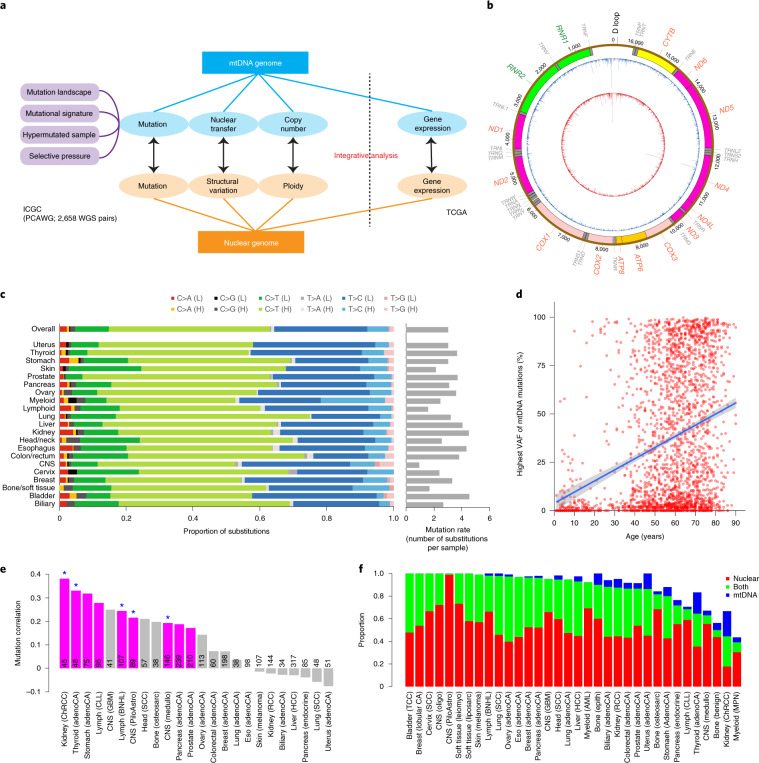
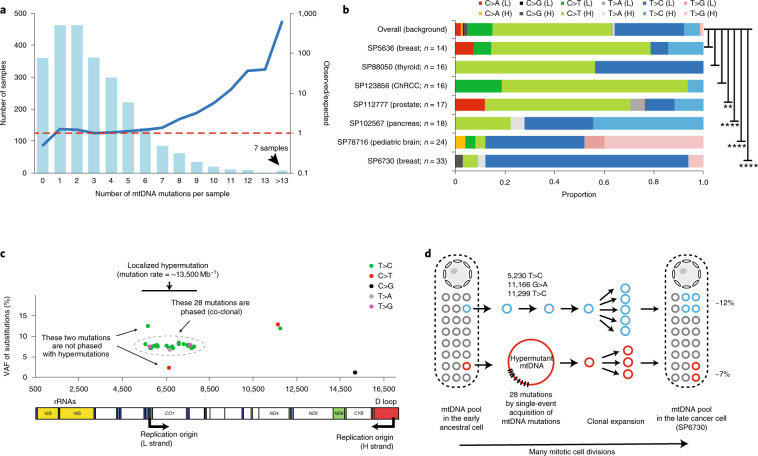
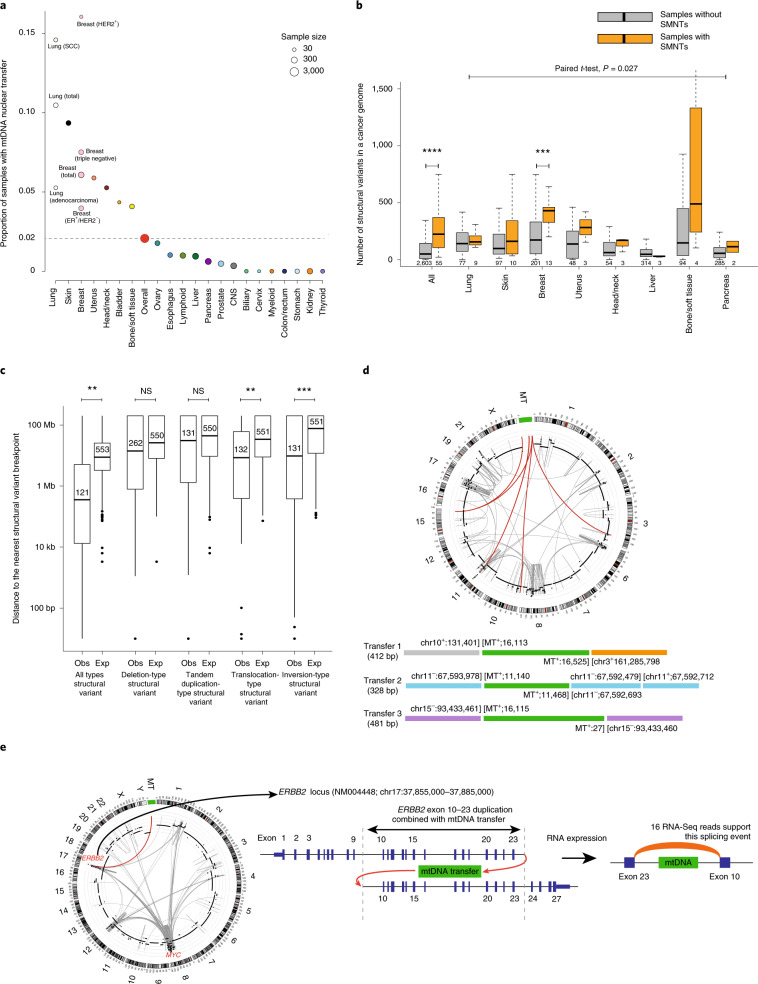
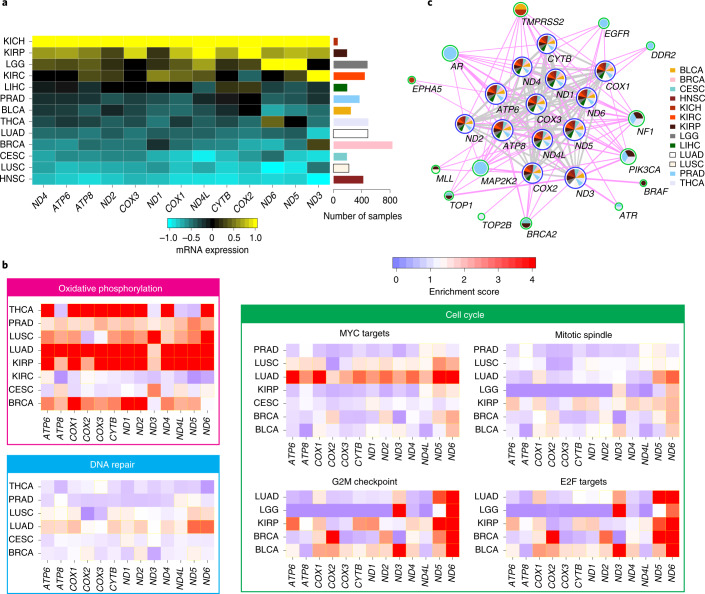
Mitochondria are essential cellular organelles that play critical roles in cancer. Here, as part of the International Cancer Genome Consortium/The Cancer Genome Atlas Pan-Cancer Analysis of Whole Genomes Consortium, which aggregated whole-genome sequencing data from 2,658 cancers across 38 tumor types, we performed a multidimensional, integrated characterization of mitochondrial genomes and related RNA sequencing data. Our analysis presents the most definitive mutational landscape of mitochondrial genomes and identifies several hypermutated cases. Truncating mutations are markedly enriched in kidney, colorectal and thyroid cancers, suggesting oncogenic effects with the activation of signaling pathways. We find frequent somatic nuclear transfers of mitochondrial DNA, some of which disrupt therapeutic target genes. Mitochondrial copy number varies greatly within and across cancers and correlates with clinical variables. Co-expression analysis highlights the function of mitochondrial genes in oxidative phosphorylation, DNA repair and the cell cycle, and shows their connections with clinically actionable genes. Our study lays a foundation for translating mitochondrial biology into clinical applications.


Conflict of interest statement

The authors declare no competing interests.

Figures

Fig. 1
Fig. 1. Mutational landscape and process of cancer mitochondrial genomes.
a, Overview of our multidimensional and integrated mitochondrial genome analyses. b, Landscape of mtDNA somatic substitutions. The numbers represent the mitochondrial genome coordinates. The outer (blue) circle shows the density of all variants with VAF > 1%. The inner (red) circle shows the density of variants with VAF > 3%. c, Highly consistent mtDNA mutational spectrum across 21 cancer tissue groups. Average numbers of somatic substitutions per sample are also shown (right). d, Correlation between the highest VAF of mtDNA mutations in a cancer tissue and patient age at the time of diagnosis. The correlation was based on the 2,414 patients with both age and somatic single-nucleotide variant information available. The shaded region represents the 95% confidence interval for the predictions from a linear model with the highest VAF as the response variable and patient age as the explanatory variable. e, Correlations between the numbers of nuclear and mtDNA somatic mutations. The associations were tested among samples with both nuclear and mtDNA somatic mutations available (with sample sizes labeled on plot) using Spearman’s rank correlation. Magenta bars indicate significant positive correlations (P < 0.05). Asterisks indicate that both nuclear and mitochondrial somatic mutations were correlated with patient age in that cancer type (P < 0.05). f, Proportions of tumor samples harboring different categories of somatic alterations: nuclear driver alterations only (red); both nuclear driver alterations and mtDNA mutations (VAF > 10%, green); and mtDNA mutations without known nuclear drivers (blue). AML, acute myeloid leukemia; BNHL, B cell non-Hodgkin lymphoma; CA, carcinoma; ChRCC, chromophobe renal cell carcinoma; CLL, chronic lymphocytic leukemia; CNS, central nervous system; eso, esophageal; GBM, glioblastoma; HCC, hepatocellular carcinoma; leiomyo, leiomyosarcoma; liposarc, liposarcoma; medullo, medulloblastoma; MPN, myeloproliferative neoplasm; oligo, oligometastatic; osteosarc, osteosarcoma; PiloAstro, pilocytic astrocytoma; RCC, renal cell carcinoma; SCC, squamous cell carcinoma; TCC, transitional cell carcinoma; adenoCA, adenocarcinoma; epith, epithelioid.
Fig. 2
Fig. 2. Characterization of hypermutated cancer mitochondrial genomes.
a, Distribution of mtDNA mutations. The blue curve represents the calculated ratio between observed and expected numbers of samples for each bin (right-hand y axis). b, Mutational spectrum of the seven hypermutated mitochondrial genomes identified. The P values were generated by chi-squared test without multiple comparison adjustment (**P < 0.01; ****P < 0.0001). c, Distribution of the 33 somatic mutations in the breast cancer sample of mtDNA hypermutation (sample ID: SP6730). d, Proposed model of the mtDNA hypermutation process in SP6730. rRNAs, ribosomal RNAs.
Fig. 3
Fig. 3. mtDNA truncating mutation patterns.
a, Distinct VAF accumulation curves of truncating mutations between kidney/colorectal/thyroid cancers and other cancer types. For comparison, similar curves were generated for silent and missense mutations, which are overall functionally neutral, in other types of cancer after normalization of mutation numbers. Generally, fewer truncating mutations were observed at higher allele-frequency levels (red), except for kidney, colorectal and thyroid cancer types (blue). n = number of samples. b, Kidney chromophobe, kidney papillary, colorectal and thyroid cancers accumulated excessive high-allele-frequency truncating mutations (sample sizes in parentheses). Areas under the curve across cancer types for a VAF interval of 0.6–1.0 (from Supplementary Fig. 11a); were calculated and are shown. Their distribution is shown by a box plot. The boundaries of the box mark the first and third quartile, with the median in the center, and whiskers extending to 1.5× the interquartile range from the boundaries. c, Distribution patterns of truncating mutations in ND5. C, carboxy; N, amino; Proton_antipo_N, NADH-ubiquinone oxidoreductase (complex I), chain 5 N-terminus; Proton_antipo_M, proton-conducting membrane transporter; NADH5_C, NADH dehydrogenase subunit 5 C terminus. d, Heat map of mtDNA truncating mutations with recurrent somatic mutations in cancer genes in kidney chromophobe and kidney papillary cancers. MT_truncating standas for mitochondrial truncating mutations, which include frameshift mutations and stop-gain mutations. Statistical significance of mutual exclusivity between mutations was assessed by Fisher’s exact test. SNV, single-nucleotide variant. e, Heat map of the signaling pathways enriched by nuclear genes upregulated in cancer samples with truncating mutations. A dot indicates FDR < 0.05. IFN-γ, interferon-γ; IL-6, interleukin-6; JAK, Janus kinase; mTORC1, mammalian target of rapamycin complex 1; NF-κB, nuclear factor κB; STAT3, signal transducers and activators of transcription 3; TNF-α, tumor necrosis factor-α; KRAS, KRAS proto-oncogene, GTPase.
Fig. 4
Fig. 4. Somatic transfer of mtDNA into the cancer nuclear genome.
a, Frequency of SMNTs in different cancer tissues. Circle size indicates the sample size of a given cancer type. ER, estrogen receptor. b, Numbers of structural variant breakpoints in samples with and without SMNTs. Sample sizes are labeled below the boxes. The P values (***P < 0.001; ****P < 0.0001) were generated by two-sided t-test without multiple comparison adjustment. c, Distances from SMNT breakpoints to the nearest structural variant breakpoints are shorter than random expectation for all and each type of structural variant. Sample sizes are labeled in the centers of the boxes. The P values (**P < 0.01; ***P < 0.001) were generated by two-sided t-test without multiple comparison adjustment. bp, base pair; exp, expected; Mb, megabase; NS, not significant; obs, observed. d, Circos plot of three independent SMNT events in a bladder cancer genome (sample ID: SP953), showing 23 human chromosomes in the outer layer, as well as copy numbers of nuclear cancer genomes (inner layer; black dots); chromosomal rearrangements (gray curves) and SMNTs (red curves). A summary of three SMNTs with genomic coordinates in numbers is depicted below the Circos plot with breakpoints. e, An SMNT event found in a HER2+ breast cancer genome (sample ID: SP10563), leading to a tandem duplication process of ERBB2 exons 10–23 and their subsequent expression. The novel exon junction is supported by the RNA reads from the corresponding RNA-seq data. In all boxplots, the boundaries of the boxes mark the first and third quartiles, with the median in the center, and whiskers extending to 1.5× the interquartile range from the boundaries.
Fig. 5
Fig. 5. Pan-cancer view of mtDNA copy number.
a, Distributions of mtDNA copy number by cancer tissue type. Sample numbers with mtDNA copy-number information available are labeled on the top, with the median mtDNA copy numbers marked as red bars. b, Distinct mtDNA copy-number distributions for cancer types derived from the kidney (top) and brain (bottom). n = number of samples with mtDNA copy number. P values were generated by ANOVA. c, mtDNA copy numbers with and without truncating mutations in mtDNA genes. n = number of samples with both mtDNA copy number and somatic mutation information available. P values were based on ANOVA, adjusting for cancer types. d, Paired copy-number comparison of tumor and matching normal tissue samples. n = number of matching normal tissue and cancer sample pairs. Raw P values were determined by two-sided Wilcoxon signed-rank test, then adjusted for FDR (**FDR < 0.01; ***FDR < 0.001). e, Correlation of mtDNA copy number with patient age in prostate cancer. n = number of samples with cancer mtDNA copy number and patient age information available. Correlations and P values are based on Spearman’s rank correlation. f, Correlation of mtDNA copy number with cancer stage in chronic lymphocytic leukemia. n = number of samples with mtDNA copy number and stage information. g, Focal copy gain and loss caused by structural variations in three cancer samples. Green lines represent focal loss, whereas red lines represent tandem duplication. In all boxplots, the boundaries of the boxes mark the first and third quartile, with the median in the center, and whiskers extending to 1.5× the interquartile range from the boundaries.
Fig. 6
Fig. 6. Co-expression patterns of mtDNA genes across different cancer types.
a, Left: heat map of the expression levels of 13 mtDNA genes of 13 cancer types. Right: bar plot showing the sample sizes for each cancer type. b, Commonly enriched pathways identified by co-expression with mtDNA genes in different cancer types. Borders of cells with FDR < 0.05 are highlighted in yellow. c, mtDNA gene-centric pan-cancer co-expression network. The pie chart colors at each node indicate occurrence of the node in cancer types of the corresponding colors. Green borders, nuclear genes; blue borders, mitochondrial genes. Node size is proportional to the number of direct neighbors (connectivity) of the node. Thickness of the edge is proportional to the frequency of this edge being observed across all cancer types. Edges are colored according to the connection type (gray: mtDNA gene–mtDNA gene connection; magenta: mtDNA gene–nuclear gene connection). BLCA, bladder urothelial carcinoma; BRCA, breast invasive carcinoma; CESC, cervical squamous cell carcinoma and endocervical adenocarcinoma; HNSC, head and neck squamous cell carcinoma; KICH, kidney chromophobe; KIRC, kidney renal clear cell carcinoma; KIRP, kidney renal papillary cell carcinoma; LGG, brain lower-grade glioma; LIHC, liver hepatocellular carcinoma; LUAD, lung adenocarcinoma; LUSC, lung squamous cell carcinoma; PRAD, prostate adenocarcinoma; THCA, thyroid carcinoma.

References

    1. Schon EA, DiMauro S, Hirano M. Human mitochondrial DNA: roles of inherited and somatic mutations. Nat. Rev. Genet. 2012;13:878–890. doi: 10.1038/nrg3275. - DOI - PMC - PubMed
    1. Smeitink J, van den Heuvel L, DiMauro S. The genetics and pathology of oxidative phosphorylation. Nat. Rev. Genet. 2001;2:342–352. doi: 10.1038/35072063. - DOI - PubMed
    1. Anderson S, et al. Sequence and organization of the human mitochondrial genome. Nature. 1981;290:457–465. doi: 10.1038/290457a0. - DOI - PubMed
    1. Brandon M, Baldi P, Wallace DC. Mitochondrial mutations in cancer. Oncogene. 2006;25:4647–4662. doi: 10.1038/sj.onc.1209607. - DOI - PubMed
    1. Zong WX, Rabinowitz JD, White E. Mitochondria and cancer. Mol. Cell. 2016;61:667–676. doi: 10.1016/j.molcel.2016.02.011. - DOI - PMC - PubMed

Publication types

Substances