. 2020 Mar;52(3):306-319.
doi: 10.1038/s41588-019-0562-0. Epub 2020 Feb 5.

Pan-cancer analysis of whole genomes identifies driver rearrangements promoted by LINE-1 retrotransposition

Bernardo Rodriguez-Martin  1   2   3 Eva G Alvarez #  1   2   3 Adrian Baez-Ortega #  4 Jorge Zamora #  1   3   5   6 Fran Supek #  7   8 Jonas Demeulemeester  9   10 Martin Santamarina  1   2   11 Young Seok Ju  12   13 Javier Temes  1   3 Daniel Garcia-Souto  11 Harald Detering  2   14   15 Yilong Li  6 Jorge Rodriguez-Castro  11 Ana Dueso-Barroso  16   17 Alicia L Bruzos  1   2   11 Stefan C Dentro  9   18   19 Miguel G Blanco  20   21 Gianmarco Contino  22 Daniel Ardeljan  23 Marta Tojo  5   14 Nicola D Roberts  6 Sonia Zumalave  1   11 Paul A Edwards  24   25 Joachim Weischenfeldt  26   27   28 Montserrat Puiggròs  17 Zechen Chong  29   30 Ken Chen  31 Eunjung Alice Lee  32 Jeremiah A Wala  33   34   35   36 Keiran M Raine  13 Adam Butler  13 Sebastian M Waszak  26 Fabio C P Navarro  37   38   39 Steven E Schumacher  33   34   35 Jean Monlong  40 Francesco Maura  13   41   42 Niccolo Bolli  41   42 Guillaume Bourque  43 Mark Gerstein  37   38   39 Peter J Park  44   45 David C Wedge  13   18   46 Rameen Beroukhim  33   35   36 David Torrents  8   17 Jan O Korbel  26   47 Iñigo Martincorena  6 Rebecca C Fitzgerald  22 Peter Van Loo  9   10 Haig H Kazazian  23 Kathleen H Burns  48   49 PCAWG Structural Variation Working GroupPeter J Campbell  50   51 Jose M C Tubio  52   53   54   55 PCAWG Consortium
Collaborators, Affiliations

Pan-cancer analysis of whole genomes identifies driver rearrangements promoted by LINE-1 retrotransposition

Bernardo Rodriguez-Martin et al. Nat Genet. 2020 Mar.

Erratum in

  • Author Correction: Pan-cancer analysis of whole genomes identifies driver rearrangements promoted by LINE-1 retrotransposition.
    Rodriguez-Martin B, Alvarez EG, Baez-Ortega A, Zamora J, Supek F, Demeulemeester J, Santamarina M, Ju YS, Temes J, Garcia-Souto D, Detering H, Li Y, Rodriguez-Castro J, Dueso-Barroso A, Bruzos AL, Dentro SC, Blanco MG, Contino G, Ardeljan D, Tojo M, Roberts ND, Zumalave S, Edwards PA, Weischenfeldt J, Puiggròs M, Chong Z, Chen K, Lee EA, Wala JA, Raine KM, Butler A, Waszak SM, Navarro FCP, Schumacher SE, Monlong J, Maura F, Bolli N, Bourque G, Gerstein M, Park PJ, Wedge DC, Beroukhim R, Torrents D, Korbel JO, Martincorena I, Fitzgerald RC, Van Loo P, Kazazian HH, Burns KH; PCAWG Structural Variation Working Group; Campbell PJ, Tubio JMC; PCAWG Consortium. Rodriguez-Martin B, et al. Nat Genet. 2023 Jun;55(6):1080. doi: 10.1038/s41588-023-01319-9. Nat Genet. 2023. PMID: 36944736 Free PMC article. No abstract available.

Abstract

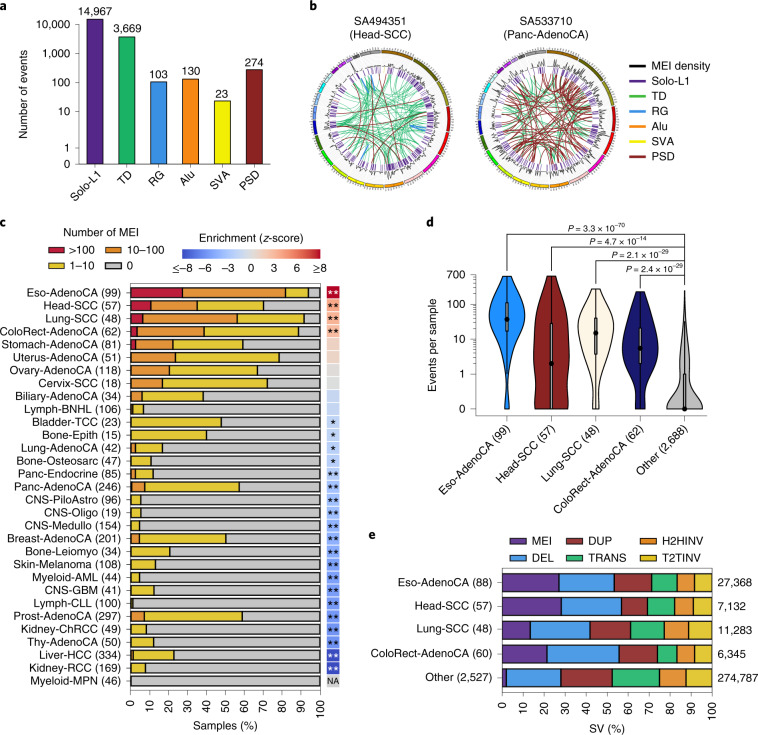
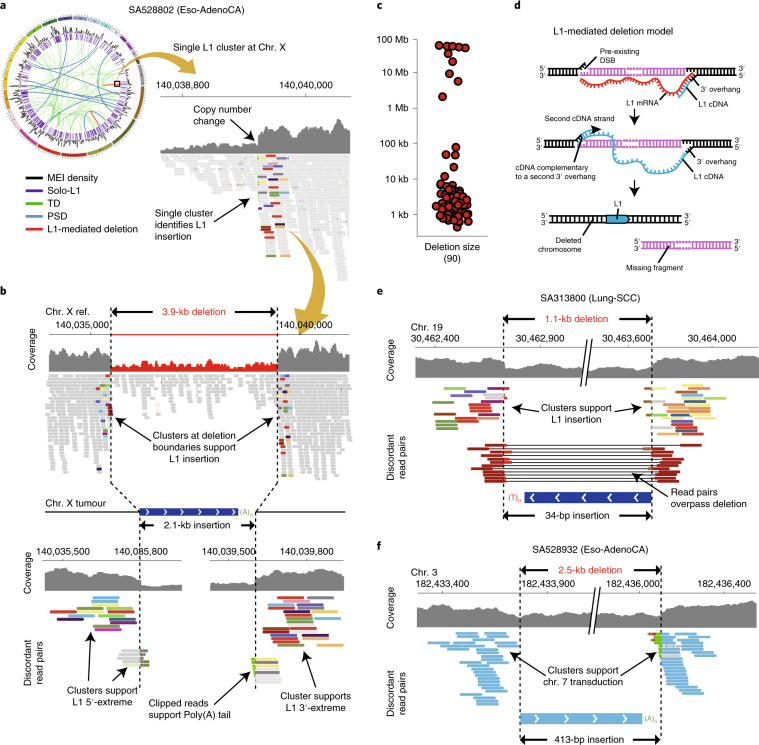
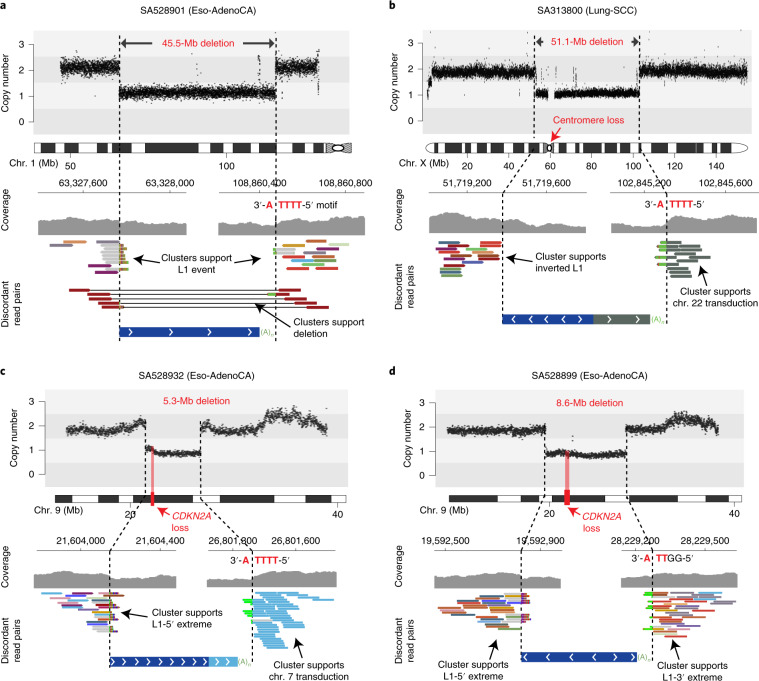
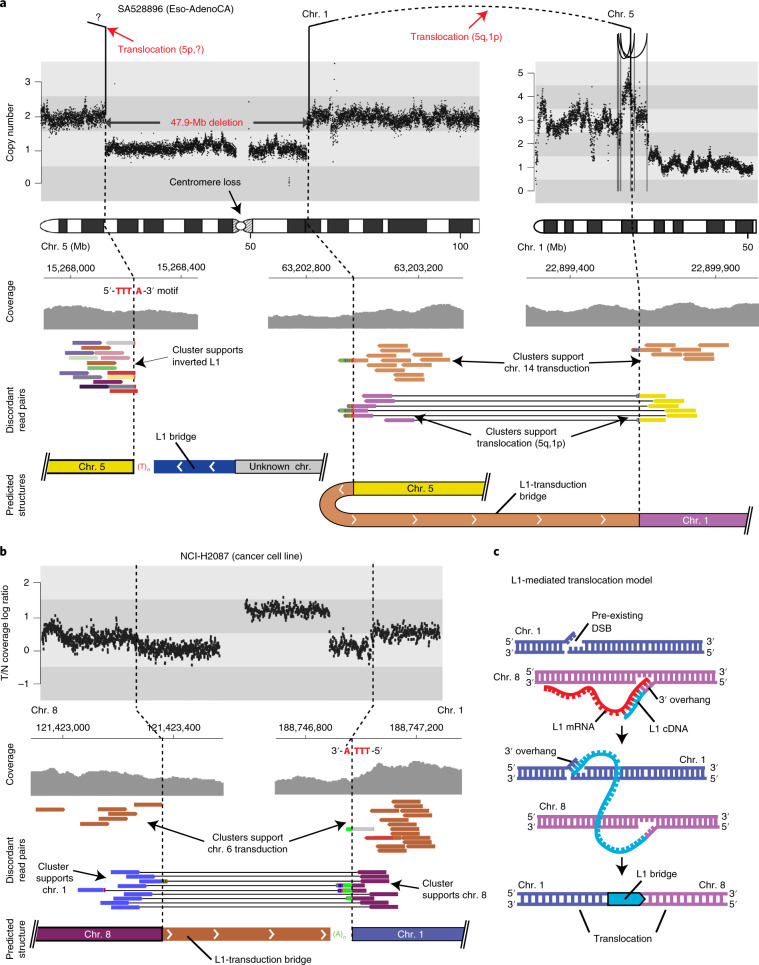
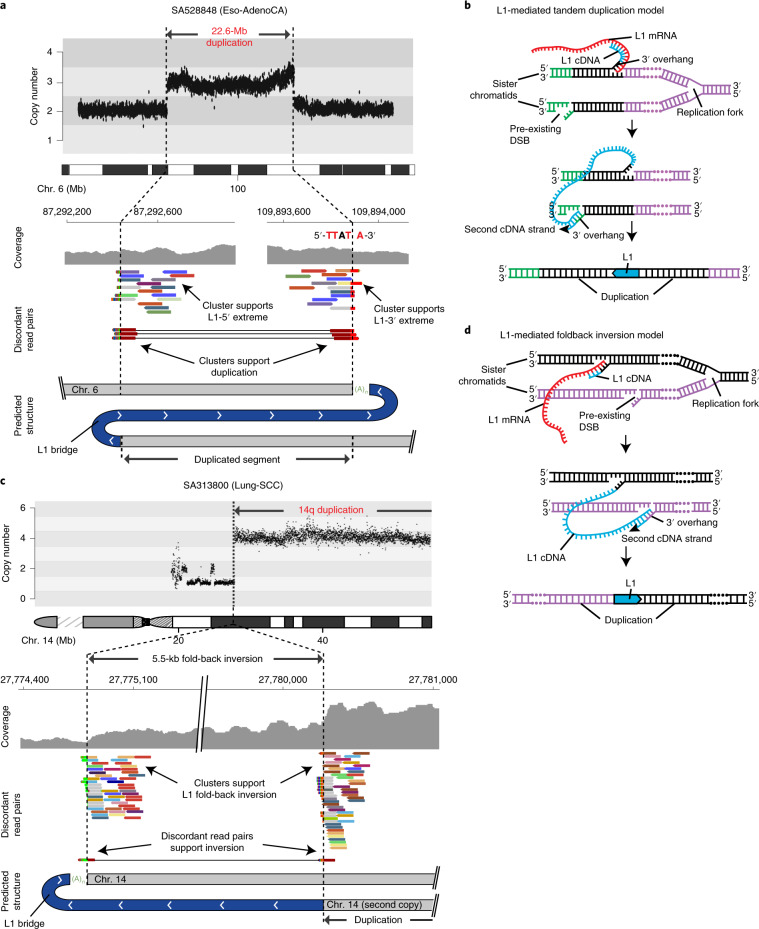
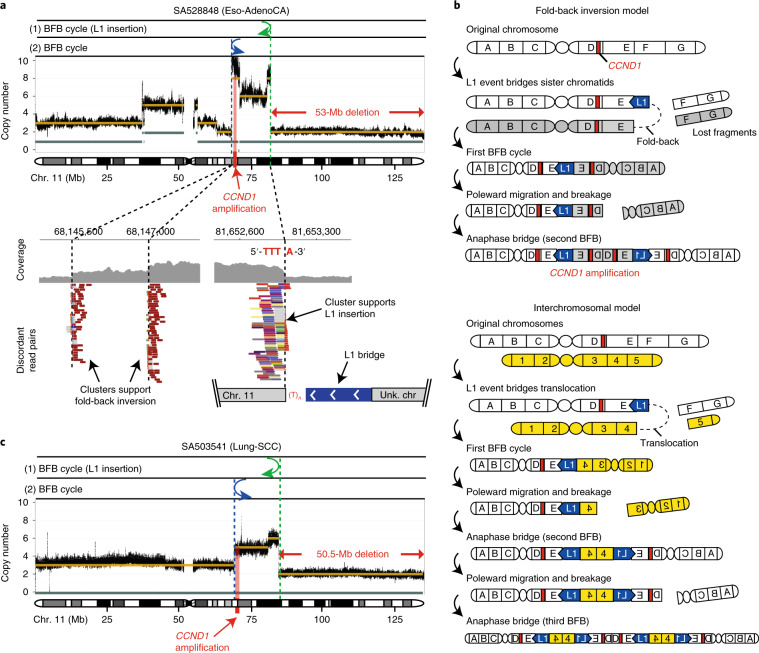
About half of all cancers have somatic integrations of retrotransposons. Here, to characterize their role in oncogenesis, we analyzed the patterns and mechanisms of somatic retrotransposition in 2,954 cancer genomes from 38 histological cancer subtypes within the framework of the Pan-Cancer Analysis of Whole Genomes (PCAWG) project. We identified 19,166 somatically acquired retrotransposition events, which affected 35% of samples and spanned a range of event types. Long interspersed nuclear element (LINE-1; L1 hereafter) insertions emerged as the first most frequent type of somatic structural variation in esophageal adenocarcinoma, and the second most frequent in head-and-neck and colorectal cancers. Aberrant L1 integrations can delete megabase-scale regions of a chromosome, which sometimes leads to the removal of tumor-suppressor genes, and can induce complex translocations and large-scale duplications. Somatic retrotranspositions can also initiate breakage-fusion-bridge cycles, leading to high-level amplification of oncogenes. These observations illuminate a relevant role of L1 retrotransposition in remodeling the cancer genome, with potential implications for the development of human tumors.


Conflict of interest statement

The authors declare no competing interests.

Figures

Fig. 1
Fig. 1. Landscape of somatic retrotransposition across human cancers.
a) Number of somatic retrotransposition events identified in 2,954 cancer genomes across six categories: solo-L1, L1-mediated transductions (TD), L1-mediated rearrangements (RG), Alu, SVA and pseudogenes (PSD). b, Left, circos plot showing a head-and-neck tumor (Head-SCC) with high retrotransposition rate (638 somatic events). Right, a single pancreatic adenocarcinoma sample harboring around 26% (70 out of 274) of all processed pseudogenes identified in the PCAWG cohort. Chromosome ideograms are shown around the outer ring with individual rearrangements represented as arcs; colors match the type of rearrangement. c, For 31 PCAWG cancer types with sample size of n ≥ 15, data show the proportion of tumor samples with >100 (red), 10–100 (orange), 1–10 (yellow) and 0 (gray) somatic retrotranspositions. The number of samples analyzed for each tumor type is shown in parentheses. Retrotransposition enrichment or depletion for each tumor type together with the level of significance (zero-inflated negative binomial regression) is shown. *P < 0.05, **P < 0.01. NA, not applicable. d, Distribution of retrotransposition events per sample across the four tumor types significantly enriched in somatic retrotranspositions; the remaining tumors are grouped into ‘Other’. The number of samples from each group is shown in parentheses; point, median; box, 25th to 75th percentiles (interquartile range); whiskers, data within 1.5× the interquartile range. P values indicate significance from a two-tailed Mann–Whitney U-test. The y axis is shown on a logarithmic scale. e, For the same four tumor types in d, the fraction of structural variants (SV) belonging to six classes is shown: mobile element insertions (MEI), deletions (DEL), duplications (DUP), translocations (TRANS), head-to-head inversions (H2HINV) and tail-to-tail inversions (T2TINV). The total number of structural variants per cancer type is indicated on the right side of the panel.
Fig. 2
Fig. 2. Distribution of L1 somatic insertions across the cancer genome and its association with genome organization features.
Genome-wide analysis of the distribution of 15,906 somatic L1 insertions, which include solo-L1 and L1 transductions with a 3′-poly(A) breakpoint characterized to base-pair resolution. a, The L1 insertion rate (purple) is shown together with the L1 endonuclease (EN) motif density (blue) and replication timing (orange). The data are represented per 1-Mb window. For illustrative purposes, only chromosome 3 is shown. b, Association between L1 insertion rate and multiple predictor variables at single-nucleotide resolution. Enrichment scores (thick dots) are adjusted for multiple covariates and compare the L1 insertion rate in bins 1–3 for a particular genomic feature (L1 endonuclease motif, replication timing, open chromatin, histone marks and expression level) versus bin 0 of the same feature, which therefore always has log-transformed enrichment = 0 by definition and is not shown. The error bars represent 95% confidence intervals. The number of observations per bin is provided in parentheses. MMs, the number of mismatches with respect to the consensus L1 endonuclease motif (see Supplementary Note). Heterochromatic regions and transcription elongation are defined based on H3K9me3 and H3K36me3 histone marks. Accessible chromatin is measured through DNase hypersensitivity. c, L1 insertion density, using kernel density estimate (KDE), along the replication timing spectrum. DNA replication timing is expressed on a scale from 80 (early) to 0 (late).
Fig. 3
Fig. 3. The dynamics of L1 source-element activity in human cancer.
a, The total number of transductions identified for each cancer type is shown as a blue-colored scale. The sample size for each tumor type is shown in parentheses. Contribution of each source element is defined as the proportion of the total number of transductions from each cancer type that is explained by each source locus. Only the top ten contributing source elements are shown, while the remaining are grouped into the category ‘Other’. b, Two extreme patterns of hot-L1 activity, Strombolian (blue) and Plinian (red), were identified. Dots show the number of transductions promoted by each source element in a given tumor sample. Arrows highlight violent eruptions (that is, strong peaks of somatic activity) in particular samples. c, Number of active germline L1 source elements per sample, across cancer types with source element activity. A source element is considered to be active in a given sample if it promotes at least one transduction. The enrichment or depletion of the number of active source elements for each tumor type together with the level of significance (zero-inflated negative binomial regression) is shown. *P < 0.05, **P < 0.01. The number of samples analyzed for each tumor type is shown in parentheses. d, Correlation between the number of somatic L1 insertions and the number of active germline L1 source elements in PCAWG samples. Each dot represents a tumor sample and colors match cancer types. Sample sizes (n), together with Spearman’s ρ and P values are shown above the panel.
Fig. 4
Fig. 4. The hallmarks of somatic L1-mediated deletions revealed by copy-number and paired-end mapping analysis.
a, In esophageal adenocarcinoma sample SA528802, we found a single cluster of reads on chromosome X, which is associated with one breakpoint of a copy-number loss, and for which the mates unequivocally identified one extreme of a somatic L1 integration. Paired-end reads are colored by the chromosome on which their mates can be found. Different colors for different reads from the same cluster indicate that mates are mapping a repetitive element. b, Analysis of the associated copy-number change on chromosome X identifies the missing L1 reciprocal cluster at the second breakpoint of the copy-number loss, and reveals a 3.9-kb deletion that occurs in conjunction with the integration of a 2.1-kb L1 somatic insertion. (A)n and (T)n represent poly(A) and poly(T) tails, respectively. c, Model of L1-mediated deletion. The integration of an L1 mRNA starts with L1-endonuclease cleavage promoting a 3′ overhang for reverse transcription. The cDNA (−) strand invades a second 3′ overhang from a pre-existing double-strand break upstream of the initial integration site. d, Distribution of the sizes of 90 L1-mediated deletions identified in the PCAWG dataset. e, In lung squamous carcinoma sample SA313800, a 34-bp truncated L1 insertion promotes a 1.1-kb deletion on chromosome 19. Because the L1 insertion was so short, we also identified discordant read pairs that span the L1 event and support the deletion. f, In esophageal adenocarcinoma sample SA528932, the integration on chromosome 3 of a 413-bp orphan L1 transduction from chromosome 7 causes a 2.5-kb deletion, which is supported by two clusters of discordant read pairs for which the mates map onto the transduced region of chromosome 7.
Fig. 5
Fig. 5. Somatic integration of L1 causes loss of megabase-size interstitial chromosomal regions in cancer.
a, In esophageal adenocarcinoma sample SA528901, a 45.5-Mb interstitial deletion on chromosome 1 is generated after integration of a short L1 event. We observed a pair of clusters of discordant read pairs for which the mates support both extremes of the L1 insertion. Because the L1 element event is smaller than the library insert size, we also identified read pairs that span the L1 event and support the deletion. The L1-endonuclease 5′-TTTT/A-3′ motif identifies a target-primed reverse transcription (TPRT) L1-integration mechanism. b, In esophageal tumor sample SA313800, a partnered transduction (that is, the transduced region and its companion L1 source element) from chromosome 22 is integrated on chromosome X, promoting a 51.1-Mb deletion that removes the centromere. One negative cluster (green reads) supports a small region transduced from chromosome 22. c, L1-mediated deletions promote the loss of tumor-suppressor genes. In esophageal tumor sample SA528932, the somatic integration on chromosome 9 of a partnered transduction from chromosome 7, promotes a 5.3-Mb deletion that involves the loss of one copy of the tumor-suppressor gene CDKN2A. We observed a positive cluster of reads for which the mates map onto the 5′ extreme of an L1, and a negative cluster that contains split reads that match a poly(A) region and for which the mates map onto a region that is transduced from chromosome 7 (light blue). d, In a second esophageal adenocarcinoma sample, SA528899, the integration of an L1 retrotransposon generates an 8.6-Mb deletion that involves the same tumor-suppressor gene, CDKN2A. The sequencing data reveal two clusters—positive and negative—for which the mates support the L1 event.
Fig. 6
Fig. 6. Somatic L1 integration promotes translocations in human cancers.
a, In esophageal adenocarcinoma sample SA528896, two separate L1 events mediate interchromosomal rearrangements. In the first, an L1 transduction from a source element on chromosome 14q23.1 bridged an unbalanced translocation from chromosome 1p to 5q. A second somatic retrotransposition event bridged from chromosome 5p to an unknown part of the genome, completing a 47.9-Mb interstitial copy-number loss on chromosome 5 that removes the centromere. b, In a cancer cell line, NCI-H2087, we found an interchromosomal translocation, between chromosomes 8 and 1, mediated by a region transduced from chromosome 6, which acts as a bridge and joins both chromosomes. We observed two read clusters, positive and negative, that demarcate the boundaries of the rearrangement, for which the mates support the transduction event. In addition, two reciprocal clusters span the insertion breakpoints, supporting the translocation between chromosomes 8 and 1. c, A model for megabase-size L1-mediated interchromosomal rearrangements. L1-endonuclease cleavage promotes a 3′ overhang in the negative strand, retrotranscription starts and the cDNA (−) strand invades a second 3′ overhang from a pre-existing double-strand break on a different chromosome, leading to translocation.
Fig. 7
Fig. 7. Somatic L1 integration promotes duplications of megabase-scale regions in human cancers.
a, In esophageal adenocarcinoma sample SA528848, we found a 22.6-Mb tandem duplication on the long arm of chromosome 6. The analysis of the sequencing data at the boundaries of the rearrangement breakpoints reveals two clusters of discordant read pairs for which the mates support the involvement of an L1 event. Because the L1 element was shorter than the library size, we also found two reciprocal clusters that aligned 22.6 Mb apart on the genome and in opposite orientation, spanning the insertion breakpoints and confirming the tandem duplication. An L1-endonuclease 5′-TTT/A-3′ degenerate motif was found. b, Large direct tandem duplications can be generated if the cDNA (−) strand invades a second 3′ overhang from a pre-existing double-strand break that occurred on a sister chromatid, and downstream to the initial integration site locus. c, In lung tumor sample SA313800, a small L1 insertion causes a 79.6-Mb duplication of the 14q arm through the induction of a fold-back inversion rearrangement. The analysis of the sequencing data at the breakpoint revealed two clusters of discordant read pairs (multi-colored reads) with the same orientation, aligning close together (5.5 kb apart) and demarcating a copy-number change for which the sequencing density is much greater on the right half of the rearrangement than the left. Both clusters of multi-colored reads support the integration of an L1. d, L1-mediated fold-back inversion model.
Fig. 8
Fig. 8. Somatic integration of L1 can trigger breakage–fusion–bridge cycles that lead to oncogene amplification.
a, In esophageal adenocarcinoma sample SA528848, a single cluster of discordant reads (multi-colored reads) together with an L1-endonuclease cleavage site motif 5′-TTT/A-3′ supports the integration of an L1 event that demarcates a 53-Mb telomeric (that is, including the telomere) deletion, from a region of massive amplification that involves CCND1. Around 14 Mb upstream of the breakpoint of the deletion, we observed the presence of two clusters of read pairs (brown reads) that align close together and in the same orientation, which demarcate a change in copy number; this is a distinctive pattern of a fold-back inversion,, a rearrangement typically found to be associated with breakage–fusion–bridge (BFB) repair. In this fold-back inversion, the coverage shows much greater density on the right half of the rearrangement than the left, indicating that the abnormal chromosome is folded back on itself leading to duplicated genomic sequences in a head-to-head (inverted) orientation. The patterns described here suggest two independent breakage–fusion–bridge cycles, marked with (1) and (2). The copy-number plot shows the consensus total copy numbers (gold band) and the minor allele copy numbers (gray band). b, Models for the patterns described in a. The fold-back inversion model involves two breakage–fusion–bridge cycles, one induced by L1-mediated fold-back inversion (see Fig. 7d), and a second induced by standard breakage–fusion–bridge repair. The interchromosomal rearrangement model involves an interchromosomal rearrangement mediated by an L1, followed by one extra cycle of breakage–fusion–bridge repair. c, In lung cancer sample SA503541, the integration of an L1 retrotransposon is associated with a 50-Mb loss on 11q that includes the telomere, and activates breakage–fusion–bridge repair, which leads to the amplification of CCND1.

References

    1. International Human Genome Sequencing Consortium Initial sequencing and analysis of the human genome. Nature. 2001;409:860–921. doi: 10.1038/35057062. - DOI - PubMed
    1. Kazazian HH., Jr. Mobile elements: drivers of genome evolution. Science. 2004;303:1626–1632. doi: 10.1126/science.1089670. - DOI - PubMed
    1. Sassaman DM, et al. Many human L1 elements are capable of retrotransposition. Nat. Genet. 1997;16:37–43. doi: 10.1038/ng0597-37. - DOI - PubMed
    1. Brouha B, et al. Hot L1s account for the bulk of retrotransposition in the human population. Proc. Natl Acad. Sci. USA. 2003;100:5280–5285. doi: 10.1073/pnas.0831042100. - DOI - PMC - PubMed
    1. Beck CR, et al. LINE-1 retrotransposition activity in human genomes. Cell. 2010;141:1159–1170. doi: 10.1016/j.cell.2010.05.021. - DOI - PMC - PubMed

Publication types

MeSH terms