. 2020 Mar;52(3):294-305.
doi: 10.1038/s41588-019-0564-y. Epub 2020 Feb 5.

Disruption of chromatin folding domains by somatic genomic rearrangements in human cancer

Collaborators, Affiliations

Disruption of chromatin folding domains by somatic genomic rearrangements in human cancer

Kadir C Akdemir et al. Nat Genet. 2020 Mar.

Erratum in

Abstract

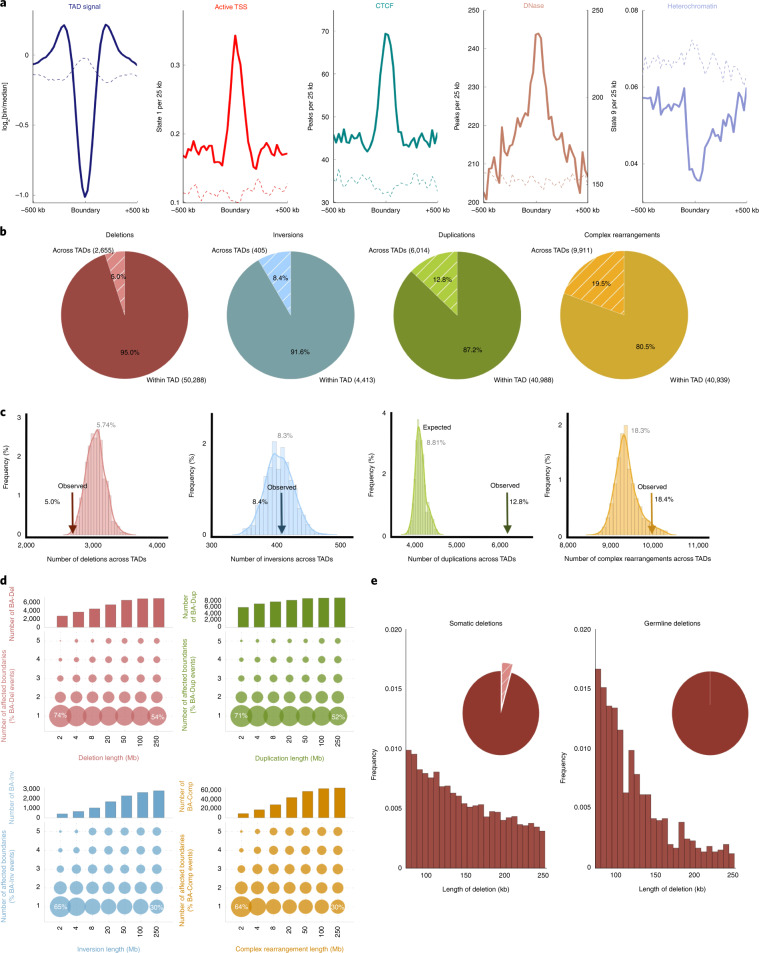
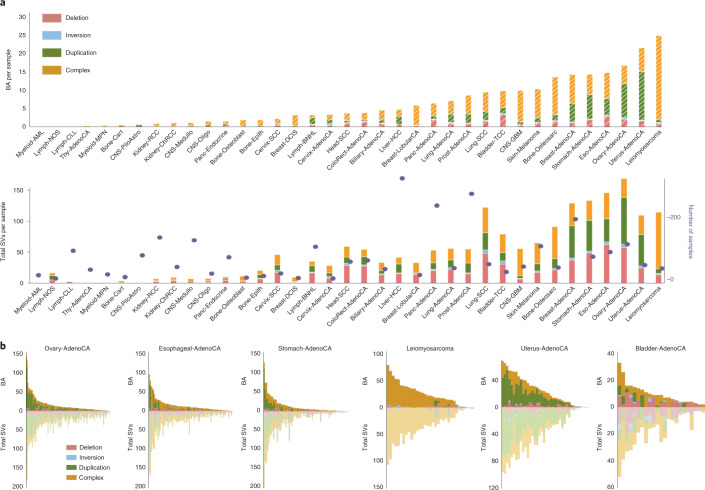
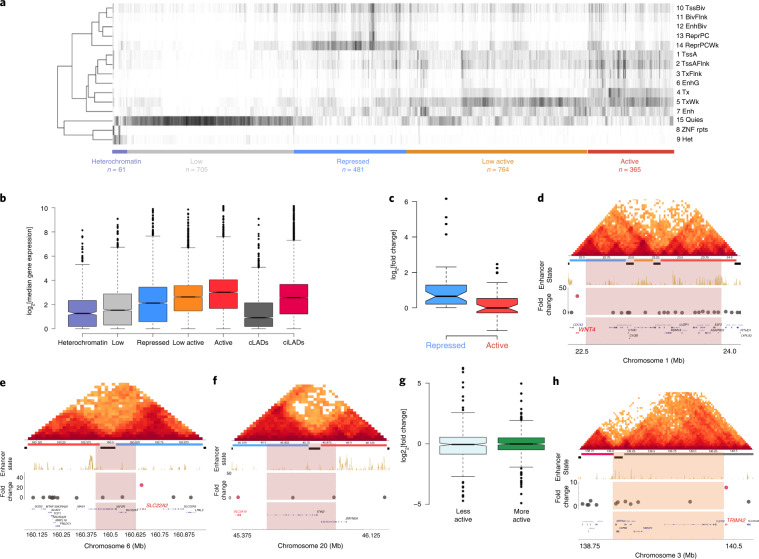
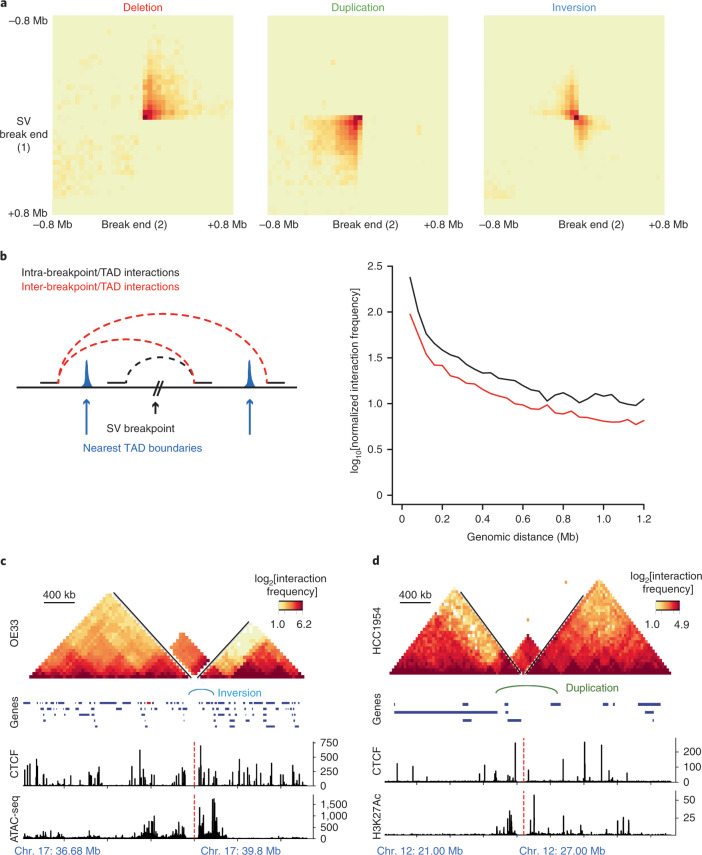
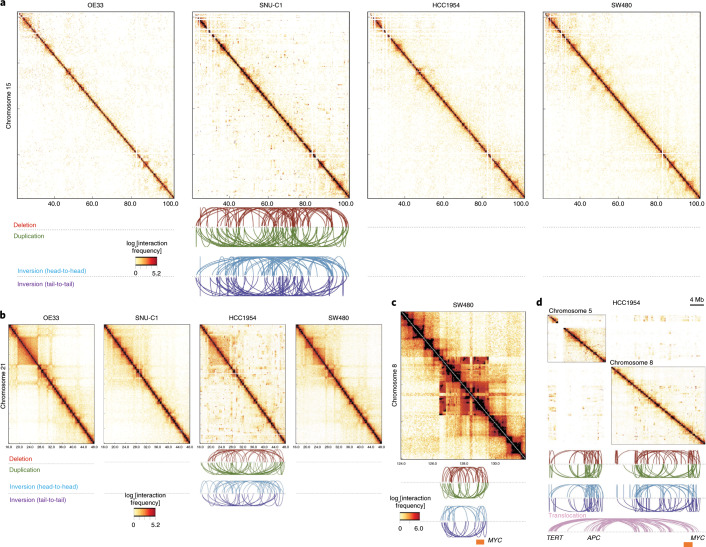
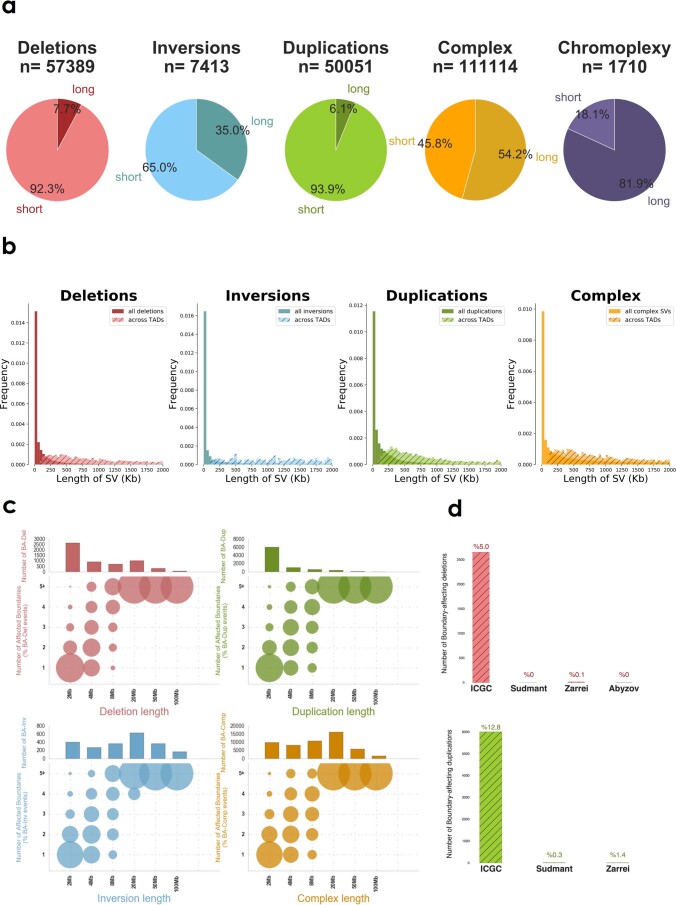
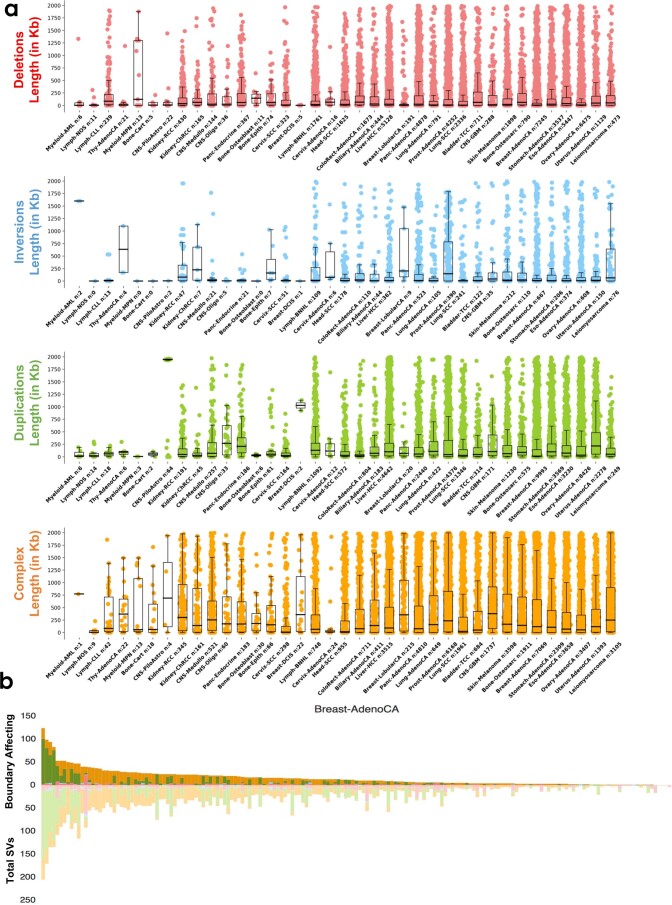
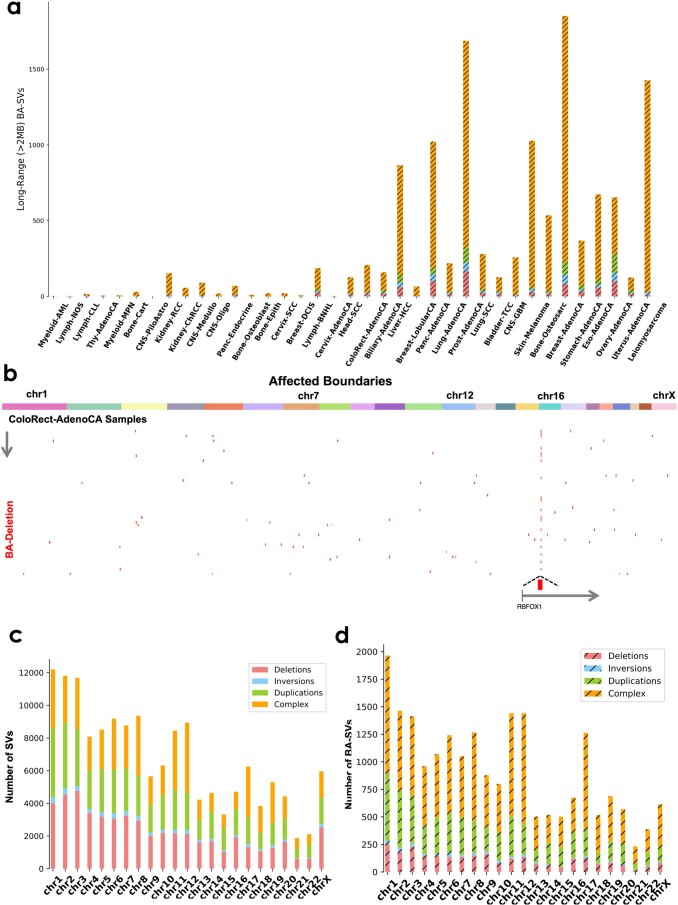
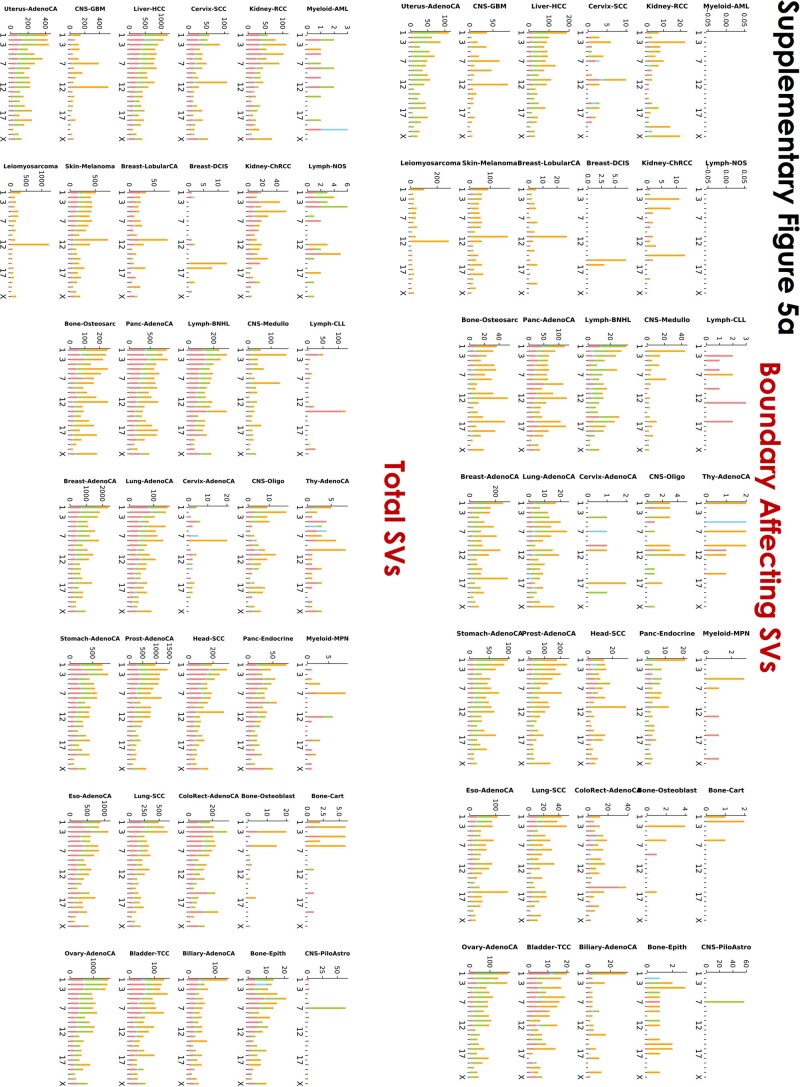
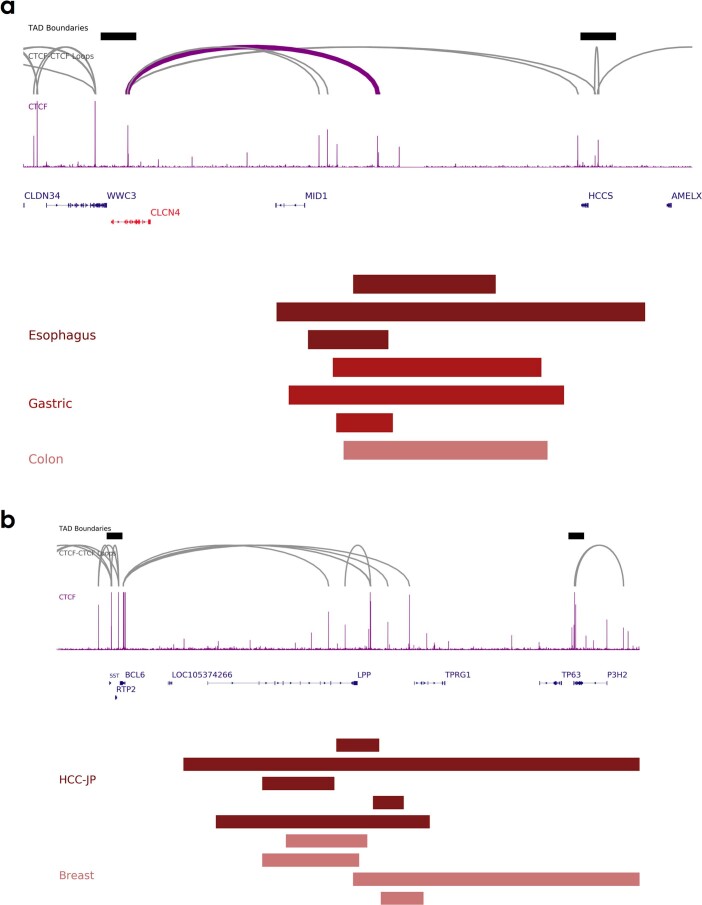
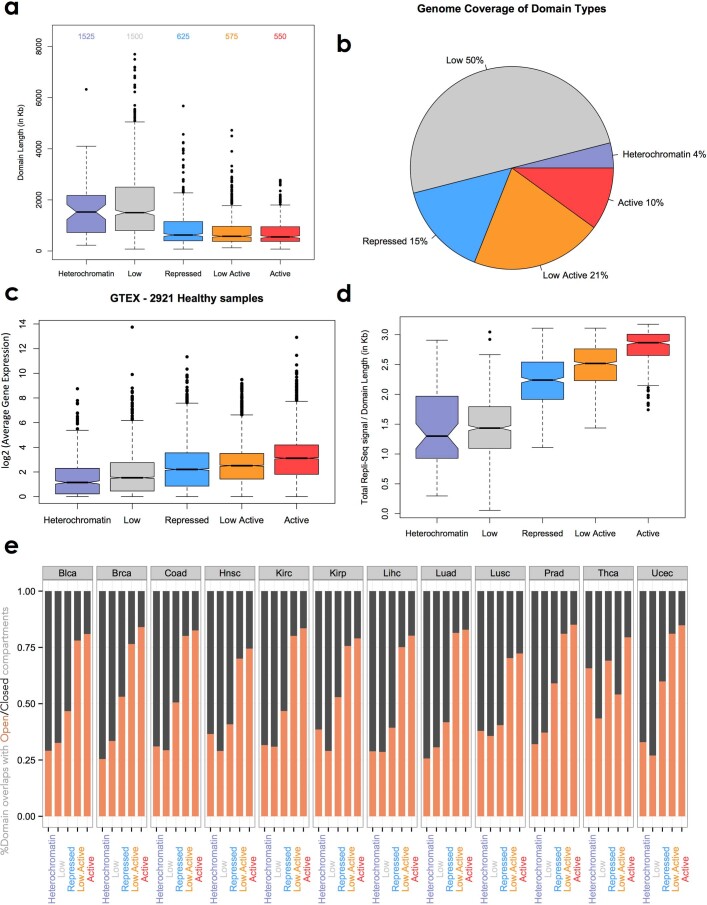
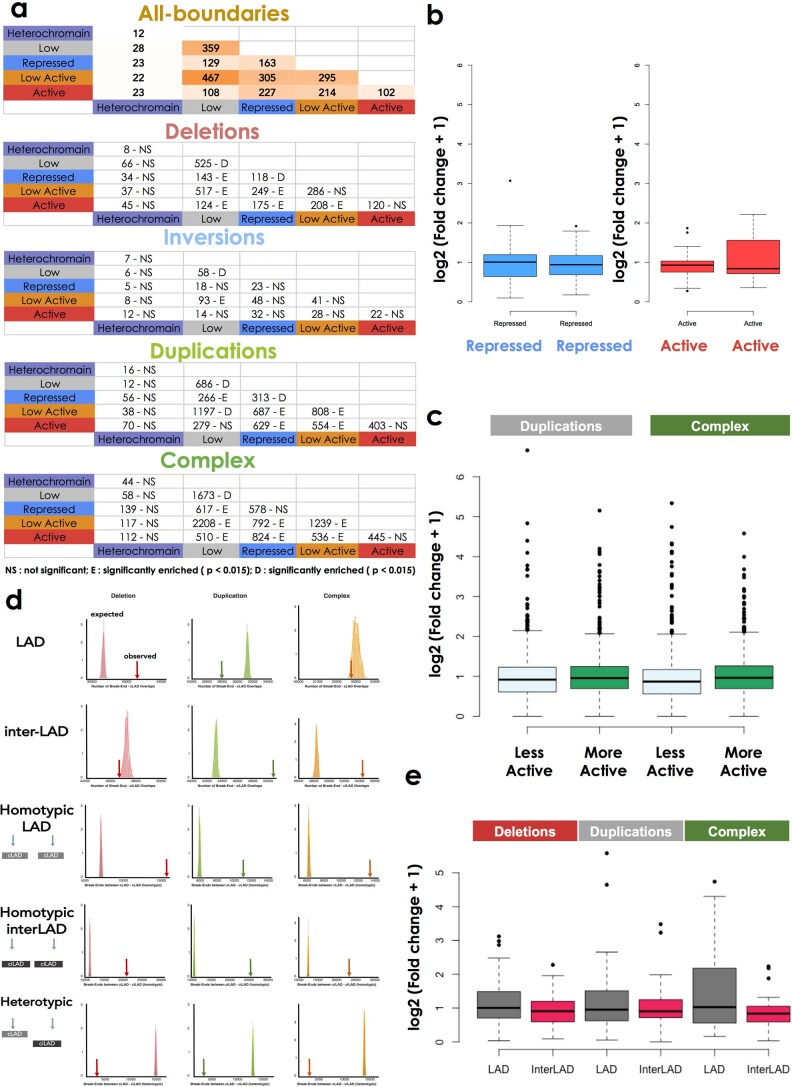
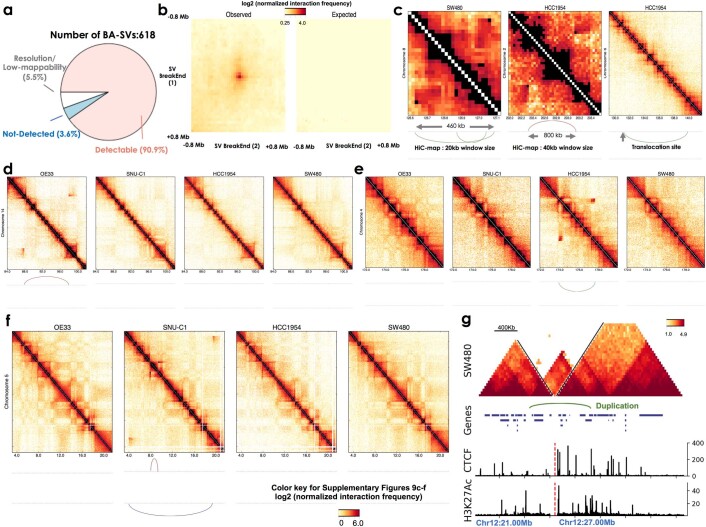
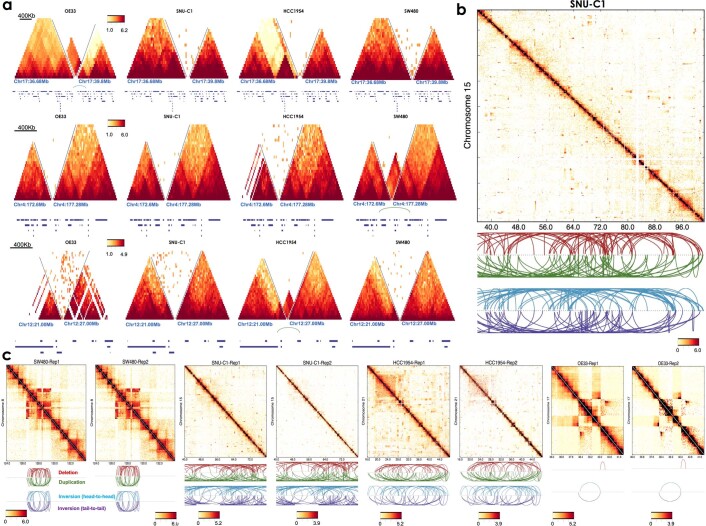
Chromatin is folded into successive layers to organize linear DNA. Genes within the same topologically associating domains (TADs) demonstrate similar expression and histone-modification profiles, and boundaries separating different domains have important roles in reinforcing the stability of these features. Indeed, domain disruptions in human cancers can lead to misregulation of gene expression. However, the frequency of domain disruptions in human cancers remains unclear. Here, as part of the Pan-Cancer Analysis of Whole Genomes (PCAWG) Consortium of the International Cancer Genome Consortium (ICGC) and The Cancer Genome Atlas (TCGA), which aggregated whole-genome sequencing data from 2,658 cancers across 38 tumor types, we analyzed 288,457 somatic structural variations (SVs) to understand the distributions and effects of SVs across TADs. Notably, SVs can lead to the fusion of discrete TADs, and complex rearrangements markedly change chromatin folding maps in the cancer genomes. Notably, only 14% of the boundary deletions resulted in a change in expression in nearby genes of more than twofold.


Conflict of interest statement

R.B. owns equity in Ampressa Therapeutics, is the chair of the scientific advisory board of and consultant for OrigiMed, has received research funding from Bayer and Ono Pharma, and receives patent royalties from LabCorp. All other authors have no competing interests.

Figures

Fig. 1
Fig. 1. TAD boundaries are affected by different types of somatic SVs in cancer genomes.
a, Profiles of TAD signals, active transcription start sites (TSS), CTCF peaks, DNase I hypersensitivity and heterochromatic states around common TAD boundaries. Dashed lines represent enrichment levels for the shuffled boundaries. b, The percentage of short-range SVs (length ≤ 2 Mb) across TADs (shaded) and within TADs (solid) for different SV types. SVs that occur across TADs are referred to as BA-SVs. c, Observed (arrows) and expected distribution (histograms) of BA-SVs. The expected distribution is based on randomly shuffled boundary data. d, Number of affected boundaries (x axis) per short-range SV length cut-off (y axis). The size of the circles indicates the portion of BA-SVs that affect the specific number of boundaries for each length scale. BA-deletion, BA-inversions, BA-duplications and BA-complex rearrangements are shown in red, cyan, green and orange, respectively. e, Histograms represent the length distribution of somatic and germline deletions in the PCAWG cohort within the 75–250 kb range. Pie charts show the percentage of deletions across TADs (shaded) (4.1% for somatic and less than 0.1% for germline events) and within TADs (solid).
Fig. 2
Fig. 2. Chromatin folding disruptions are specific to histological subtypes.
a, Top, the distribution of the average number of BA-SVs per sample for each histological type. Bottom, The distribution of the average number of SVs observed in each histological type. Purple dots represent patient numbers for each histological type. Deletions, inversions, tandem duplications and complex rearrangements are shown in red, cyan, green and orange, respectively. b, Per-sample counts of BA-SV (top) and total SV (bottom) events for ovary, esophageal and gastric adenocarcinoma cohorts (left), and leiomyosarcoma, uterine adenocarcinoma and bladder adenocarcinoma cohorts (right). Deletions, inversions, tandem duplications and complex rearrangements are shown in red, cyan, green and orange, respectively. Each bar represents a sample and samples are sorted by the number of BA-SV events.
Fig. 3
Fig. 3. Recurrently affected boundaries in specific cancer types.
a, Recurrently affected boundaries near known cancer driver genes (y axis) per histological type (x axis). The size of the circles indicates the portion of samples harboring a BA-SV event in a specific histological type. The color of the circles demonstrates the most common SV type (red, deletion; orange, complex; green, duplication; gray, different SV types were observed) in each histological type. b, Top, recurrently duplicated TAD boundaries in pilocytic astrocytoma. Columns of the heat map are TAD boundaries and rows represent each pilocytic astrocytoma sample. TAD boundaries affected by BA-duplications are colored in green. The schematic at the bottom shows the duplicated boundaries (green boxes) between KIAA1549 and BRAF. Bottom, distribution of BA-complex rearrangement (orange) events across chromosomes in each leiomyosarcoma sample. Heat maps show affected TAD boundaries in each leiomyosarcoma sample. The line plot at the bottom shows normalized mutation count. c, A potentially affected CTCF–CTCF chromatin loop in esophageal, gastric and colon adenocarcinoma near FOXC1. Black boxes show TAD boundaries, arcs represent common CTCF–CTCF loops observed in three different cell types (gray). The signal from CTCF chromatin immunoprecipitation followed by sequencing (ChIP–seq) (from the NHEK cell line) analysis is represented by a purple histogram. Red vertical bars indicate deletions in individual samples of esophageal, gastric and colon adenocarcinoma.
Fig. 4
Fig. 4. Most domain disruptions do not result in marked gene-expression changes.
a, Classification of TADs based on chromatin state coverage. The heat map shows domain-length normalized coverage of each chromatin state (rows) in each domain (columns). Domains are classified into five groups according to chromatin state combinations: heterochromatin (purple), low/quiescent (gray), repressed (blue), low active (orange) and active (red). b, Median expression levels (log2) in all PCAWG samples are shown for genes located in each TAD, constitutive LADs (cLADs) and inter-LADs (ciLADs). The number of genes in each annotation group: heterochromatin, 624; low, 2,874; repressed, 3,690; low active, 4,319; active: 4,578; constitutive LAD, 2,384; constitutive inter-LAD, 14,430. In these and all other box plots, the center line is the median; box limits are the upper and lower quantiles; whiskers represent 1.5× the interquartile range. c, The log2-transformed fold change in expression is shown for genes that are nearest to BA-deletion break-ends between repressed and active TADs (n = 43). df, Examples of BA-SV-harboring samples. Triangle heat maps represent chromatin contact frequency (log2) in NHEK cells. BA-SV regions are shaded. Colored tiles represent domains and black bars denote TAD boundaries. Roadmap Epigenome enhancer-state frequencies are shown as a yellow histogram. Dots show fold changes in expression in a lymphoma sample harboring a BA-deletion near WNT4 (d), a breast adenocarcinoma sample harboring a BA-deletion near SLC22A2 (e) and an ovarian adenocarcinoma sample harboring a BA-deletion near SLC2A10 (f). g, The log2-transformed fold change is shown for genes that are nearest to BA-deletion break-ends (n = 341). Transcriptionally less and more active refer to the ordering of domain annotations in a (that is, a low domain is considered less active than a low-active domain). h, Gene expression fold change in a melanoma sample harboring a complex SV between a LAD and an inter-LAD near TRIM42.
Fig. 5
Fig. 5. Cell-type-specific alterations in chromatin folding patterns associated with different SV types.
a, Average contact enrichment between break-ends of BA-SV events in cancer cell lines. b, TAD-fusion analysis. The schematic shows the classification of interactions based on the nearest TAD boundary. Interactions between SV breakpoint and the nearest TAD boundary are classified as intra-TAD/SV (black dashed line) and interactions that are not constrained by the nearest boundary are classified as inter-TAD/SV (red dashed line). The decay plot shows how the interaction frequency changes as a function of genomic distance. c, d, Examples of neo-TAD formations by SVs in cancer genomes. Contact frequencies (log2) of each cell type, plotted with a 40-kb window size. Bottom arcs represent SV breakpoint locations with rearrangements coded by color. Green, tandem duplication; red, deletion; cyan and purple, inversion. Histograms show CTCF ChIP–seq data from NHEK, ATAC-seq data from OE33 and H3K27ac ChIP–seq data from HCC1954 cell lines. Red lines (dashed) denote the locations of distinct genomic regions. c, An inversion (blue arc) in OE33 cells led to a TAD fusion around ERBB2. d, A duplication (green arc) in HCC1954 cells resulted in a TAD-like formation on chromosome 4.
Fig. 6
Fig. 6. Complex rearrangements markedly change chromatin folding maps in the cancer genomes.
ad, The effects of complex rearrangements on chromatin folding domains. Contact frequencies (log2) of each cell type, plotted with a 40-kb window size. Bottom arcs represent SV breakpoint locations with rearrangements coded by color. Green, tandem duplication; red, deletion; cyan and purple, inversion. a, SNU-C1 cells harbor a chromothripsis event that affects chromosome 15. b, HCC1954 cells contain a complex rearrangement on chromosome 21. c, The MYC locus contains regional complex rearrangements in SW480 cells. d, A complex rearrangement that involves TERT, APC and MYC changes interactions between chromosome 5 and 8 in HCC1954 cells. Purple arcs represent inter-chromosomal translocations.
Extended Data Fig. 1
Extended Data Fig. 1. Identification of TAD boundaries in different cell types.
a, An example region (chromosome2:132-140 Mb) presenting similar chromatin folding in 5 different cell types. Heatmaps represent Hi-C data for each cell type. Tiles represent TAD boundary calls for each cell type (red: GM12878; green: HUVEC; blue: IMR90; purple: HMEC; orange: NHEK). Triangles depict TAD calls for human ES cells (gray) and IMR90 cell line (gold) from a previous study. b, Venn diagrams show overlap between current IMR90 boundaries (solid) with boundaries (dashed) identified from a previous study for the IMR90 cell line. c, Aggregate plots show average cell-type specific enrichment levels for Hi-C interaction levels (TAD signal), CTCF binding sites, DNAseI hypersensitivity regions and H3K9me3 ChIP-seq levels compared to input DNA around each cell type’s TAD boundaries. d, Overlaps between TAD boundaries among 5 different cell lines. Horizontal bars represent total number of TAD boundaries per cell type. Vertical bars represent number of intersecting boundaries between cell types. Combination matrix (below), circles indicate that denote cell types are part of the intersection for each vertical bars. Common boundaries among all cell types represented with blue vertical bar. e, Histogram represents distribution of TADs length. f, Venn diagrams show overlap between common TAD boundaries and leukemia (K562) cell line TAD boundaries. g, Venn diagrams show overlap between common TAD boundaries and breast cancer (MCF) cell line TAD boundaries.
Extended Data Fig. 2
Extended Data Fig. 2. Distribution of boundary-affecting structural variations in human cancers.
a, Pie charts show the percentages of long-range (>2 Mb) and short-range (< = 2 Mb) for deletions (red), inversions (cyan), duplications (green), complex rearrangements (orange) and chromoplexy events (purple) in all PCAWG samples. b, Histograms show length distribution of all short-range SVs (solid) or Boundary Affecting SVs (dashed) for deletions (red), inversions (cyan), duplications (green) and complex rearrangements (orange) in all PCAWG samples. c, Number of affected boundaries (x-axis) per different short-range SV length cut-offs (y-axis). The size of the circles indicates the portion of BA-SVs affecting the specific number of boundaries for each length scale. BA-deletion, BA-inversions, BA-duplications and BA-complex rearrangements are represented with red, cyan, green and orange colors, respectively. d, Bar charts show TAD-boundary affecting top) deletions (red) and bottom) tandem-duplications (green) in cancer genomes, and in genomes of healthy individuals from three different studies.
Extended Data Fig. 3
Extended Data Fig. 3. Histology-specific features of boundary-affecting structural variations.
a, Box plots show the length (in Kb) distribution of short-range SVs (deletions: red, inversions: cyan, duplications: green) for each cancer histology subtypes. The center line is the median; box limits are the upper and lower quantiles; whiskers represent 1.5x the interquartile range. Number of SVs are indicated by each histology name. b, Per sample counts of BA-SVs (top) and total SV (bottom) events for breast adenocarcinoma cohort. Deletion, inversions, tandem-duplications and complex rearrangements are represented with red, cyan, green and orange colors, respectively. Each bar represents a samples and samples are sorted by the number of BA-SV events.
Extended Data Fig. 4
Extended Data Fig. 4. Further investigation of histology-specific features of boundary-affecting structural variations.
a, Distribution of average long-range (length of SV>2 Mb) structural variations (deletion (dashed-red), inversion (dashed-cyan), duplication (dashed-green) and complex rearrangements (dashed-orange)) per sample for each cancer histology subtypes. b, A recurrently deleted TAD boundary in colorectal adenocarcinoma samples near to the RBFOX1 gene. Colored bars on top depict chromosomal locations of the boundaries. Columns of the heatmap are TAD boundaries and rows represent each colorectal adenocarcinoma sample. TAD boundaries affected by BA-deletions are colored in red. Schematic below show the deleted boundary (red box) near to the RBFOX1 gene. c, Distributions of total SV burden (deletions: red, inversions: cyan, duplications: green, complex: orange) across chromosomes. d, Distributions of boundary affecting SVs across chromosomes.
Extended Data Fig. 5
Extended Data Fig. 5. Distribution of structural variation burden in different cancer histology subtypes.
a, Distribution of boundary-affecting (top) and total (bottom) SVs (deletions: red, inversions: cyan, duplications: green, complex: orange) across chromosomes in each cancer histology subtypes.
Extended Data Fig. 6
Extended Data Fig. 6. Examples of genomic alterations that potentially affect CTCF-CTCF chromatin folding loops.
a-b, Potentially affected insulated neighborhoods a, in esophageal, gastric and colon adenocarcinoma samples near to the CLCN4 gene and b, in liver-HCC and breast cancers near to BCL6 gene. Black boxes show TAD boundaries, arcs represent CTCF ChIA-PET loops observed in three different cell types (gray). CTCF ChIP-Seq (from NHEK cell line) signal is represented by purple histogram. Red vertical bars depict deletions in individual samples.
Extended Data Fig. 7
Extended Data Fig. 7. Classification of TADs based on the epigenetic landscape.
a, Box plots show length distributions of different TAD annotations. Heterochromatin: 61; Low: 705; Repressed: 481; Low-Active: 764; Active: 365. In these and all other boxplots in subsequent figures, the center line is the median; box limits are the upper and lower quantiles; whiskers represent 1.5x the interquartile range. b, Pie chart represents percent of mappable genome covered by each TAD annotation. c, Box plots represent median expression level (RPKM) for a gene residing in a given TAD annotation for GTEX consortia dataset. Number of genes in each annotation group: heterochromatin: 624; low: 2874; repressed: 3690; low-active: 4319; active: 4578. d, Box plots represent replication timing (Repli-Seq) values divided by domain length (in Kb) for each TAD annotations. Heterochromatin: 61; Low: 705; Repressed: 481; Low-Active: 764; Active: 365. e, Bar plots show percent of a TAD annotation covered by open (orange) or closed (black) chromatin domains calls from a previous study across different TCGA cancer types.
Extended Data Fig. 8
Extended Data Fig. 8. The majority of the domain disruptions do not result in drastic gene expression changes.
a, Occurrence of different SV types between domain types. Significance of the observed numbers calculated based on the expected distribution which is based on randomly shuffled boundary data, cumulative distribution of expected overlaps, z-scores were calculated based on observed number and obtained distribution from this bootstrapping exercise A two-tailed unpaired Student’s t-test was used to calculate p-values. Significantly enriched (E) or depleted (D) numbers are denoted next to the numbers. b, Box plots show log2 fold-change for the genes nearest to BA-deletions between repressed-repressed (n: 19; blue; left) or active-active (n: 36; red; right) domains. In these and all other boxplots in subsequent figures, the center line is the median; box limits are the upper and lower quantiles; whiskers represent 1.5x the interquartile range. c, Box plots show log2 fold-change for the genes nearest to BA-duplication (n: 1008) and BA-complex (n: 617) break-ends on different domain types. Here ‘less’ or ‘more’ transcriptionally active refers to the ordering of domain annotations in Fig. 4a (that is a low domain is considered less compared to a repressed domain). Fold change was calculated based on the gene’s expression in the sample harboring the BA-SV compared to the rest of the samples in the same cancer type. d, Observed (arrows) and expected distribution (histograms) of SVs between constitutive LADs and interLADs. The expected distribution is based on randomly shuffled LAD and interLADs. e, Box plots show log2 fold-change for the genes nearest to deletion (n: 50), duplication (n: 66) and complex (n: 39) SVs between constitutive LAD and interLADs.
Extended Data Fig. 9
Extended Data Fig. 9. Cell-type specific alterations of chromatin folding patterns by different structural variation types.
a, Pie chart represents the ratio of BA-SVs with detectable changes in Hi-C data from HCC1954, OE33, SNU-C1, SW480 cell lines. b, Average contact enrichment between break-ends of BA-SVs in cancerous and non-cancerous cell. Interactions between break-ends of BA-SVs longer than 1 Mb in length were included in this analysis. Breast epithelial cell line (HMEC) Hi-C data was used to represent non-cancerous cell interaction profile as the majority of BA-SVs in this analysis (56.3%) was detected in breast adenocarcinoma cell line (HCC1954). c, Examples of shortest BA-SVs with detectable changes in Hi-C maps and an SV with no detectable changes in Hi-C maps. Contact frequencies (log2) of each cell type, plotted with a 20KB (SW480) and 40Kb (HCC1954) window size. Arcs below represent SV breakpoint locations with rearrangements coded by color. Green: tandem duplication; red: deletion; cyan and purple: inversion. (Left) an 460Kb long duplication in SW480 cells; (middle) an 800 kb long deletion in HCC1954 cells; (right) a duplication overlapping with a translocation in HCC1954 cells resulted in no apparent contact map change. d-f) Represented regions for the effects of ‘simple’ genomic rearrangements on chromatin folding domains: d, A deletion on chromosome 4 in OE33 cells; e, A duplication on chromosome 14 in HCC1954 cells; f, A large inversion and a small deletion on chromosome 8 in SNU-C1 cells. g, A duplication (green arc) in SW480 cells results in a TAD-like formation on chromosome 4. Below histograms show CTCF and H3K27AC ChIP-Seq data from NHEK and SW480 cell lines, respectively. Red dashed line denotes the location of distinct genomic regions.
Extended Data Fig. 10
Extended Data Fig. 10. Specificity and reproducibility of chromatin organization alterations in cancer cell lines.
a, Hi-C data around the neoTAD regions demonstrated in Fig. 5c and Supplementary Fig 10g in all cell lines. b, A smaller window of chromosome 15 represented in Fig. 5d which depicts a massive chromothripsis event covering all of the chromosome15 in SNU-C1 cell line. c, Biological reproducibility of SV’s effect on chromatin folding patterns represented for each Hi-C replicates of cell lines. Contact frequencies (log2) of each cell type, plotted with a 40Kb window size. Arcs below represent SV breakpoint locations with rearrangements coded by color. Green: tandem duplication; red: deletion; cyan and purple: inversion.

References

    1. Dekker J, Heard E. Structural and functional diversity of topologically associating domains. FEBS Lett. 2015;589:2877–2884. doi: 10.1016/j.febslet.2015.08.044. - DOI - PMC - PubMed
    1. Bonev B, Cavalli G. Organization and function of the 3D genome. Nat. Rev. Genet. 2016;17:661–678. doi: 10.1038/nrg.2016.112. - DOI - PubMed
    1. Guelen L, et al. Domain organization of human chromosomes revealed by mapping of nuclear lamina interactions. Nature. 2008;453:948–951. doi: 10.1038/nature06947. - DOI - PubMed
    1. Dixon JR, et al. Topological domains in mammalian genomes identified by analysis of chromatin interactions. Nature. 2012;485:376–380. doi: 10.1038/nature11082. - DOI - PMC - PubMed
    1. Nora EP, et al. Spatial partitioning of the regulatory landscape of the X-inactivation centre. Nature. 2012;485:381–385. doi: 10.1038/nature11049. - DOI - PMC - PubMed

Publication types