
The repertoire of mutational signatures in human cancer

Ludmil B Alexandrov et al. Nature. 2020 Feb.

Erratum in

  • Author Correction: The repertoire of mutational signatures in human cancer.
    Alexandrov LB, Kim J, Haradhvala NJ, Huang MN, Tian Ng AW, Wu Y, Boot A, Covington KR, Gordenin DA, Bergstrom EN, Islam SMA, Lopez-Bigas N, Klimczak LJ, McPherson JR, Morganella S, Sabarinathan R, Wheeler DA, Mustonen V; PCAWG Mutational Signatures Working Group; Getz G, Rozen SG, Stratton MR; PCAWG Consortium. Alexandrov LB, et al. Nature. 2023 Feb;614(7948):E41. doi: 10.1038/s41586-022-05600-5. Nature. 2023. PMID: 36697836 Free PMC article. No abstract available.

Abstract

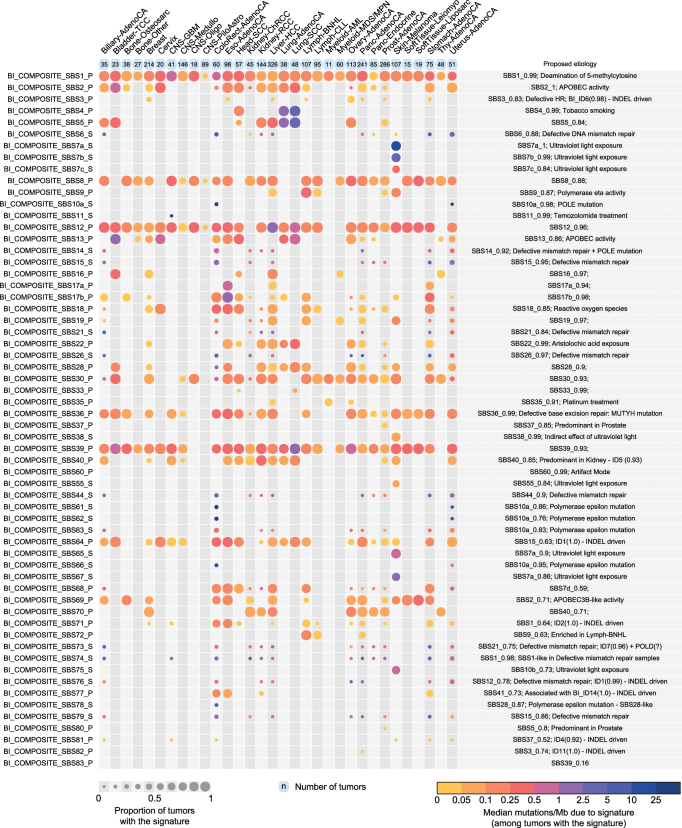
Somatic mutations in cancer genomes are caused by multiple mutational processes, each of which generates a characteristic mutational signature1. Here, as part of the Pan-Cancer Analysis of Whole Genomes (PCAWG) Consortium2 of the International Cancer Genome Consortium (ICGC) and The Cancer Genome Atlas (TCGA), we characterized mutational signatures using 84,729,690 somatic mutations from 4,645 whole-genome and 19,184 exome sequences that encompass most types of cancer. We identified 49 single-base-substitution, 11 doublet-base-substitution, 4 clustered-base-substitution and 17 small insertion-and-deletion signatures. The substantial size of our dataset, compared with previous analyses3-15, enabled the discovery of new signatures, the separation of overlapping signatures and the decomposition of signatures into components that may represent associated-but distinct-DNA damage, repair and/or replication mechanisms. By estimating the contribution of each signature to the mutational catalogues of individual cancer genomes, we revealed associations of signatures to exogenous or endogenous exposures, as well as to defective DNA-maintenance processes. However, many signatures are of unknown cause. This analysis provides a systematic perspective on the repertoire of mutational processes that contribute to the development of human cancer.


Conflict of interest statement

G.G. receives research funds from IBM and Pharmacyclics and is an inventor on patent applications related to MuTect, ABSOLUTE, MutSig, MSMuTect and POLYSOLVER. All the other authors have no competing interests.

Figures

Fig. 1
Fig. 1. Mutation burdens of SBSs, DBSs and small indels  across PCAWG tumour types.
The numbers of cases of each tumour type are shown next to the labels. Each dot represents one tumour. Tumour types are ordered by the median numbers of single-base substitutions. Only tumour types with >20 samples are shown. AdenoCA, adenocarcinoma; BNHL, B-cell non-Hodgkin lymphoma; ChRCC, chromophobe renal cell carcinoma; CLL, chronic lymphocytic leukaemia; CNS, central nervous system; ColoRect, colorectal; Eso, oesophageal; GBM, glioblastoma; HCC, hepatocellular carcinoma; Medullo, medulloblastoma; MH, microhomology; MPN, myeloproliferative neoplasm; Osteosarc, osteosarcoma; Panc, pancreatic; PiloAstro, pilocytic astrocytoma; Prost; prostate; RCC, renal cell carcinoma; SCC, squamous cell carcinoma; TCC, transitional cell carcinoma; Thy, thyroid.
Fig. 2
Fig. 2. Profiles of SBS, DBS and small indel mutational signatures.
The classifications of each mutation type (SBS, 96 classes; DBS, 78 classes; and indels, 83 classes) are described in the main text. Magnified versions of signatures SBS4, DBS2 and ID3 (all of which are associated with tobacco smoking) are shown to illustrate the positions of each mutation subtype on each plot. The plotted data are available in digital form (along with the x axis labels) at syn12025148.
Fig. 3
Fig. 3. The number of mutations contributed by each mutational signature to the PCAWG tumours.
The size of each dot represents the proportion of samples of each tumour type that shows the mutational signature. The colour of each dot represents the median mutation burden of the signature in samples that show the signature. Tumours that had few mutations or that were poorly reconstructed by the signature assignment were excluded. The contributions of composite signatures to the PCAWG cancers, and SBS signatures to the complete set of cancer samples analysed, are shown in Extended Data Figs. 4 and 5, respectively. AML, acute myeloid leukaemia; liposarc, liposarcoma; MDS, myelodysplastic syndrome.
Fig. 4
Fig. 4. Illustrative examples of mutational spectra of individual cancer samples.
The contributory SBS, DBS and small indel mutational signatures in two tumours are shown.
Extended Data Fig. 1
Extended Data Fig. 1. Histogram of the number of signatures attributed in each of 2,780 PCAWG samples by SigProfiler and SignatureAnalyzer.
Hypermutated tumours and melanomas (156) are listed at syn11738314.
Extended Data Fig. 2
Extended Data Fig. 2. Comparisons between results of SigProfiler and SignatureAnalyzer.
a, b, Comparison of the attributions for corresponding SigProfiler (a) and SignatureAnalyzer (b) signatures. Each one of the SBS signatures extracted by SigProfiler and SignatureAnalyzer was paired with the signature of highest cosine similarity in the extraction by the other method (if one with >0.85 cosine similarity exists). The first column of the plot corresponds to the fraction of mutations assigned by one method (summed across samples and mutation types) that was also assigned by the other method. The remaining mutations were then redistributed to the other signatures in the extraction, weighted by their relative probabilities of having been generated by each signature and the resulting fraction of mutations was then plotted. Signatures on the x axis are shown only if they contribute at least a 0.1 fraction of mutations to at least one signature on the y axis. c, d, Cosine similarities between SigProfiler and SignatureAnalyzer DBS (c) and indel (d) signatures. Brown nodes represent SigProfiler signatures; green nodes represent SignatureAnalyzer signatures. Matches with cosine similarities > 0.8 are shown as edges; the width of the edge indicates the strength of the similarity. The locations of the nodes have no meaning. Signatures with no matches of >0.8 cosine similarity are shown below. SigProfiler ID15 and ID17 were extracted from data that were not analysed by SignatureAnalyzer. The suffix ‘P’ on a SignatureAnalyzer signature name indicates a signature extracted from non-hypermutated, non-melanoma tumours. The suffix ‘S’ on a SignatureAnalyzer signature name indicates a signature extracted from hypermutated or melanoma tumours.
Extended Data Fig. 3
Extended Data Fig. 3. SignatureAnalyzer reference signatures.
The classifications of each mutation type (SBS, 96 classes; DBS, 78 classes; and indels, 83 classes) are described in the main text.
Extended Data Fig. 4
Extended Data Fig. 4. The number of SBS mutations attributed to each mutational signature for each cancer type over the PCAWG tumours by SignatureAnalyzer.
Conventions are as in Fig. 3; see this figure for explanation.
Extended Data Fig. 5
Extended Data Fig. 5. The number of SBS mutations attributed to each mutational signature to each cancer type over the complete set of PCAWG and non-PCAWG cancer samples analysed by SigProfiler.
Conventions are as in Fig. 3; see this figure for explanation.
Extended Data Fig. 6
Extended Data Fig. 6. Associations between SBS, DBS and indel signature activities for SigProfiler and SignatureAnalyzer.
a, b, Each node represents an SBS (light green), DBS (dark green) or indel (black) signature. Any two signatures with sample attributions that significantly correlated with R2 > 0.3 (SigProfiler) (a) or > 0.5 (SignatureAnalyzer) (b) are connected by edges. Edge widths are proportional to the strength of the correlation. Signatures with no significant correlation to any other signature above the relevant threshold are not shown. Signature locations are fit for display purposes only, and do not indicate similarity.
Extended Data Fig. 7
Extended Data Fig. 7. Mutational signatures extracted from the COMPOSITE feature set consisting of the concatenation of SBSs in pentanucleotide context, DBSs and indels.
For each of the 4 COMPOSITE mutational signatures shown, the top panel shows the SBS signature in pentanucleotide context (1,536 mutation classes) after being collapsed to 96 SBS mutation classes, the middle panel is the co-extracted DBS signature and the bottom panel is the co-extracted indel signature. There are similarities between the DBS portion of Composite-4 and DBS2, and between the indel portion of Composite-4 and ID3; other similarities are noted in the figure.
Extended Data Fig. 8
Extended Data Fig. 8. SigProfiler signature extraction and attribution.
A full description is provided in Supplementary Note 2. a, Procedure for extracting (discovering) mutational signatures. Step A, apply the approach to a set of samples D; initially D contains all samples (that is, D = M). This step has previously been described in detail. Step B, solution evaluation and re-iteration. Extracted mutational signatures and their activities in individual samples are saved into a set (S). The activity of any signature that does not increase the cosine similarity of a sample by > 0.01 was removed from the sample (assigned a value of 0). Step A is repeated for all samples for which the identified signatures do not explain their patterns (cosine similarity < 0.95). The algorithm continues to step C when step A cannot find any stable signatures. Step C, clustering of mutational signatures. Hierarchical consensus clustering was applied to the set S to derive the consensus mutational signatures across the set of samples M. b, Attribution of activities of mutational signatures in samples.

Comment in

References

    1. Alexandrov, L. B. & Stratton, M. R. Mutational signatures: the patterns of somatic mutations hidden in cancer genomes. Curr. Opin. Genet. Dev. 24, 52–60 (2014). - PMC - PubMed
    1. The ICGC/TCGA Pan-Cancer Analysis of Whole Genomes Network. Pan-cancer analysis of whole genomes. Nature10.1038/s41586-020-1969-6 (2020).
    1. Nik-Zainal, S. et al. Mutational processes molding the genomes of 21 breast cancers. Cell149, 979–993 (2012). - PMC - PubMed
    1. Alexandrov, L. B. et al. Signatures of mutational processes in human cancer. Nature500, 415–421 (2013). - PMC - PubMed
    1. Poon, S. L. et al. Genome-wide mutational signatures of aristolochic acid and its application as a screening tool. Sci. Transl. Med. 5, 197ra101 (2013). - PubMed

Publication types