. 2020 Feb;578(7794):273-277.
doi: 10.1038/s41586-020-1984-7. Epub 2020 Feb 5.

Discriminating α-synuclein strains in Parkinson's disease and multiple system atrophy

Affiliations

Discriminating α-synuclein strains in Parkinson's disease and multiple system atrophy

Mohammad Shahnawaz et al. Nature. 2020 Feb.

Abstract

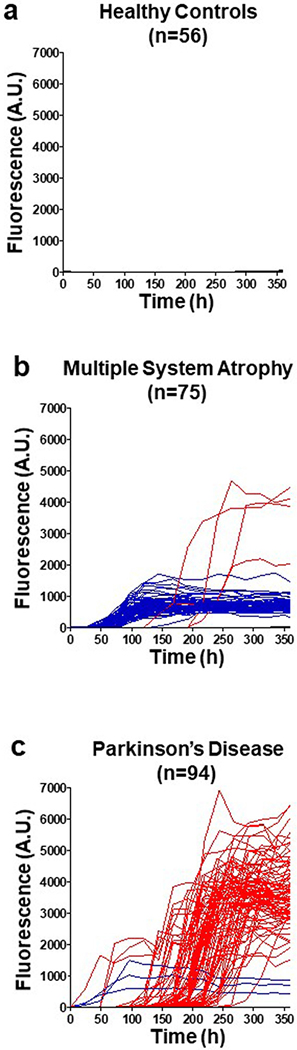
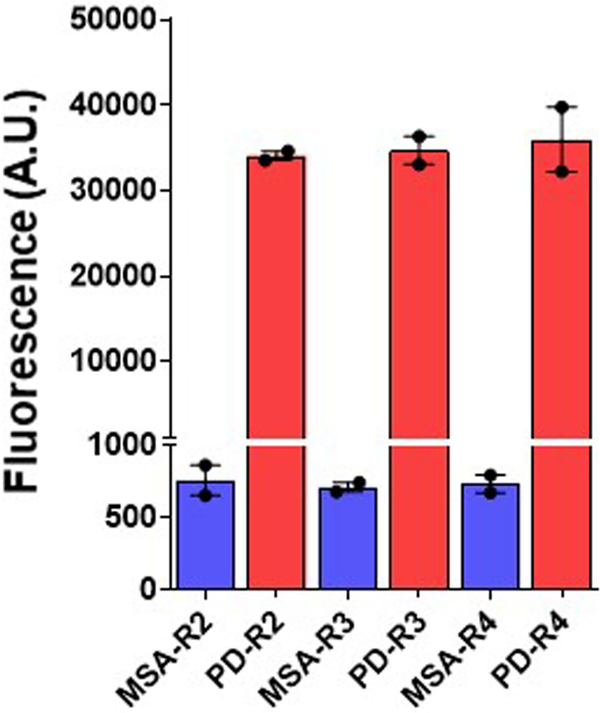
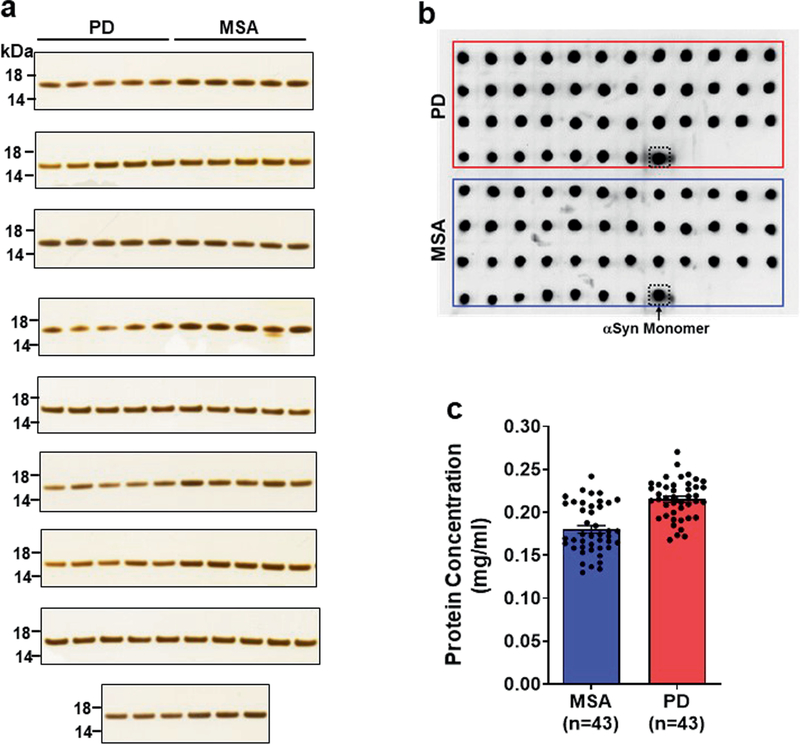
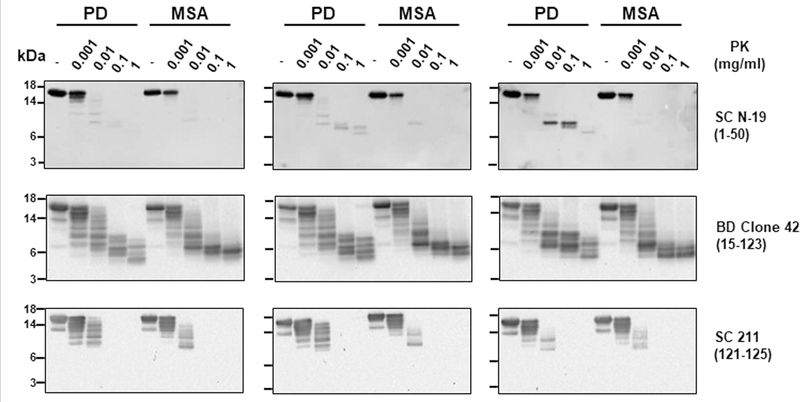
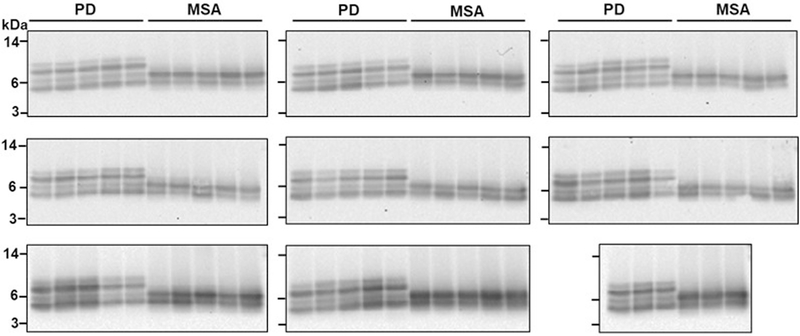
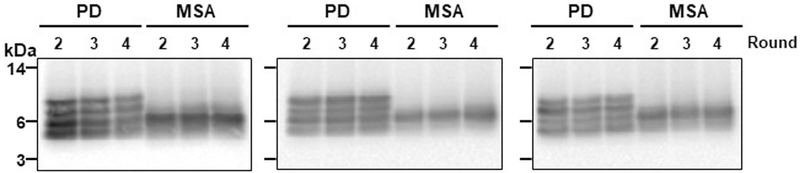
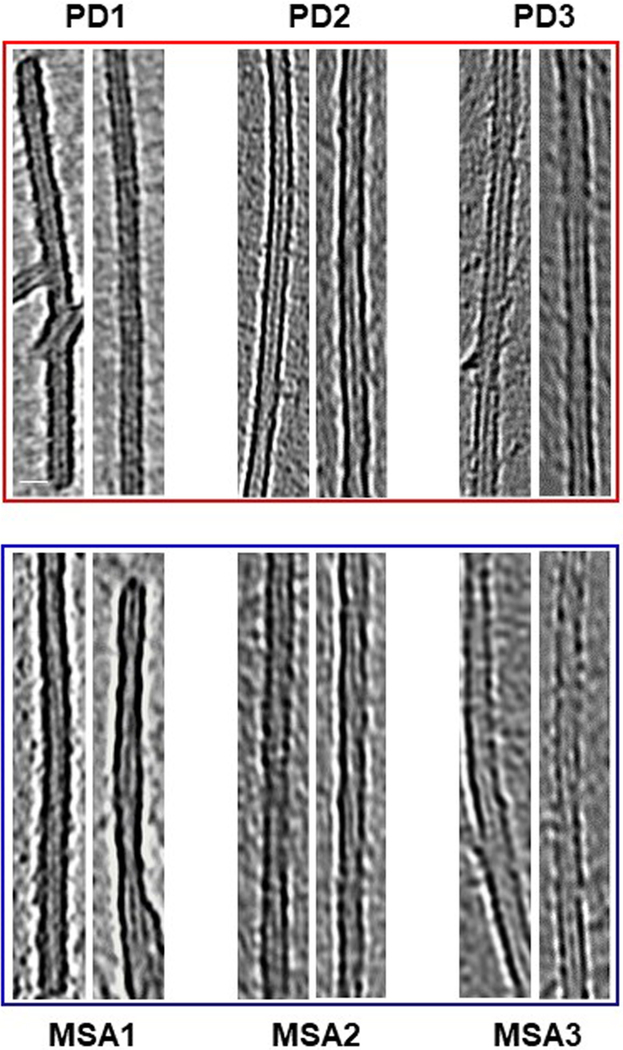
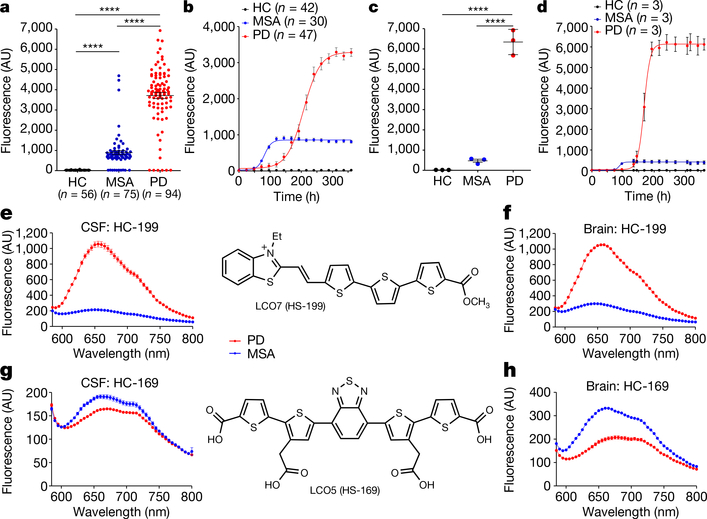
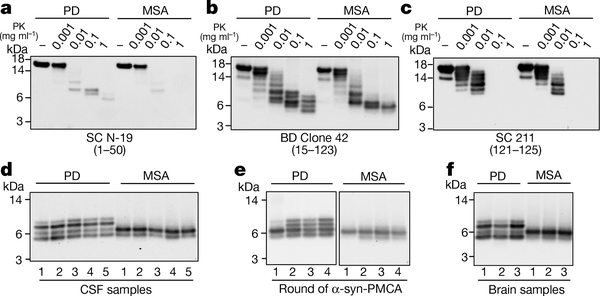
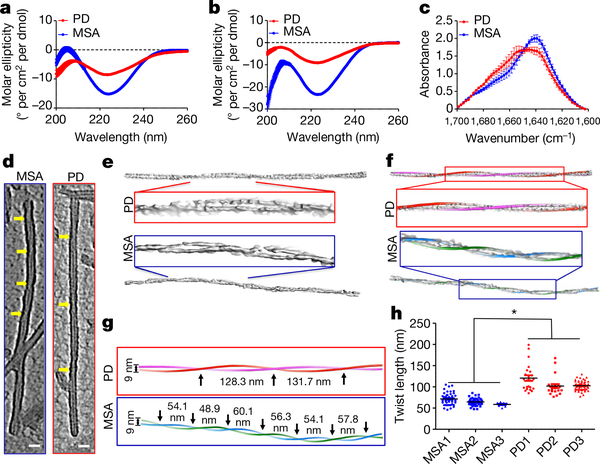
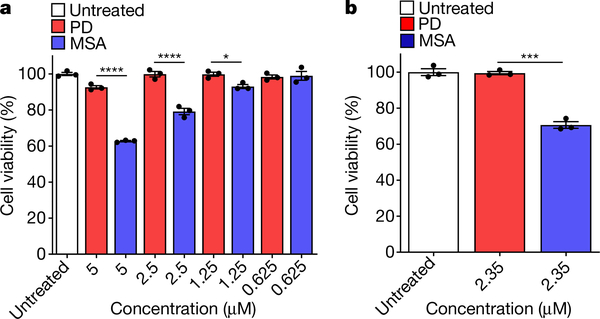
Synucleinopathies are neurodegenerative diseases that are associated with the misfolding and aggregation of α-synuclein, including Parkinson's disease, dementia with Lewy bodies and multiple system atrophy1. Clinically, it is challenging to differentiate Parkinson's disease and multiple system atrophy, especially at the early stages of disease2. Aggregates of α-synuclein in distinct synucleinopathies have been proposed to represent different conformational strains of α-synuclein that can self-propagate and spread from cell to cell3-6. Protein misfolding cyclic amplification (PMCA) is a technique that has previously been used to detect α-synuclein aggregates in samples of cerebrospinal fluid with high sensitivity and specificity7,8. Here we show that the α-synuclein-PMCA assay can discriminate between samples of cerebrospinal fluid from patients diagnosed with Parkinson's disease and samples from patients with multiple system atrophy, with an overall sensitivity of 95.4%. We used a combination of biochemical, biophysical and biological methods to analyse the product of α-synuclein-PMCA, and found that the characteristics of the α-synuclein aggregates in the cerebrospinal fluid could be used to readily distinguish between Parkinson's disease and multiple system atrophy. We also found that the properties of aggregates that were amplified from the cerebrospinal fluid were similar to those of aggregates that were amplified from the brain. These findings suggest that α-synuclein aggregates that are associated with Parkinson's disease and multiple system atrophy correspond to different conformational strains of α-synuclein, which can be amplified and detected by α-synuclein-PMCA. Our results may help to improve our understanding of the mechanism of α-synuclein misfolding and the structures of the aggregates that are implicated in different synucleinopathies, and may also enable the development of a biochemical assay to discriminate between Parkinson's disease and multiple system atrophy.


Conflict of interest statement

Competing interests C.S. and M.S. are inventors on patent applications (US20160077111, WO2016040905, EP3191599A1, US20160077112 and WO2016040907) for the use of PMCA technology for high-sensitive detection of α-syn aggregates in patients affected by synucleinopathies. These applications were filed by the University of Texas Health Science Center at Houston and Amprion Inc. C.S. is an inventor on several patents related to PMCA technology and is a Founder, Chief Scientific Officer and Member of the Board of Directors of Amprion Inc, a biotechnology company that focuses on the commercial use of PMCA (RT-QuIC) for high-sensitivity detection of misfolded protein aggregates that are implicated in a variety of neurodegenerative diseases. The University of Texas Health Science Center at Houston owns some patent applications related to the PMCA (RT-QuIC) technology that have been licensed to Amprion Inc.

Figures

Extended Data Fig. 1 |
Extended Data Fig. 1 |. Kinetics of α-syn aggregation in the presence of CSF from patients with PD, patients with MSA or healthy control individuals.
ac, Individual α-syn aggregation curves are shown in the presence of CSF samples (40 μl) from all study participants, including healthy controls (a; n = 56), patients with MSA (b; n = 75) and patients with PD (c; n = 94). The α-syn-PMCA assay was started by adding α-syn monomers (1 mg ml−1) and ThT (5 μM) to 100 mM PIPES, pH 6.5 containing 500 mM NaCl. The plate was incubated at 37 °C with intermittent shaking for 1 min every 30 min at 500 rpm. The extent of aggregation was monitored using a fluorometer to measure ThT fluorescence, with an excitation of 435 nm and emission of 485 nm. The colours represent the expected aggregation curves for patients with PD (red), patients with MSA (blue) and healthy controls (black), regardless of clinical diagnosis.
Extended Data Fig. 2 |
Extended Data Fig. 2 |. Serial propagation of α-syn aggregates derived from patients with MSA and patients with PD.
For serial propagation of α-syn aggregates, an aliquot of the final product of the first α-syn-PMCA reaction (starting from CSF samples) was diluted 100-fold into a solution containing fresh α-syn monomers (1 mg ml−1). A second round of amplification was done in the same buffer (100 mM PIPES, pH 6.5 containing 500 mM NaCl) at 37 °C with intermittent shaking for 1 min every 30 min at 500 rpm. The extent of aggregation was monitored by the increase in ThT fluorescence. The maximum fluorescence value at the plateau of aggregation was recorded and plotted in the graph as the second round of amplification (R2). Similarly, the third and fourth rounds of amplification (R3 and R4) were performed by diluting the product 100-fold on amplification each time into fresh α-syn monomer substrate and repeating the α-syn-PMCA assay. The results shown are from one patient with PD and one patient with MSA. The experiment was carried out in duplicate, each dot represents an individual technical replicate and data are mean ± s.e.m.
Extended Data Fig. 3 |
Extended Data Fig. 3 |. Analyses of the quantity of α-syn aggregates after amplification from patients with MSA and patients with PD by sedimentation assay.
Aggregates of α-syn that were obtained after two rounds of α-syn-PMCA amplification (starting from CSF samples from patients with MSA (n = 43) and patients with PD (n = 43)) were centrifuged at 20,000g for 30 min. a, The resultant pellets were separated on a 12% Bis-Tris gel, and protein bands were visualized by silver staining as per the manufacturer’s protocol. Molecular weight markers (kDa) are indicated on the left of the gel. b, Resuspended pellets (2 μl) were spotted onto nitrocellulose membranes and air-dried for 30 min at room temperature. After blocking with 5% w/v non-fat dry milk at room temperature for 2 h, membranes were probed with an anti-α-syn antibody (BD Bioscience, 1:2,000) and anti-rabbit HRP-conjugated secondary antibodies (1:5,000). The blots were visualized using enhanced chemiluminescence and a western blotting detection kit. The dot blot shows each of the 86 samples (n = 43, PD; n = 43, MSA) and a positive control using non-aggregated α-syn monomer (dotted box). The results are representative of two independent experiments with similar results. c, Protein concentration in the supernatants was determined by a BCA assay kit as per the manufacturer’s instructions. Each dot represents an individual sample (n = 43, PD; n = 43, MSA) in each disease group and data are mean ± s.e.m.
Extended Data Fig. 4 |
Extended Data Fig. 4 |. Proteinase K digestion profiles of α-syn aggregates derived from samples of CSF from patients with PD and patients with MSA.
This is the same experiment as Fig. 2a–c, showing proteinase K digestion profiles of other representative samples from patients with PD (n = 3) and patients with MSA (n = 3). The amplified product from the second round of α-syn-PMCA in samples of CSF from patients with MSA or patients with PD was incubated either without (−) or in the presence of increasing concentrations of proteinase K (0.001, 0.01, 0.1 and 1 mg ml−1) at 37 °C for 1 h. Proteins were separated on a 12% Bis-Tris gel and immunoblotted with the same antibodies as in Fig. 2 (SC N-19 (top), BD anti-α-syn clone 42 (middle) and SC 211 (bottom)). Each blot represents an individual sample. Molecular weight markers (kDa) are indicated on the left of the blot.
Extended Data Fig. 5 |
Extended Data Fig. 5 |. Proteinase K digestion profiles of α-syn aggregates derived from samples of CSF from all 43 patients with PD and 43 patients with MSA.
This is the same experiment as Fig. 2d, showing proteinase K digestion profiles of all 86 (n = 43, PD; n = 43, MSA) biologically independent samples analysed. Aliquots of the product of the second round of the α-syn-PMCA assay were treated with proteinase K (1 mg ml−1) at 37 °C for 1 h. Proteins were separated on a 12% Bis-Tris gel and immunoblotted with the BD anti-α-syn clone 42 antibody. Molecular weight markers (kDa) are indicated on the left of the blot. The third blot on the top row is the same as that shown in Fig. 2d.
Extended Data Fig. 6 |
Extended Data Fig. 6 |. Proteinase K digestion profiles of α-syn aggregates after several rounds of α-syn-PMCA.
This is the same experiment as Fig. 2e, showing the results obtained with samples from different patients with PD (n = 3) and patients with MSA (n = 3). The first round corresponds to direct amplification from the CSF of the patients. For the second round of amplification, aggregates produced in the first round were diluted 100-fold into fresh α-syn monomer substrate and a new round of α-syn-PMCA was performed. The assay was then repeated for the third and fourth rounds using amplified α-syn aggregates (1%) from the previous round. Amplified aggregates were treated with proteinase K (1 mg ml−1) for 1 h and proteins were separated on a 12% Bis-Tris gel and immunoblotted with the BD anti-α-syn clone 42 antibody. Molecular weight markers (kDa) are indicated on the left of the blot.
Extended Data Fig. 7 |
Extended Data Fig. 7 |. Electron microscopy images of PD-associated fibrils and MSA-associated fibrils.
Representative images of fibrils produced after two rounds of α-syn-PMCA in samples from different patients with PD (n = 3) and patients with MSA (n = 3). The negative-stained fibrils were imaged with a 300 kV electron microscope. Scale bar, 10 nm (applies to all of the images).
Extended Data Fig. 8 |
Extended Data Fig. 8 |. Reaction scheme for the chemical synthesis of HS-199.
HS-199 was synthesized by mixing 0.462 mM methyl 5′-bromo-[2,2′- bithiophene]-5-carboxylate with 0.508 mM (5-formylthiophen-2-yl)boronic acid, K2CO3 (1.39 mmol) in 1,4-dioxane/methanol (8: 2, 8 mL/mM, degassed) and PEPPS-IPr (2 mol %).
Fig. 1 |
Fig. 1 |. Differential interaction of amyloid-binding dyes with α-syn aggregates derived from patients with PD or patients with MSA.
a, b, Samples of CSF (40 μl) from patients with PD (PD), patients with MSA or healthy control individuals (HC) were subjected to α-syn-PMCA and the extent of aggregation was monitored by ThT fluorescence. a, Maximum fluorescence values (measured at plateau of aggregation) for PD (n = 94; red), MSA (n = 75; blue) and healthy controls (n = 56; black). Each dot represents an individual biological sample measured in duplicate and data are mean ± s.e.m. b, Representative aggregation curves of α-syn in the presence of CSF from patients with PD (n = 47), patients with MSA (n = 30) and healthy controls (n = 42). Data are mean ± s.e.m. of all patients analysed in each group. c, d, Frozen brain samples from patients with pathologically confirmed PD or MSA, or from healthy controls, were homogenized at 10% w/v. A 0.001% dilution of brain homogenate was used for the α-syn-PMCA reaction. c, Maximum fluorescence values for PD (n = 3), MSA (n = 3) and healthy controls (n = 3). Each dot represents an individual biological sample measured in duplicate and data are mean ± s.e.m. of three patients in each group. ****P < 0.0001 by one-way analysis of variance (ANOVA) followed by Tukey’s multiple comparison test (a, c). d, Aggregation profiles of α-syn in the presence of samples from the brain of patients with PD (n = 3), patients with MSA (n = 3) and healthy controls (n = 3). Data are mean ± s.e.m. of three patients in each group. eh, Differential binding of two amyloid-conformation-specific dyes (HS-199 and HS-169) to α-syn aggregates obtained after two rounds of α-syn-PMCA in samples from the CSF (e, g; n = 43) or the brain (f, h; n = 3) of different patients with PD or MSA. Excitation was at 540 nm and the emission spectrum was recorded between 580 and 800 nm. The chemical structures of HS-199 and HS-169 are also shown. Each experiment was performed in duplicate and data are mean ± s.e.m. (for many points the error bars are smaller than the symbols).
Fig. 2 |
Fig. 2 |. Protease resistance and epitope mapping of α-syn aggregates derived from the CSF or the brain of patients with PD or patients with MSA.
ac, α-Syn-PMCA products starting from samples of CSF from patients with MSA or patients with PD were incubated without (−) or in the presence of increasing concentrations of proteinase K (PK; 0.001, 0.01, 0.1 and 1 mg ml−1) at 37 °C for 1 h. Samples were subjected to western blotting using three different antibodies against α-syn: N-19 (Santa Cruz), which recognizes the N-terminal region (residues 1–50) of α-syn (a); anti-α-syn clone 42 (BD Biosciences), which is raised against the middle region of α-syn (residues 15–123) (b); and 211 (Santa Cruz), which is reactive against the C-terminal region of α-syn (residues 121–125) (c). Similar results were obtained for three other patients analysed per disease (Extended Data Fig. 4). d, Profiles of digested fragments from five patients in each group, developed with the BD clone 42 anti-α-syn antibody. The results for all of the PD (n = 43) and MSA (n = 43) samples analysed are shown in Extended Data Fig. 5. For the experiments in ad, we used the aggregates from the second round of amplification. e, Profile of proteinase- K-resistant fragments after serial rounds of α-syn-PMCA. The first round corresponds to direct amplification from the CSF. For the second round of amplification, aggregates produced in the first round were diluted 100-fold into fresh α-syn monomer substrate and a new round of α-syn-PMCA was performed. The assay was then repeated for the third and fourth rounds using amplified α-syn aggregates (1%) from the previous round. As before, amplified aggregates were treated with proteinase K (1 mg ml−1) and blots were developed with the BD clone 42 anti-α-syn antibody. f, Proteinase K resistance profiles of aggregates amplified from the brain of patients with neuropathologically confirmed PD (n = 3) or MSA (n = 3). Molecular weight markers (kDa) are indicated on the left of each blot.
Fig. 3 |
Fig. 3 |. Structural differences between α-syn aggregates derived from patients with PD or patients with MSA.
a, Circular dichroism spectra of α-syn aggregates from the CSF of patients with PD (red) or patients with MSA (blue), amplified by two rounds of α-syn-PMCA. Spectra were recorded from 35 μM suspensions of α-syn aggregates, as described in Methods. Measurements were taken for all of the PD (n = 43) and MSA (n = 43) samples analysed and data (molar ellipticity) are mean ± s.e.m. b, A similar experiment was performed for α-syn aggregates that were amplified from the brain of patients with PD (n = 3) or patients with MSA (n = 3). c, FTIR spectra of α-syn aggregates that were obtained after two rounds of seeding and amplification of samples of CSF from patients with PD (n = 10) or patients with MSA (n = 10). The solution of aggregated proteins (5 μl; 5 mg ml−1) was analysed with an FTIR-4100 spectrometer (JASCO). d, Cryo-ET was performed to evaluate structural differences between fibrils from patients with PD and fibrils from patients with MSA. Central slices of representative subtomograms of PD-associated fibrils and MSA-associated fibrils are shown. The negative-stained fibrils were imaged with a 300-kV electron microscope (Methods). Yellow arrows indicate twists in the filaments. Scale bar, 20 nm. e, Three-dimensional density maps segmented from the original tomograms. Boxed densities are magnified views. f, Three-dimensional helical models were built that overlapped with the corresponding densities of PD- and MSA-associated fibrils, including a magnification of the central region. g, Helical models showing the periodicity of twisting of PD- or MSA-associated fibrils. Black arrows indicate the twist in the 3D model of the filament. h, Quantification of the periodic spacing (in nm) in many different fibrils derived from samples from patients with PD (n = 3) or patients with MSA (n = 3) samples. Each dot corresponds to a different fibril and data are mean ± s.e.m. *P < 0.05 by one-way ANOVA followed by Tukey’s multiple comparison test.
Fig. 4 |
Fig. 4 |. Cytotoxicity of amplified α-syn aggregates from the CSF of patients with PD or patients with MSA.
a, b, RK13 cells (a) (10,000 cells), or neuronal precursor cells derived from human induced pluripotent stem cells generated as previously described (b) (5,000 cells), were plated in a 96-well plate. After 24 h, cells were treated for 24 h for RK13 cells and 48 h for neuronal precursor cells with different concentrations of amplified α-syn fibrils from samples of CSF from patients with MSA or patients with PD. Cell viability was determined by MTT assay. Experiments were carried out in triplicate, each dot represents an individual replicate and data are mean ± s.e.m. *P < 0.05, ***P < 0.001, ****P < 0.0001 by one-way ANOVA followed by Tukey’s multiple comparison test.

Comment in

References

    1. Goedert M, Jakes R & Spillantini MG The synucleinopathies: twenty years on. J. Parkinsons Dis 7, S51–S69 (2017). - PMC - PubMed
    1. Wenning GK et al. What clinical features are most useful to distinguish definite multiple system atrophy from Parkinson’s disease? J. Neurol. Neurosurg. Psychiatry 68, 434–440 (2000). - PMC - PubMed
    1. Melki R Role of different alpha-synuclein strains in synucleinopathies, similarities with other neurodegenerative diseases. J. Parkinsons Dis 5, 217–227 (2015). - PMC - PubMed
    1. Prusiner SB et al. Evidence for α-synuclein prions causing multiple system atrophy in humans with parkinsonism. Proc. Natl Acad. Sci. USA 112, E5308–E5317 (2015). - PMC - PubMed
    1. Peng C et al. Cellular milieu imparts distinct pathological α-synuclein strains in α-synucleinopathies. Nature 557, 558–563 (2018). - PMC - PubMed

MeSH terms