. 2020 Feb;578(7794):278-283.
doi: 10.1038/s41586-020-1971-z. Epub 2020 Feb 5.

Live-animal imaging of native haematopoietic stem and progenitor cells

Affiliations

Live-animal imaging of native haematopoietic stem and progenitor cells

Constantina Christodoulou et al. Nature. 2020 Feb.

Abstract

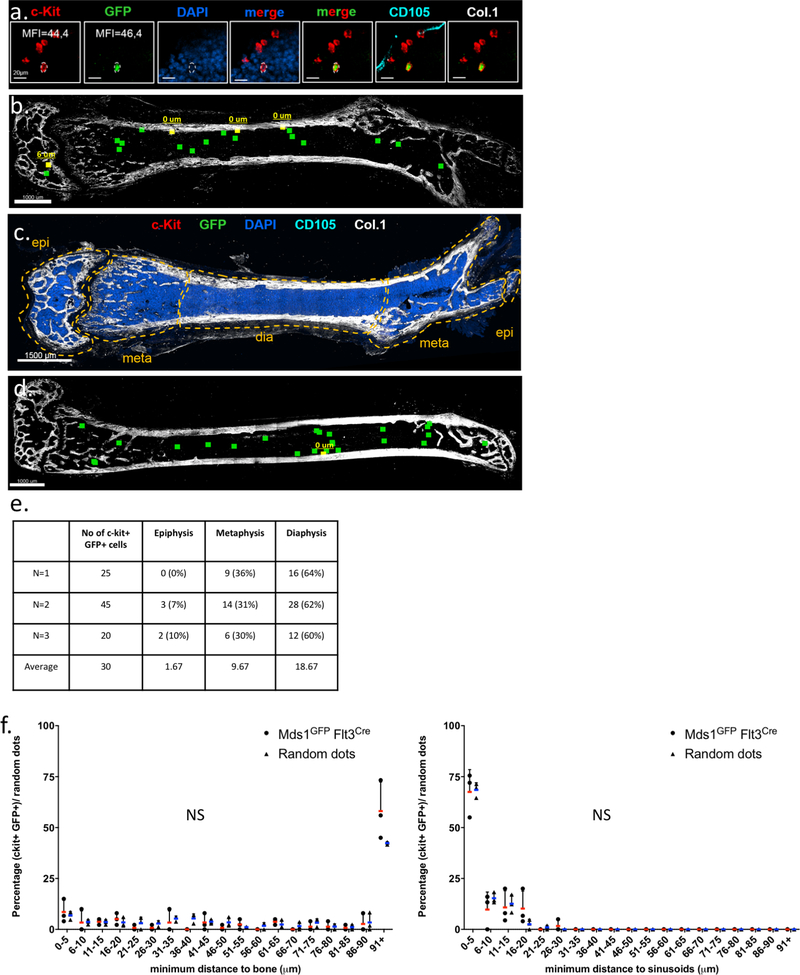
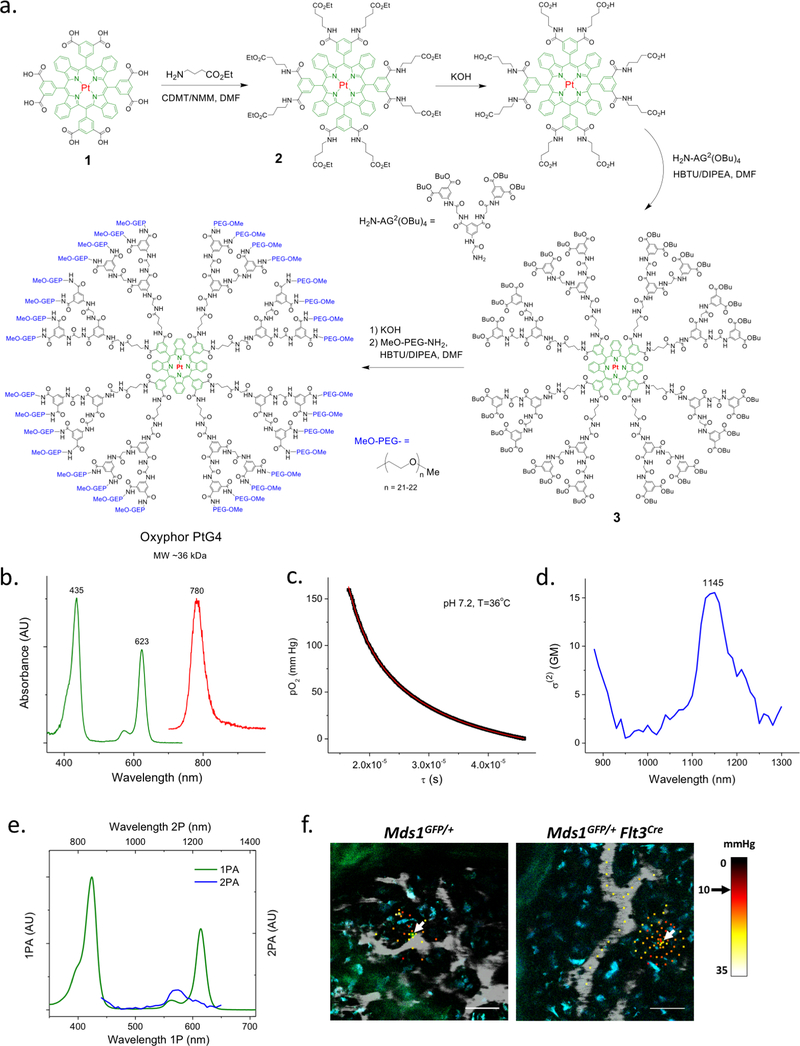
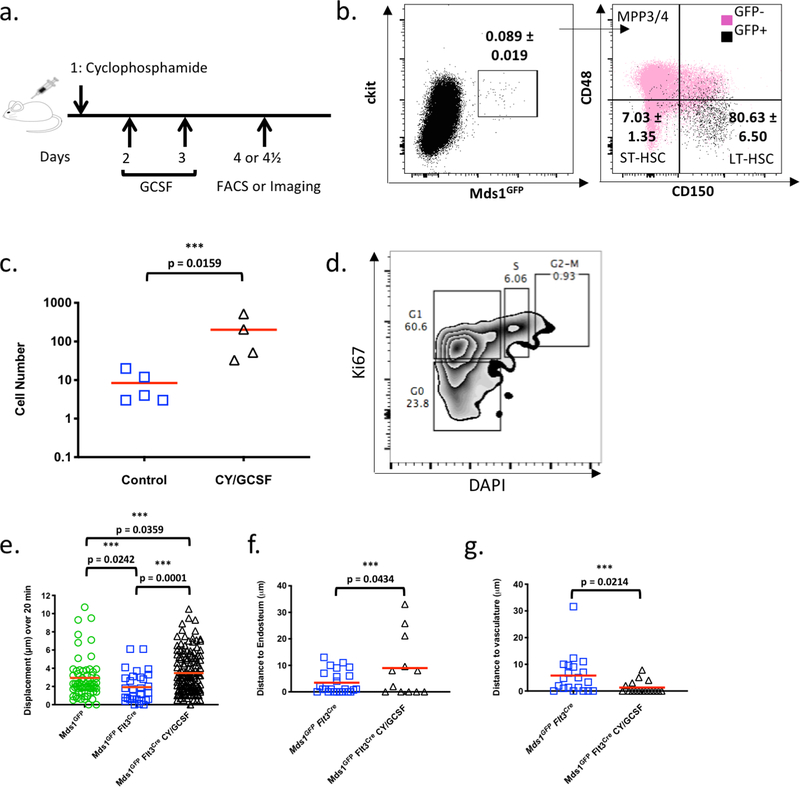
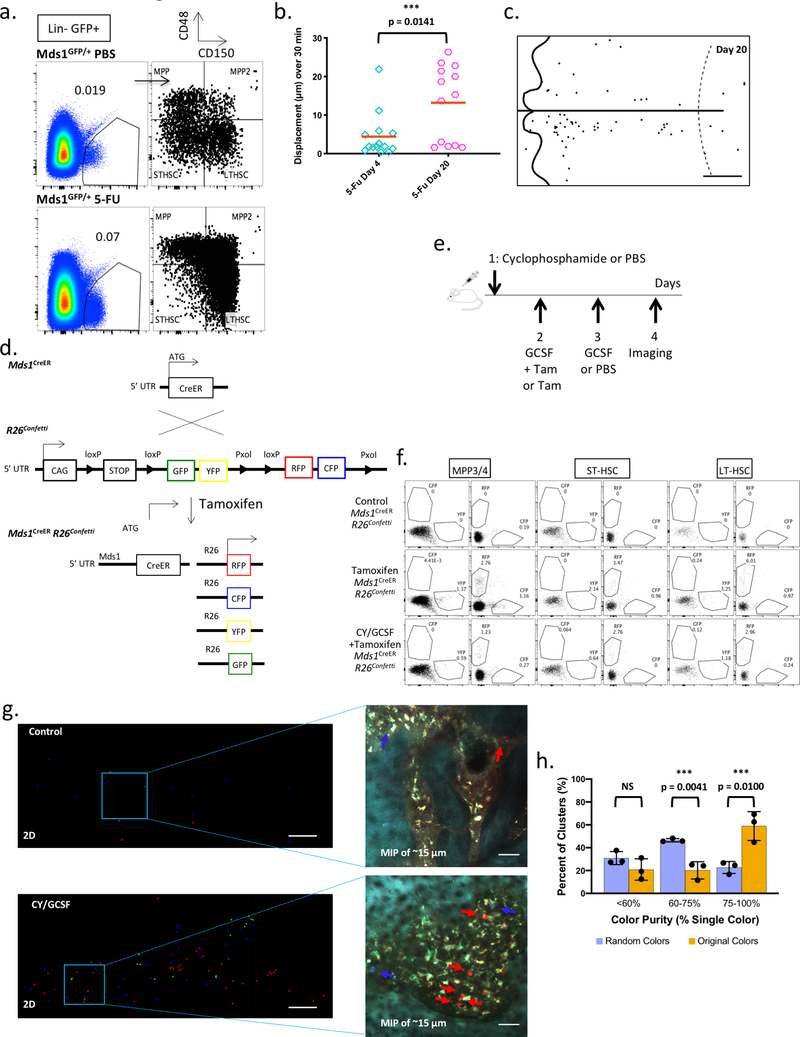
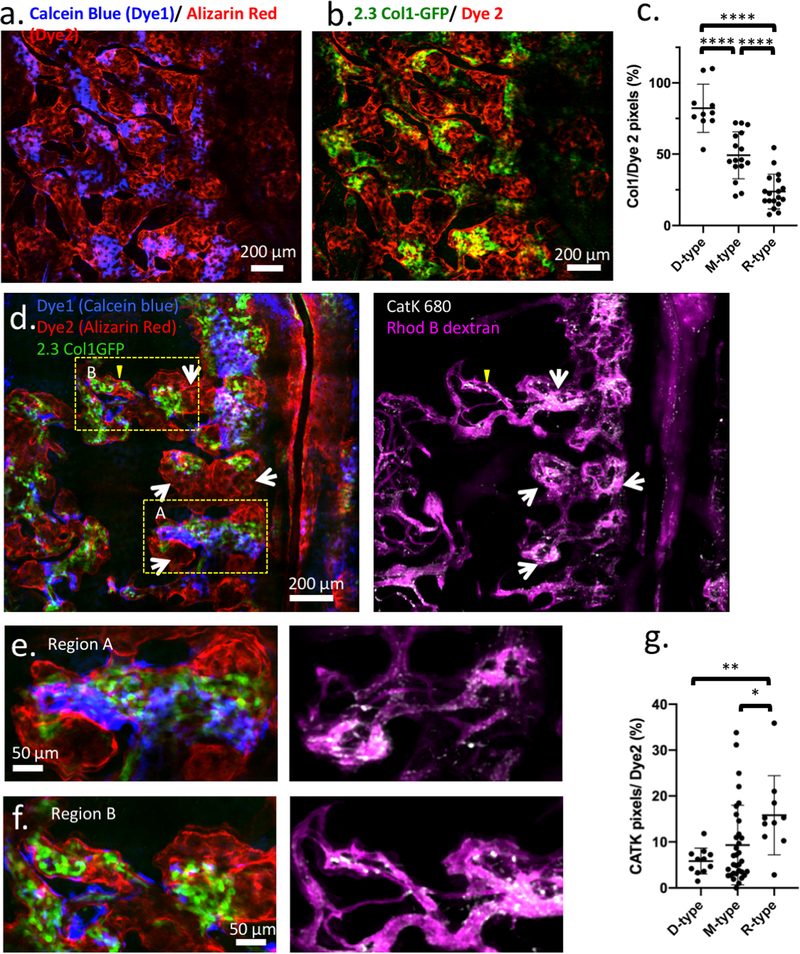
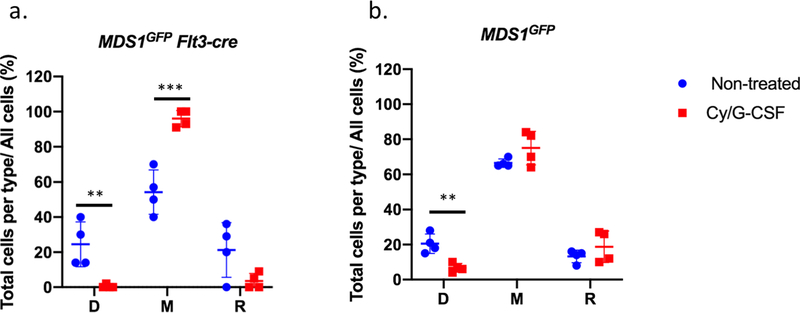
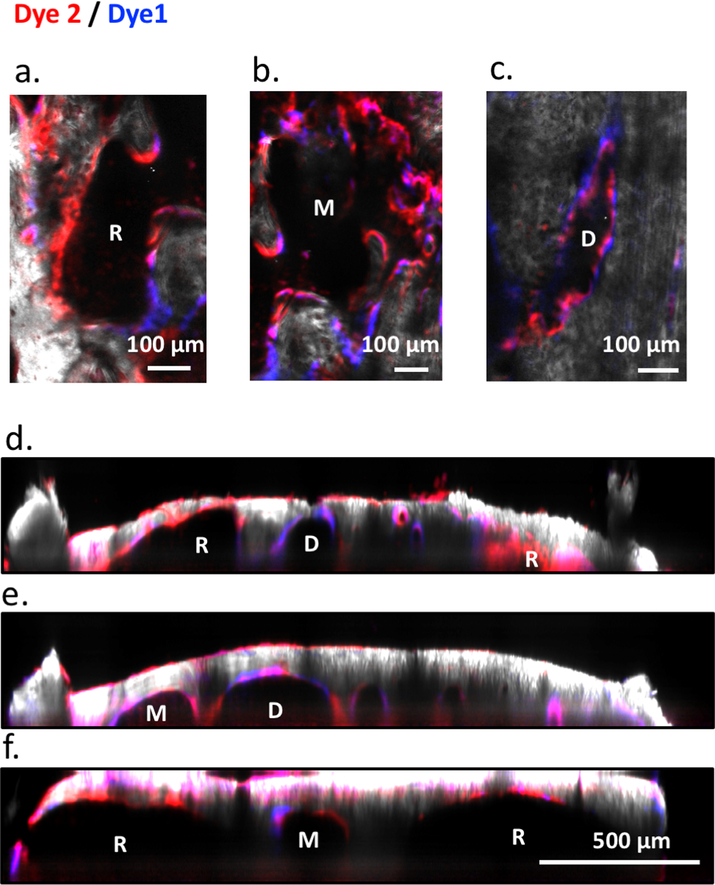
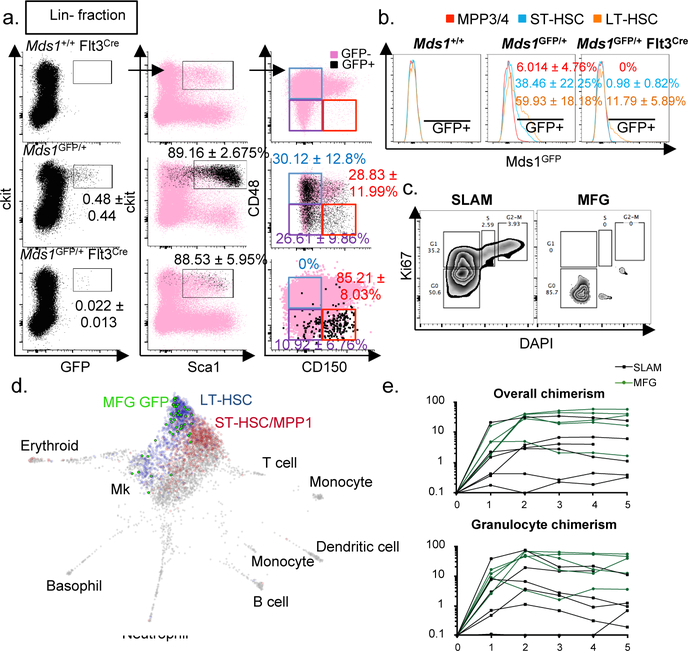
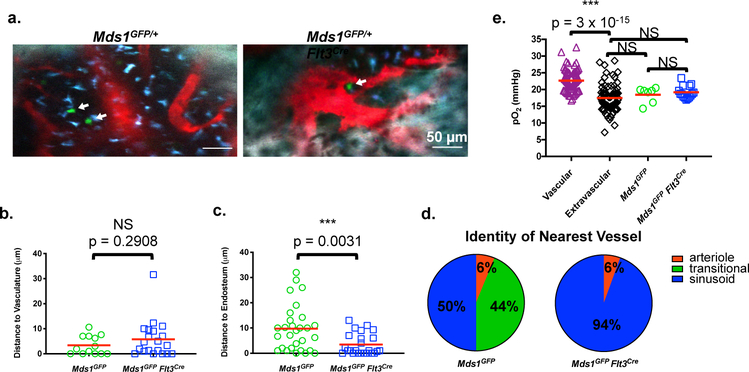
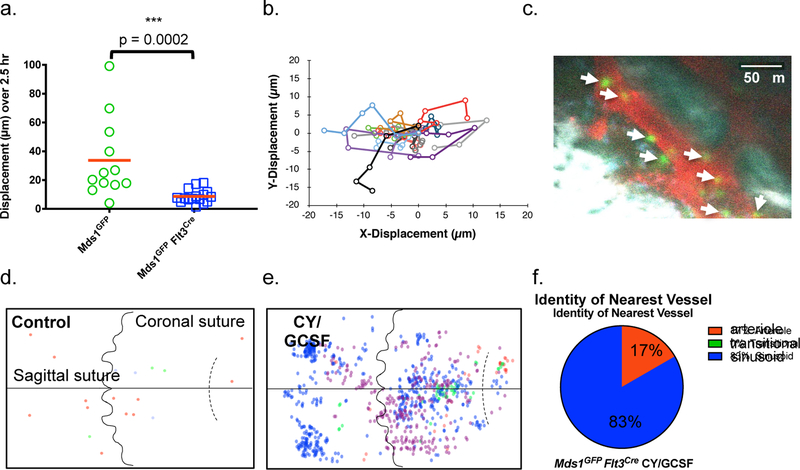
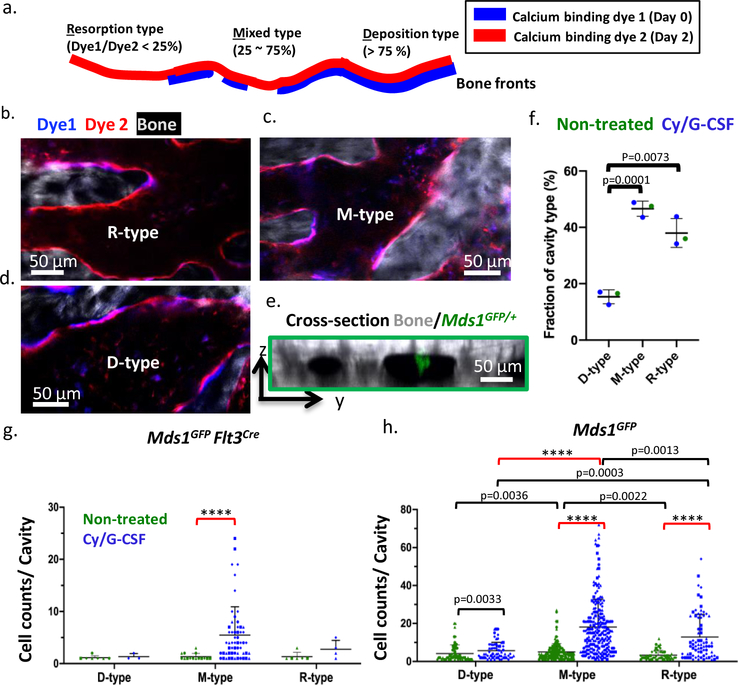
The biology of haematopoietic stem cells (HSCs) has predominantly been studied under transplantation conditions1,2. It has been particularly challenging to study dynamic HSC behaviour, given that the visualization of HSCs in the native niche in live animals has not, to our knowledge, been achieved. Here we describe a dual genetic strategy in mice that restricts reporter labelling to a subset of the most quiescent long-term HSCs (LT-HSCs) and that is compatible with current intravital imaging approaches in the calvarial bone marrow3-5. We show that this subset of LT-HSCs resides close to both sinusoidal blood vessels and the endosteal surface. By contrast, multipotent progenitor cells (MPPs) show greater variation in distance from the endosteum and are more likely to be associated with transition zone vessels. LT-HSCs are not found in bone marrow niches with the deepest hypoxia and instead are found in hypoxic environments similar to those of MPPs. In vivo time-lapse imaging revealed that LT-HSCs at steady-state show limited motility. Activated LT-HSCs show heterogeneous responses, with some cells becoming highly motile and a fraction of HSCs expanding clonally within spatially restricted domains. These domains have defined characteristics, as HSC expansion is found almost exclusively in a subset of bone marrow cavities with bone-remodelling activity. By contrast, cavities with low bone-resorbing activity do not harbour expanding HSCs. These findings point to previously unknown heterogeneity within the bone marrow microenvironment, imposed by the stages of bone turnover. Our approach enables the direct visualization of HSC behaviours and dissection of heterogeneity in HSC niches.


Conflict of interest statement

Competing interests

The authors declare no competing financial interests.

Figures

Extended Data Figure 1.
Extended Data Figure 1.. Characterization of HSPC (Mds1GFP/+) mice demonstrates normal hematopoiesis, HSC frequency, cell cycle and stimuli recovery response.
a, Targeting strategy for the generation of Mds1GFP//+ mice. b, 8–12 week old Mds1GFP/+ mice (triangles, N=9 mice) displayed similar bone marrow cellularity as control mice (Mds1+/+) (circles, N=7 mice). Middle line represents mean. Error bars demonstrate SD. c, 8–12 week old Mds1GFP/+ mice (N=14 mice) displayed similar peripheral blood parameters as Mds1+/+ control mice (N=11 mice). Middle line demonstrates mean. Error bars demonstrate SD. d, 8–12 week old Mds1GFP/+ mice (triangles, N=7 mice) displayed similar CD150+CD48-LSK (LT-HSC), CD150-CD48-LSK (ST-HSC) and CD150-CD48+LSK (MPP) frequencies as control (circles, Mds1+/+) mice (N=4 mice). Middle line represents mean. Error bars demonstrate SD. e, Cell cycle analysis of SLAM cells from Mds1GFP/+ (N=3 mice) and wild type (Mds1+/+) mice (N=2 mice) in native conditions. Indicated value per gate represents mean ± standard deviation. f, Dynamics of white blood cells (WBC), lymphocytes (LY) and red blood cells (RBC) recovery upon 5-fluorouracil treatment in Mds1GFP/+ and control (Mds1+/+) mice. Middle value represents mean. Error bars represent standard deviation. N=4 mice.
Extended Data Figure 2.
Extended Data Figure 2.. Flow cytometric analysis of Mds1GFP/+ expression.
a, GFP+ cells are not present in any mature cellular subpopulations. Green represents Mds1GFP/+ mice while red represents Mds1+/+ control mice. Data shown are from one representative experiment that was repeated three times. b, c, Mds1GFP/+ cells are not present in the CD45 negative bone marrow compartment nor in mesenchymal (Integrin-αV and PDGFRα) and endothelial (CD31 and VE-Cadherin) bone marrow niche components respectively. The experiment was performed one time. d, Flow cytometry analysis reveals an inverse correlation between Mds1-GFP expression and Flt3 staining in Lin-Sca+cKit+ cells. The experiment was performed two times with similar results.
Extended Data Figure 3.
Extended Data Figure 3.. Generation of the MFG (Mds1GFP/+ Flt3Cre) mice results in restriction of GFP expression to LT-HSCs.
a, Schematic of genetic strategy to restrict GFP expression to LT-HSC compartment. b, Bone marrow analysis of Flt3Cre R26LSL-Tom shows Flt3-Cre driven activity in compartments downstream of LT-HSCs. N=4 mice, Mean ± SD. c, Further characterization of the cKit+ Sca1- GFP+ cells from MFG mice. CD41+CD150+ represent pre-megakaryocyte cells. The experiment was performed two times with similar results. d, Flow characterization of MFG cell in marrow isolated from multiple bones. The experiment was performed three times with similar results. e, MFG HSCs are predominantly found within the CD34- Flt3- CD150+ BM fraction. The experiment was performed two times with similar results. f, MFG HSCs are predominantly found within the Sca-1 high EPCR+ BM fraction. The experiment was performed one time. g, Cell cycle analysis of SLAM cells that are either GFP+ or GFP- in MFG mice. Experiment represents data from three pulled mice.
Extended Data Figure 4.
Extended Data Figure 4.. Additional characterization of MFG HSCs.
a, b, InDrops single cell RNA-seq analysis of MFG+ cells in comparison to multiple populations of HSC and MPPs. MFG cells (46 cells) are predominantly found areas in which Mecom (purple, n=742 cells), but not Flt3 (orange, n=1111 cells) is expressed Teal=MPP2, Purple=MPP3, Light Green=MPP4, Grey=other cells, Bright Green=Mds1GFP/+ Flt3Cre cells. Gradient color demonstrates normalized read counts. Each dot represents an individual cell. MFG HSCs represent cells from a single mouse, the rest of the cells represent cells from a separate single mouse. c, d, Heatmaps and Spring plot map showing expression levels of previously published ‘dormant’ HSC genes in single cell RNAseq data from LTHSC and MFG cell populations. For the spring plot analysis: MFG=46 cells and CD34=2380 cells (teal), each dot represents an individual cell. MFG HSCs represent cells from a single mouse, the rest of the cells represent cells from a separate single mouse. e, Single-cell transcriptional fluidigm profile of MFG-HSCs demonstrates that they cluster together with SLAM cells. f, Summary of transplants with either 3, 7, and 15 MFG or SLAM HSCs together with 100,000 bone marrow cells, analyzed at 4 months post-transplant. HSC frequencies were calculated using ELDA software (see materials and methods). g, Engraftment analysis following secondary transplantations using whole bone marrow of one primary recipient of 25-cell MFG+ HSCs. Experiment shown is representative out of three independently performed experiments. h, Percentage chimerism at 4, 8, 12, 16 and 20 weeks in primary recipients transplanted with 25 SLAM cells sorted on the basis of GFP expression isolated from Mds1GFP/+ Flt3Cre mice (N=12 GFP- mice, N=5 GFP+ mice). Our data demonstrate that GFP+ cells within the SLAM compartment are more functionally enriched. Each line represents an individual mouse.
Extended Data Figure 5.
Extended Data Figure 5.. Multicolor quantitative deep-tissue confocal imaging of complete femoral sections from MFG (Mds1GFP/+ Flt3Cre) mice.
a, Identification of cKit+ GFP+ MFG-HSCs using multicolor quantitative deep-tissue confocal imaging of full bone femoral sections. Pictures are 10 μm xy projections of one area of interest. (N=3 mice). The experiment was performed three times with similar data. b, Example of one full-bone femur section with color-coded visualization of HSCs based on their distance to bone. Yellow squares represent individual HSCs in proximity to cortical or trabecular bone, whereas green dots represent individual HSCs located more than 10 μm away. The picture represents data from an individual mouse. The experiment was performed three times with similar data (refer to panel d). c, Example of full-bone femoral section (only Col.1 and DAPI staining is shown). The experiment was performed three times with similar data. d, Color-coded visualization of HSCs based on their distance to bone. Yellow squares represent individual HSCs in proximity to cortical or trabecular bone, whereas green dots represent individual HSCs located more than 10 μm away. This picture represents an independent mouse from ext. fig 5b. The experiment was performed three times with similar data. e, Quantification of absolute number and anatomical location of c-Kit+ GFP+ MFG-HSCs per individual experiment. (N=3 mice) f, Spatial distribution of HSCs (circles) and random dots (triangles) relative to Col.1 marking bone surfaces and CD105+ vasculature (sinusoids) (N=3 mice). P values were calculated using two-tailed Kolmogorov–Smirnov (distance distributions, upper panel P=0.1516, lower panel P>0.9999) and one-tailed Mann-Whitney (first bin of histograms, upper panel, HSCs: 8.56±5.74, RDs: 6.88±1.94, P=0.50, lower panel, HSCs: 67.52±10.99, RDs: 68.53±3.51, P=0.35) tests. Data points with mean value represented by line (red for HSCs, blue for random dots) and error bars representing standard deviation are shown. N.S., not significant. Epi: epiphysis, meta: metaphysis, dia: diaphysis.
Extended Data Figure 6.
Extended Data Figure 6.. Synthesis, structure and characterization of phosphorescent probe Oxyphor PtG4.
The structure of Oxyphor PtG4 is almost identical to that of the previously published probe Oxyphor PdG4 [1], but contains Pt, instead of Pd, at the core of the porphyrin (1: Pt tetra-meso-3,5-dicarboxyphenyl-tetrabenzoporphyrin). a, Synthesis of Oxyphor PtG4. First, eight carboxyl groups on the porphyrin 1 were amended with 4-amino-ethylbutyrate linkers. Upon hydrolysis of the terminal esters in the resulting porphyrin 2, eight aryl-glycine dendrons (H2N-AG(OBu)4) were coupled to the resulting porphyrin-octacarboxylic acid, giving dendrimer 3. The butyl esters on the latter were hydrolyzed under mild basic conditions, and the resulting free carboxylic acid groups were amidated with mono-methoxypolyethyleneglycol amine (MeO-PEG-NH2, Av MW 1000), giving the target probe Oxyphor PtG4. MALDI-TOF (m/z) was used to confirm the identity of the intermediate products as well as of the target probe molecule. Structure 2 (C116H124N12O24Pt, calculated at MW 2263.85) was found 2264.48 [M]+; structure 3 (C468H540N60O120Pt, calculated at MW 9114.76) was found at 9115.68 [M+H]+ and Oxyphor PtG4 (C1780H3196N92O792Pt, calculated at MW 40538) was found at 35952. For Oxyphor PtG4 we identified an additional peak at MW 66123.6 which is likely due to the presence of dimeric species formed during the ionization process. b, Linear (one photon) absorption (green) and emission spectra (red) of PtG4 in 50 mM phosphate buffer solution (pH 7.2, λex=623 nm. Photophysical constants in PBS, 22oC: e(623)~90,000 M−1cm−1 (molar extinction coefficient), φphos(deox)~0.07 (phosphorescence quantum yield in deoxygenated solution), τair=16μs (phosphorescence decay time on air), tdeox=47ms (phosphorescence decay time in deoxygenated solution). c, Phosphorescence oxygen quenching plot of Oxyphor PtG4. The calibration was performed as previously described [1]. The experimental points were fitted to an arbitrary double-exponential form and thus obtained parametric equation was used to convert the phosphorescence lifetimes obtained in in vivo experiments to pO2 values. d, Two-photon absorption spectrum of PtG4 in deoxygenated dimethylacetamide (DMA, 22oC). e, Arbitrarily scaled one- (green line) and two-photon (blue line) absorption spectra of PtG4. The two-photon absorption (2PA) spectra of PtG4 and of the reference compounds were measured by the relative phosphorescence method, as previously described [2]. The laser source was a Ti:Sapphire oscillator (80 MHz rep. rate) with tunability range of 680–1300 nm (Insight Deep See, Spectra Physics). All optical spectroscopic experiments and oxygen titrations were performed at least three times, giving highly reproducible results. f, Representative intravital images of an HSPC (green, left image), MFG-HSC (green, right image), vasculature (gray, Rhodamine-B-dextran 70 kDa), and autofluorescence (blue) overlaid with localized oxygenation measurements. White arrows point at GFP cells. Black arrow points to color representing 10 mmHg. Colored squares represent individual localized oxygen measurement areas. Images represent data from two independent experiments for each mouse model. Scale bars ~50 μm. [1] Esipova, T. V. et al. Two new “protected” oxyphors for biological oximetry: properties and application in tumor imaging. Anal. Chem. 83, 8756–8765, doi:10.1021/ac2022234 (2011). [2] Esipova, T. V., Rivera-Jacquez, H. J., Weber, B., Masunov, A. E. & Vinogradov, S. A. Two-photon absorbing phosphorescent metalloporphyrins: effects of p-extension and peripheral substitution. J. Am. Chem. Soc. 138, 15648–15662, doi:10.1021/jacs.6b09157 (2016).
Extended Data Figure 7.
Extended Data Figure 7.. Increased motility and expansion of activated MFG-HSCs.
a, Schematic illustration of protocol for activating bone marrow HSC using Cyclophosphamide (Cy) and GCSF. b, Flow cytometry analysis of Cy/GCSF-treated MFG mice (N=3 mice). Data show Lineage- cells. Mean ± SD. c, Number of GFP+ cell identified per calvaria in untreated and Cy/GCSF-treated Mds1GFP/+ Flt3Cre mice (N=5 and 4 mice respectively). Red bars indicate the mean. P value was calculated using a two-tailed Mann-Whitney test. d, Cell cycle analysis of MFG+ cells from Cy/GCSF treated mice. 3 mice were pulled together to acquire the displayed data. e, Graph showing in vivo motility measurements of HSPCs (n=66 cells) and MFG-HSCs (n=30 cells) at steady-state and activated MFG HSCs (n=142 cells) in the calvaria. Red bars indicate the mean. P values were calculated using two-tailed Mann-Whitney tests. f, g, Distance of MFG+ cells to the endosteum (n = 24 and 12 cells for untreated and Cy/GCSF treated, respectively) and to the nearest vessel (n = 20 and 17 cells for untreated and Cy/GCSF treated, respectively), after treatment with Cy/GCSF. Red bars indicate the mean. P values were calculated using two-tailed unpaired T tests.
Extended Data Figure 8.
Extended Data Figure 8.. Characterization of MFG HSCs upon activation.
a, Bone marrow analysis of HSPC (Mds1GFP/+) PBS control (N=1 mouse) and HSPC (Mds1GFP/+) 5-FU treated mice (N=2 mice, value represents mean), 17 days after treatment, demonstrates dramatic expansion of HSPCs even after recovery of blood (Extended data figure 1e). b, Graph showing in vivo motility measurements of MFG-HSCs at day 4 (n=14 cells) and day 20 (n=13 cells) after 5-FU treatment. Red bar represents mean. Compare to untreated Mds1GFP/+ Flt3Cre mice in Figure 3a and Extended data figure 7e. P value was calculated using a two-tailed Mann-Whitney test. c, Representative graphical map of the location of MFG-HSCs in the calvaria on day 20 after 5-FU treatment (N=2 mice). Scale bar ~500 μm. d, Generation of Mds1CreER/+ Rosa26Confetti/+ mice. e, Schematic illustration of Cyclophosphamide / GCSF treatment protocol for multi-colored Mds1CreER/+ Rosa26Confetti/+ labeling and activation. Low tamoxifen dosage (2 mg) was used to restrict recombination and expression of fluorescence in LT-HSCs that express higher Mds1 levels. f, Detailed flow cytometry analysis of MPP3/4, STHSC and LT-HSC differential color labeling upon treatment of Mds1CreER/+ Rosa26Confetti/+ mice shows enriched but not fully restricted labelling to LTHSCs. The experiment was performed one time. g, 2D graphical map of the 3D location of activated and labeled HSPCs in the fixed calvaria of control (left top, Tamoxifen only, N=2 mice) and induced (left bottom, Tamoxifen + Cy/GCSF, N=3 mice) mice along with maximum intensity projection (MIP) images (right top and bottom) of the Mds1 labeled cells (red, green, and blue). Scale bar for graphical map and MIP images ~200 μm and 50 μm, respectively. h, Graph showing the color purity of cell clusters (original colors) compared to randomized colors (10,000 cycles) in 3 independent experiments (N=3 mice). P values were calculated using two-tailed unpaired T tests. Bar graphs with error bars represent mean and SD, respectively.
Extended Data Figure 9.
Extended Data Figure 9.. Validating bone cavity types using 2.3Col1-GFP (mature osteoblasts) and Cathepsin K activated fluorescent agent (osteoclast)
a, A montage of multiple z-stacks, displayed as the maximum intensity projection, showing the double staining of bone marrow cavities in the calvarium. b, The same area as in extended data figure 9a, showing the locations of 2.3Col1-GFP osteoblasts in areas of the old bone front that has not been eroded (N=3 mice). c, Quantification of 2.3Col1-GFP pixels in D (n = 10 regions), M (n= 16 regions), R (n=18 regions) cavity types. Black line represents mean, error bars represent SD. d, A montage of multiple z-stacks, displayed as the maximum intensity projection, showing the double staining pattern (blue and red), 2.3Col1-GFP cells (green), osteoclasts (white), and bone marrow vasculature (purple). White arrows point to osteoclast clusters. (N=3 mice) e, A zoomed in region from extended figure 9d (box A), showing correlation between 2.3Col1-GFP cells and the remaining Dye1 (blue) in a D-type cavity, and abundant Cathepsin K+ osteoclasts present in the R-type region where Dye1 was eroded. f, Examples of a M-type region from extended figure 9d (box B). In this region, Dye1 was eroded to some extent in spite of abundant 2.3Col1-GFP cells present in the cavity. The corresponding Cathepsin K panel shows co-existence of several cathepsin K+ osteoclasts. g, Quantification of Cathepsin K+ pixels in D (n= 11 regions), M (n= 33 regions), and R-type (n=10 regions) cavities based on maximum intensity projection of montaged z-stacks. Compared to extended figure 9c, Cathepsin K coverage shows a larger spread because it does not stain the cell body uniformly. Instead it frequently shows a punctate staining pattern, likely indicative of the lysosomes/endosomes. (*p < 0.0189; **p = 0.0015,****p< 0.0001 Two-sided Mann-Whitney test. Black line represents mean, error bars represent SD.)
Extended Data Figure 10.
Extended Data Figure 10.. Cell distribution before and after treatment (N=4 mice per group).
Graphs show the fractions of MDS or MFG cells distributed in D-M-R-type cavities at the steady state and after Cy/GCSF treatment. The fraction is calculated by the total cells found in each cavity type divided by the total cells found in the calvaria of that mouse. a, The fractions of MFG cells in M-type increased while decreased in the D type after G/CSF treatment. Bars represent mean and standard deviation. (Non-treated groups: 24.5 ± 12.8; 54.3 ± 12.6; 21.3 ± 15.6 in D, M, R-type cavities, respectively. Treated group: 0.5 ± 1.0; 96.0 ± 4.7; 3.5 ± 4.4 in D, M, R-type cavities, respectively) **p= 0.0096; *** p= 0.0008. b, The fractions of cells found in the D-type cavity decreases while remained in M and R-type cavities. Bars represent mean and standard deviation. (Non-treated groups: 20.5 ± 5.6; 66.5 ± 2.4; 13.3 ± 3.6 in D, M, R-type cavities, respectively. Treated group: 6.8 ± 2.5; 75.0 ± 9.6; 18.8 ± 8.9 in D, M, R-type cavities, respectively) (**p=0.004). Unpaired, two-tailed t-test was used for statistical analysis.
Extended Data Figure 11.
Extended Data Figure 11.. Heterogeneous bone remodeling in the bone marrow cavities of tibia metaphysis.
A mechanically thinned metaphysis was imaged from the bone surface, labeled by sequential calcium staining. (a-c) En face views of D-, M-, and R-type cavities from tibia metaphysis. (d-f) The x-z cross-section views from annotated white lines in the video 15 demonstrate bone marrow cavities of varied remodeling stages similar to mouse calvaria.
Figure 1.
Figure 1.. Generation and characterization of Mds1GFP/+ Flt3Cre (MFG) mice.
a, b, Flow cytometric analysis of Mds1GFP/+ only (N=10 mice) and Mds1GFP/+ Flt3-Cre (N=13 mice), mean ± SD. c, Cell cycle analysis of GFP+ cells from MFG mice vs. HSCs isolated based on SLAM immunophenotype. Representative analysis shown, depicting data from multiple mice (MFG=7 mice) or (SLAM=2 mice) which were pulled together to acquire the displayed data. d, SPRING plot layout of transcriptomes of 50 single MFG+ HSCs projected in published scRNA dataset of HSCs and MPPs (from Rodriguez-Fraticelli et al). Blue=LT-HSCs (789 cells), Red=ST-HCSs (742 cells), Grey=other cells, Bright Green=MGF HSCs (46 cells). e, Overall and granulocyte chimaerism post-transplantation in primary lethally-irradiated recipients transplanted with 25 MFG+ or SLAM cells from Mds1GFP/+ Flt3Cre mice. Each line represents an individual mouse. N=6 mice for SLAM group, N=5 mice for MFG sorted group. Only engrafted mice are represented.
Figure 2.
Figure 2.. Steady-state localization and oxygen levels around MFG-HSCs and HSPCs.
a, Representative intravital images of HSPCs (left image, N=8 mice) and an MFG-HSC (right image, N=10 mice) in the calvaria of Mds1GFP/+ and Mds1GFP/+ Flt3Cre mice, respectively. GFP cells (white arrows) are shown in green, vasculature (Angiosense 680EX) in red, auto-fluorescence in blue, and bone (second harmonic generation) in white. Scale bars ~50 μm. b, c, Distance of each HSPC (n=13 and 29 cells from 3 and 4 mice for b and c, respectively) and MFG-HSC (n=20 and 24 cells from 6 and 8 mice for b and c, respectively) to the nearest vessel and endosteal surface are displayed, respectively. P values were calculated using two-tailed unpaired T tests. Red bar represents mean. d, Identity of nearest vessel for each HSPC (n=16 cells) and MFG-HSC (n=18 cells). e, Graph of in vivo oxygen measurements around individual HSPCs (N=2 mice, 7 cells) and MFG-HSCs (N=2 mice, 15 cells). P values were calculated using two-tailed unpaired T tests. Red bar represents mean.
Figure 3.
Figure 3.. Increased motility, expansion, and localization of activated MFG-HSC s.
a, In vivo motility measurements of HSPCs (n=12 cells) and MFG-HSCs (n=16 cells) at steady-state over a 2.5 hr imaging period. Red bars indicate the mean. P value was calculated using a two-tailed Mann-Whitney test. b, Cell tracks for 16 MFG-HSCs over a 2.5 hr imaging period. Images were acquired every 30 minutes. c, Representative intravital image of a Cy/GCSF treated MFG mouse 4.5 days after the beginning of treatment. MFG cells (green), vasculature (red, Angiosense 680EX), auto-fluorescence (blue), and bone (white, second harmonic generation). Scale bar ~50 μm. Arrows point at GFP cells. The experiment was performed four times with similar results. d, e, Graphical map of the location of MFG-HSCs in the calvaria of untreated and Cy/GCSF treated mice (N=3 and 4, respectively). Location data from individual mice are indicated by different colors. f, Identity of nearest vessel for each MFG+ cell (n=12 cells) after treatment with Cy/ GCSF. Compare to untreated mice in Figure 2d.
Figure 4.
Figure 4.. Heterogeneity of bone remodelling stages governs proliferation of MFG-HSCs (Mds1GFP/+ Flt3Cre mice) and HSPCs (Mds1GFP/+ mice).
a, The double calcium staining strategy that identifies D, M, and R- type cavities. Dye 1, delivered 48 hours before imaging, shows the old bone front that has been eroded to varying extent, while Dye 2 delivered before imaging shows the new bone front. b-d, zoomed in regions, showing distinct cavity types defined by the Dye1 to Dye2 pixel ratios. e, A sagittal section of bone marrow cavities containing Mds1GFP/+ cells. f, Fractions of D, M, R-type cavities in the calvaria of non-treated or treated mice (two-tailed t-test, n=155 cavities from non-treated and 80, 73 bone marrow cavities from treated animals (N=3 mice), black line represents mean, error bars represent SD). g, Quantification of MFG-HSCs in D-, M-, or R-type cavities at steady-state and after Cy/G-CSF activation. N=4 mice per group, plotted as different symbols. Black line represents mean, error bars represent SD. h, Quantification of HSPCs in D-, M-, or R-type cavities at steady-state and after Cy/G-CSF activation. N=4 mice per group, plotted as different symbols. Two-sided Mann-Whitney test was used in all graphs unless otherwise specified, ****p<0.0001. Black line represents mean, error bars represent SD.

Comment in

References

    1. Sun J et al. Clonal dynamics of native haematopoiesis. Nature 514, 322–327, doi:10.1038/nature13824 (2014). - DOI - PMC - PubMed
    1. Busch K & Rodewald HR Unperturbed vs. post-transplantation hematopoiesis: both in vivo but different. Curr Opin Hematol 23, 295–303, doi:10.1097/MOH.0000000000000250 (2016). - DOI - PMC - PubMed
    1. Lo Celso C et al. Live-animal tracking of individual haematopoietic stem/progenitor cells in their niche. Nature 457, 92–96, doi:10.1038/nature07434 (2009). - DOI - PMC - PubMed
    1. Lo Celso C, Lin CP & Scadden DT In vivo imaging of transplanted hematopoietic stem and progenitor cells in mouse calvarium bone marrow. Nature protocols 6, 1–14, doi:10.1038/nprot.2010.168 (2011). - DOI - PMC - PubMed
    1. Sipkins DA et al. In vivo imaging of specialized bone marrow endothelial microdomains for tumour engraftment. Nature 435, 969–973, doi:10.1038/nature03703 (2005). - DOI - PMC - PubMed

METHODS REFERENCES

    1. Rodriguez CI et al. High-efficiency deleter mice show that FLPe is an alternative to Cre-loxP. Nat Genet 25, 139–140, doi:10.1038/75973 (2000). - DOI - PubMed
    1. Madisen L et al. A robust and high-throughput Cre reporting and characterization system for the whole mouse brain. Nat Neurosci 13, 133–140, doi:10.1038/nn.2467 (2010). - DOI - PMC - PubMed
    1. Kalajzic Z et al. Directing the expression of a green fluorescent protein transgene in differentiated osteoblasts: comparison between rat type I collagen and rat osteocalcin promoters. Bone 31, 654–660 (2002). - PubMed
    1. Hu Y & Smyth GK ELDA: extreme limiting dilution analysis for comparing depleted and enriched populations in stem cell and other assays. Journal of immunological methods 347, 70–78, doi:10.1016/j.jim.2009.06.008 (2009). - DOI - PubMed
    1. Esipova TV et al. Two new “protected” oxyphors for biological oximetry: properties and application in tumor imaging. Anal Chem 83, 8756–8765, doi:10.1021/ac2022234 (2011). - DOI - PMC - PubMed