. 2020 Feb;578(7794):290-295.
doi: 10.1038/s41586-020-1979-4. Epub 2020 Feb 5.

The guidance receptor plexin D1 is a mechanosensor in endothelial cells

Affiliations

The guidance receptor plexin D1 is a mechanosensor in endothelial cells

Vedanta Mehta et al. Nature. 2020 Feb.

Erratum in

Abstract

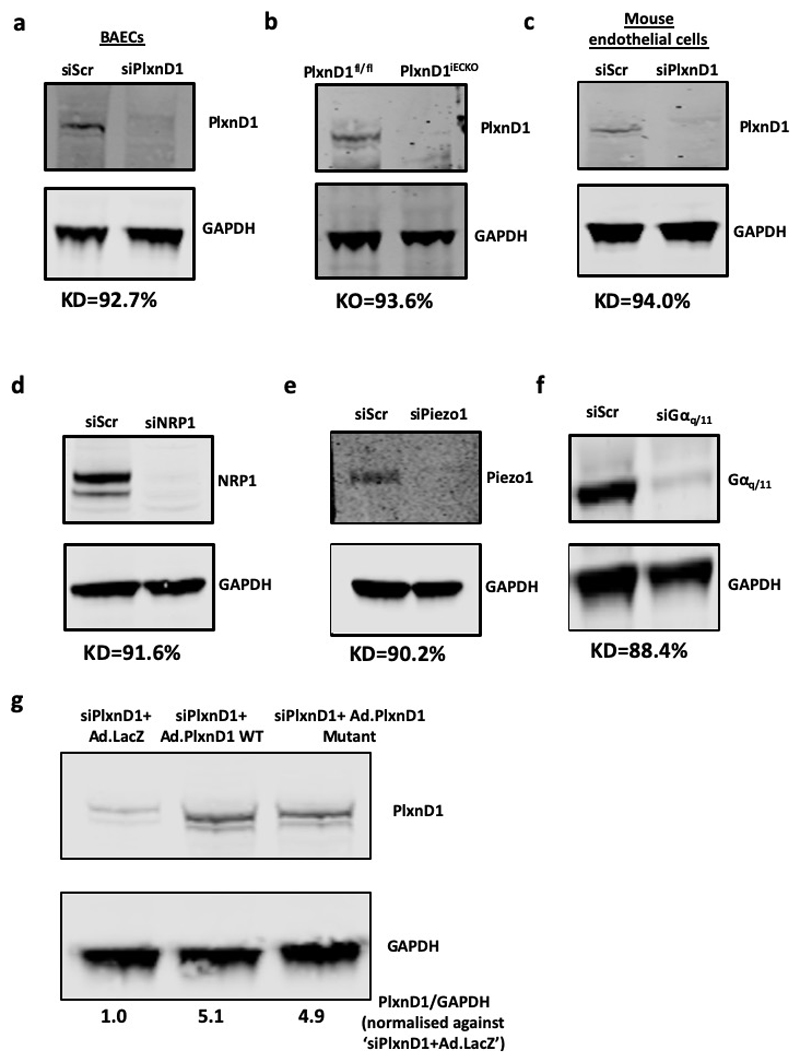
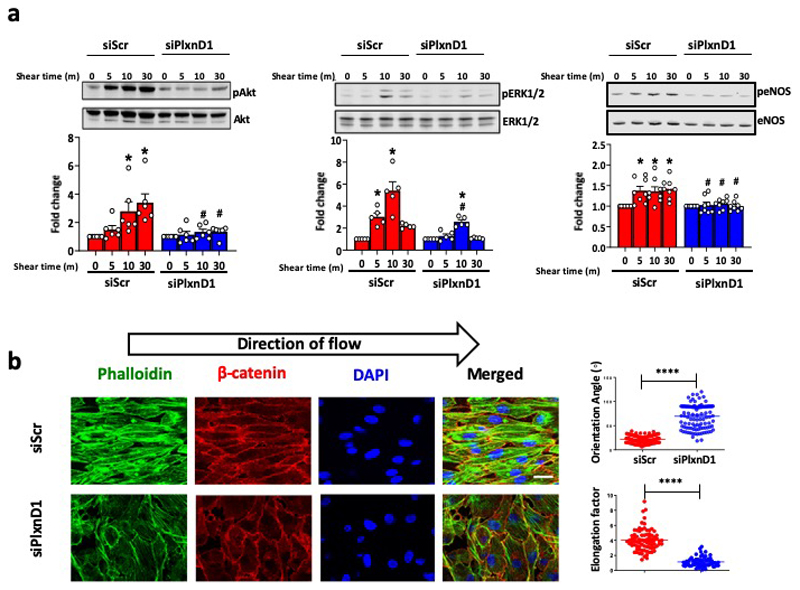
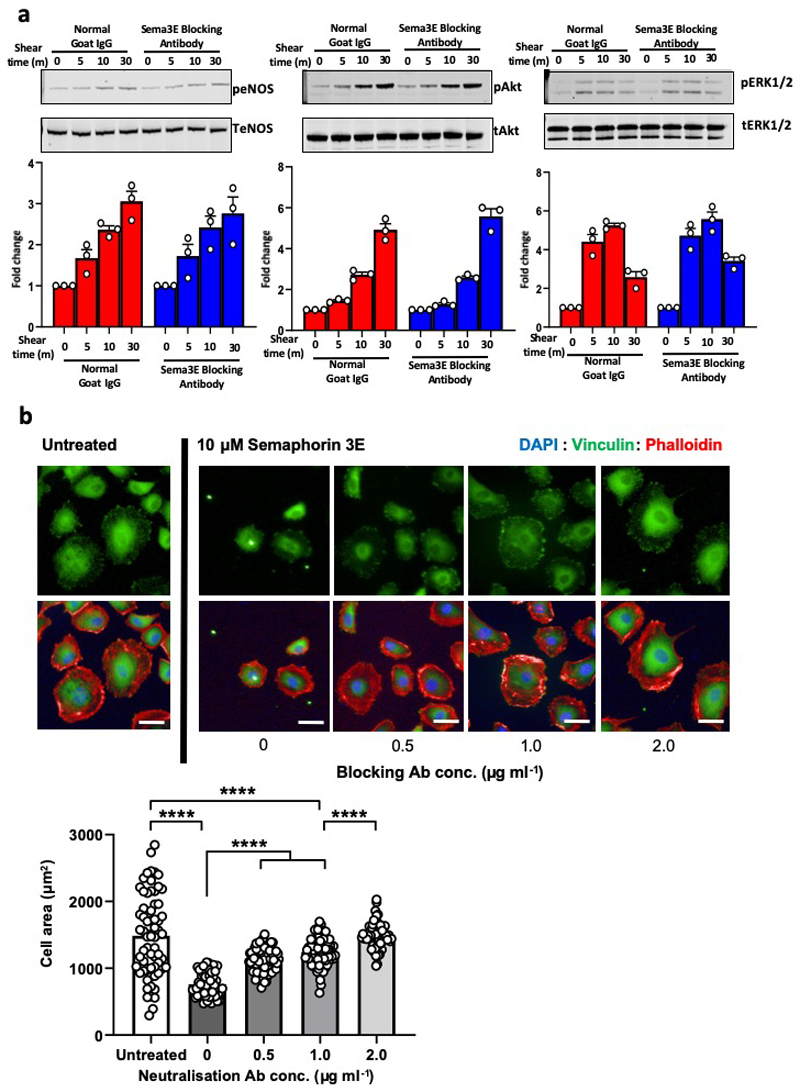
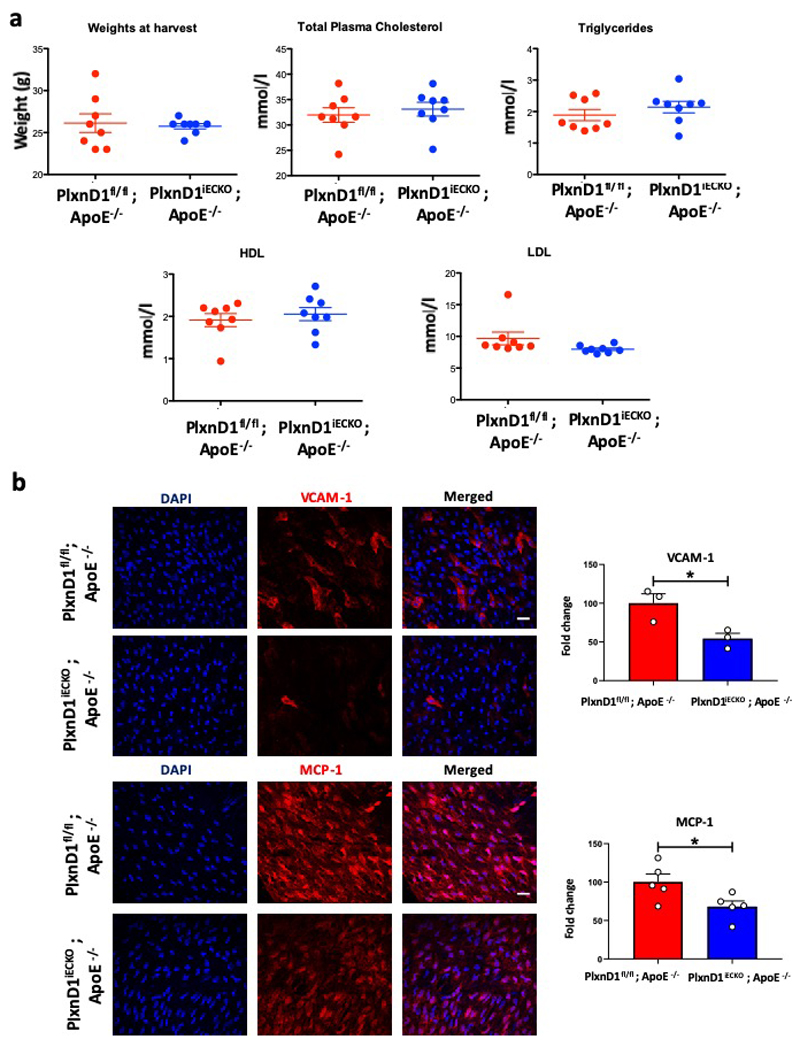
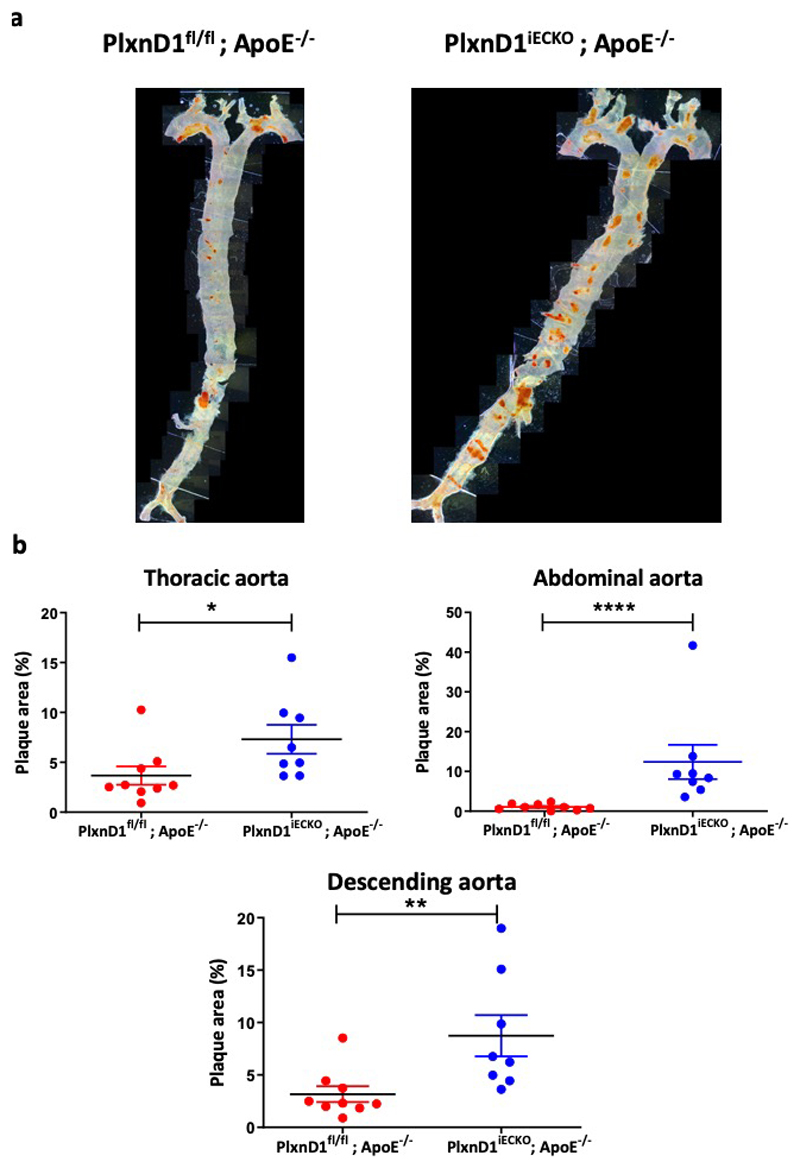
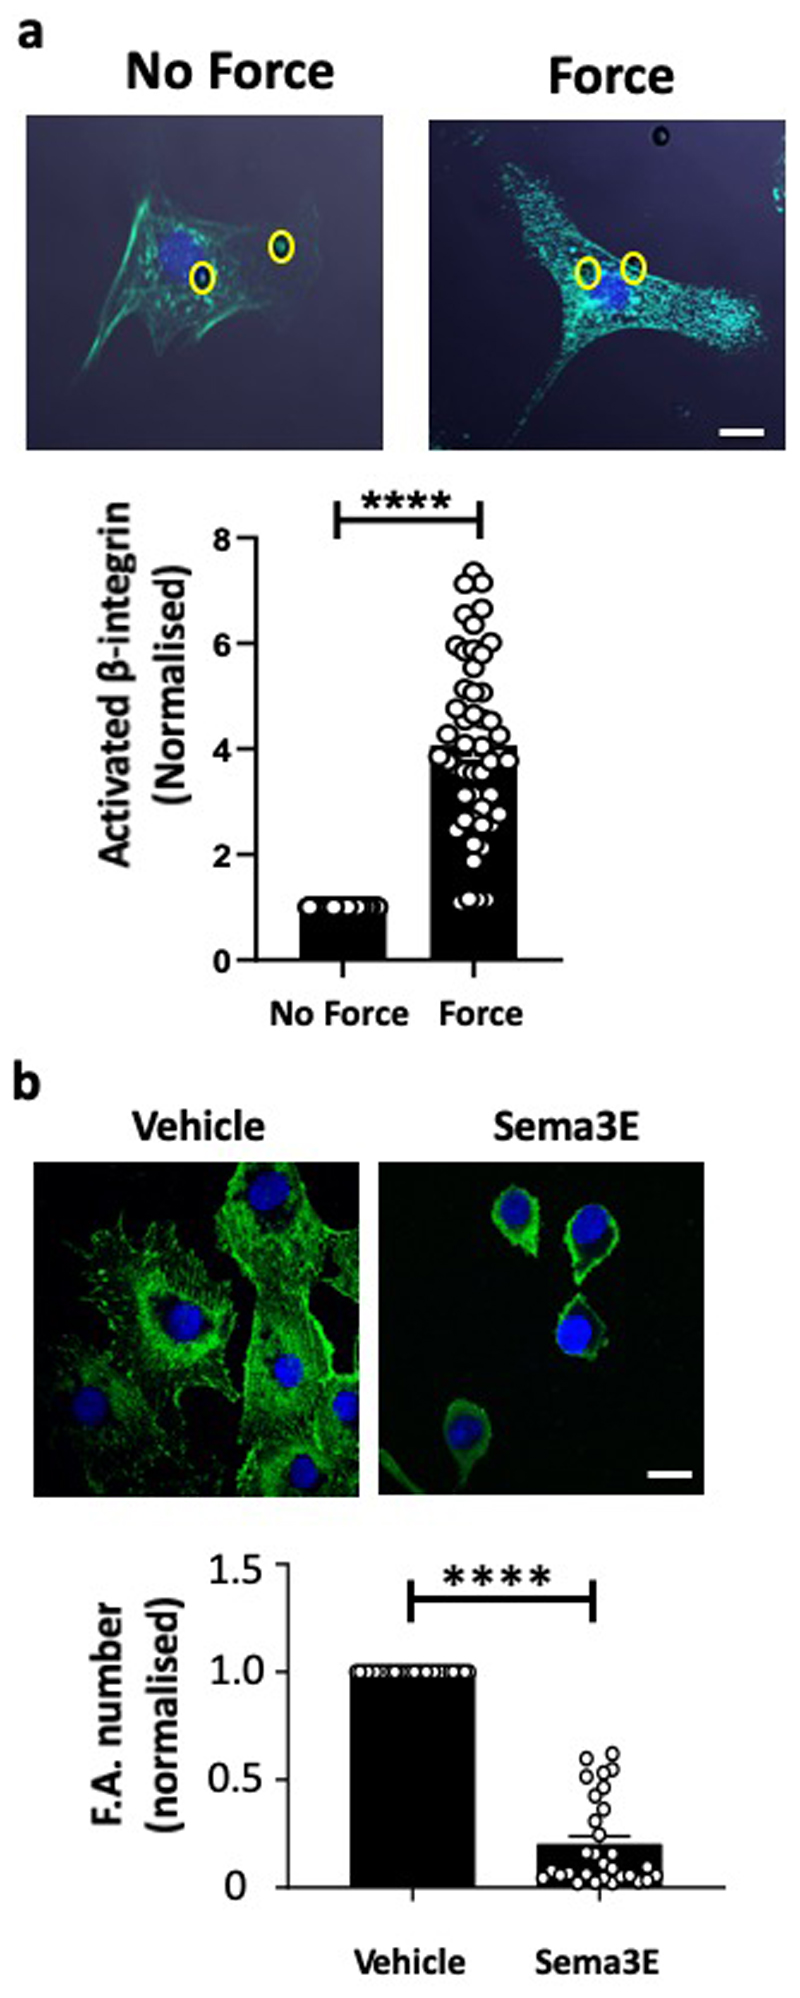
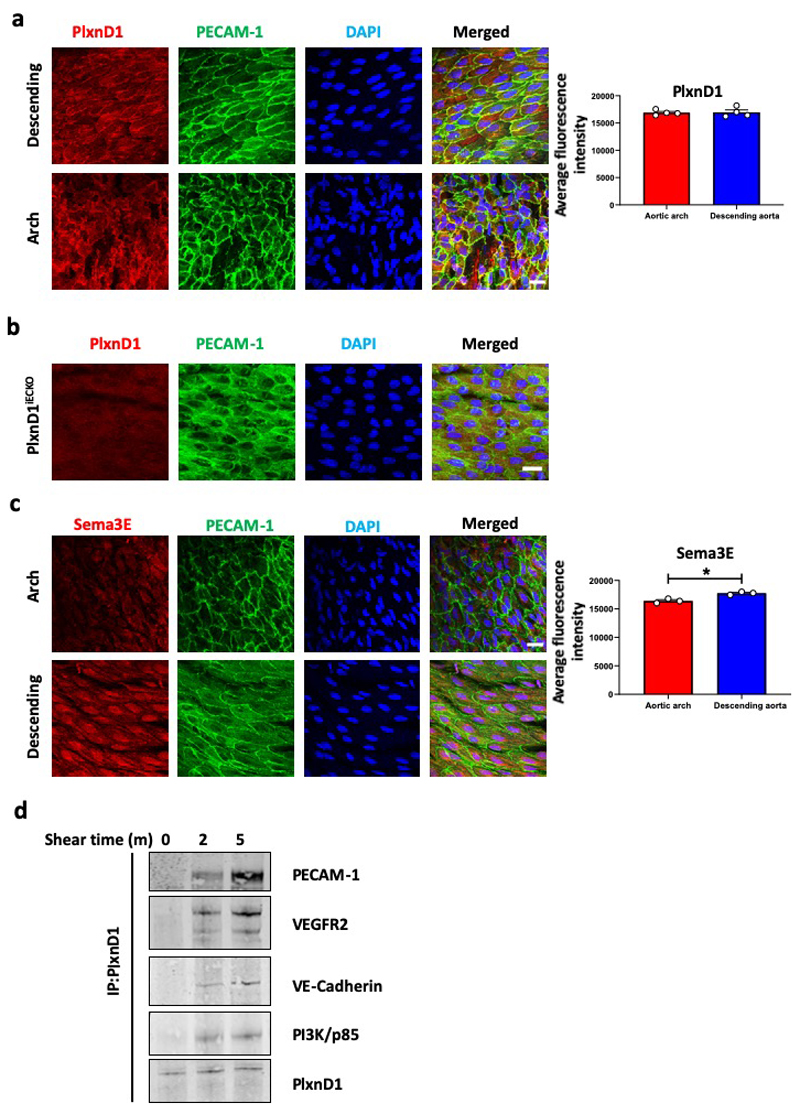
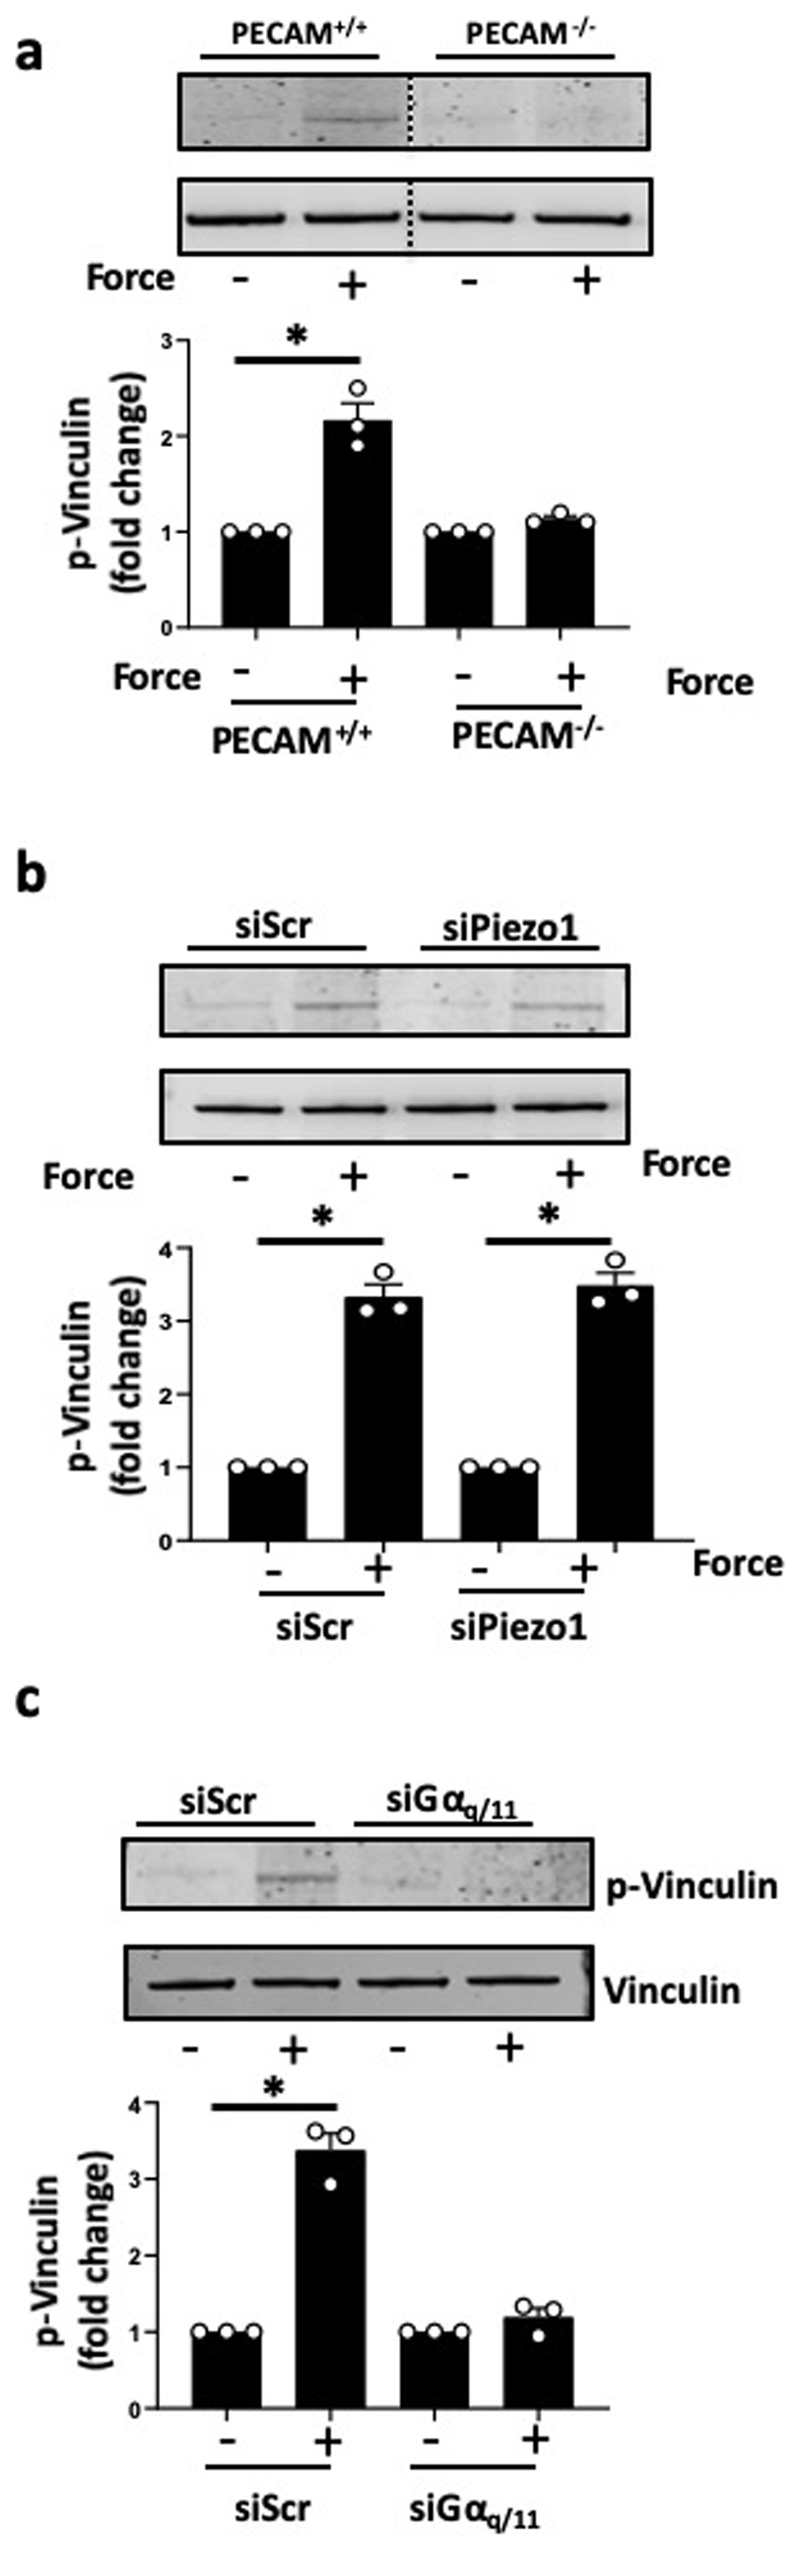
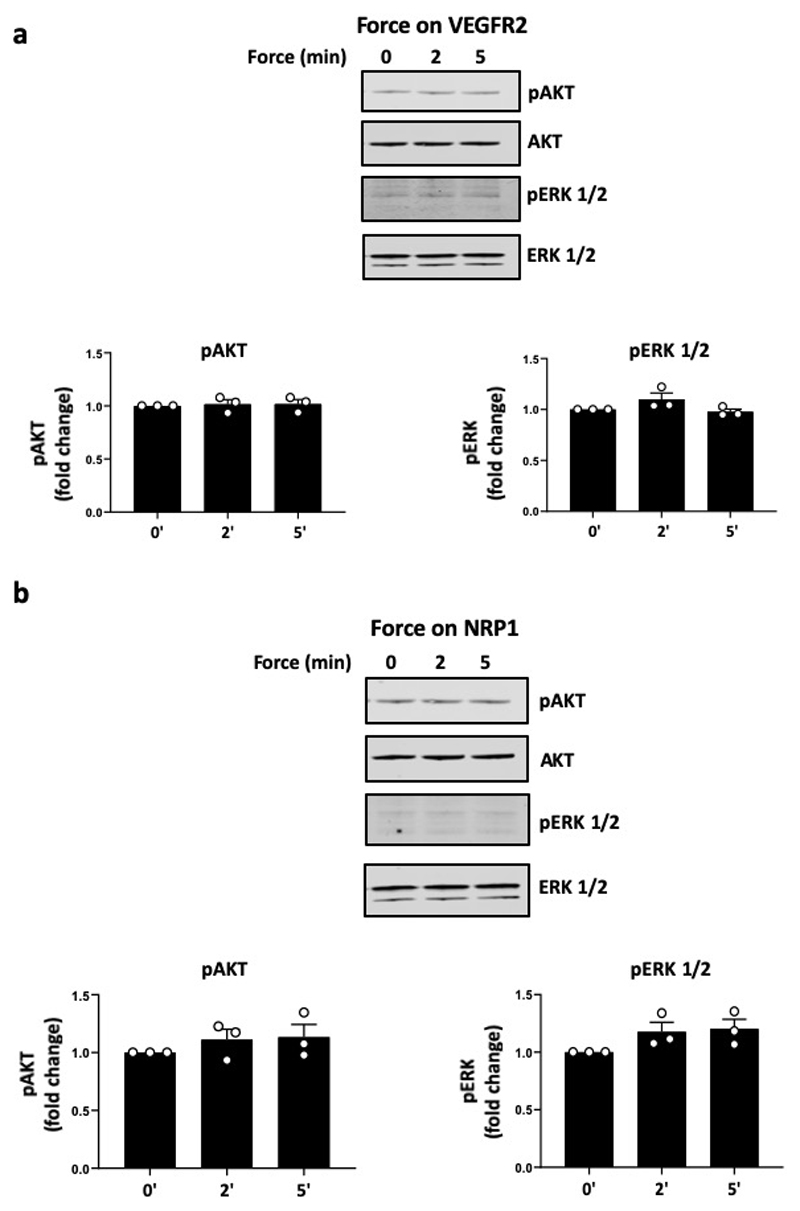
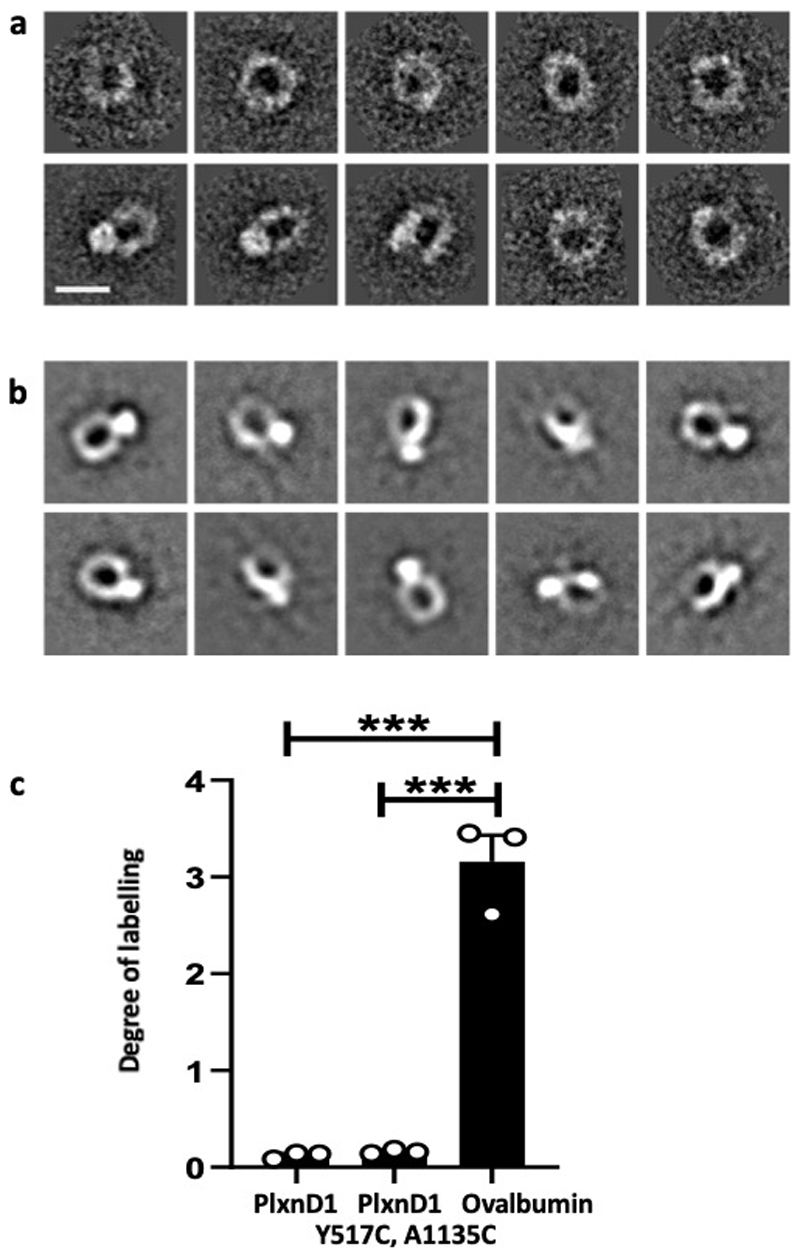
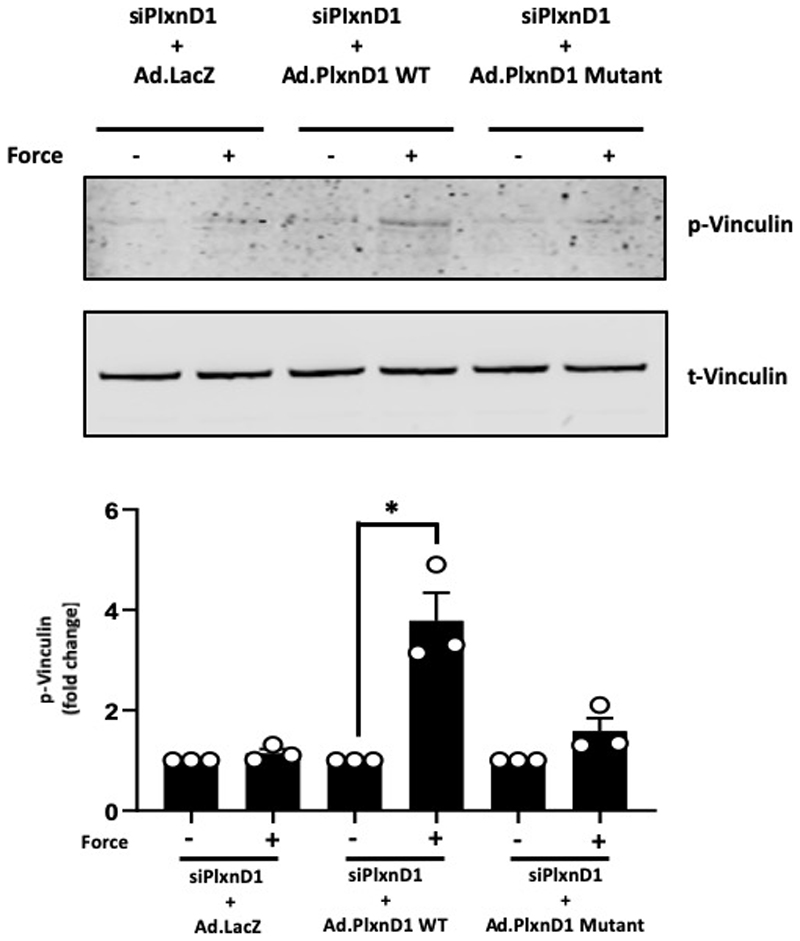
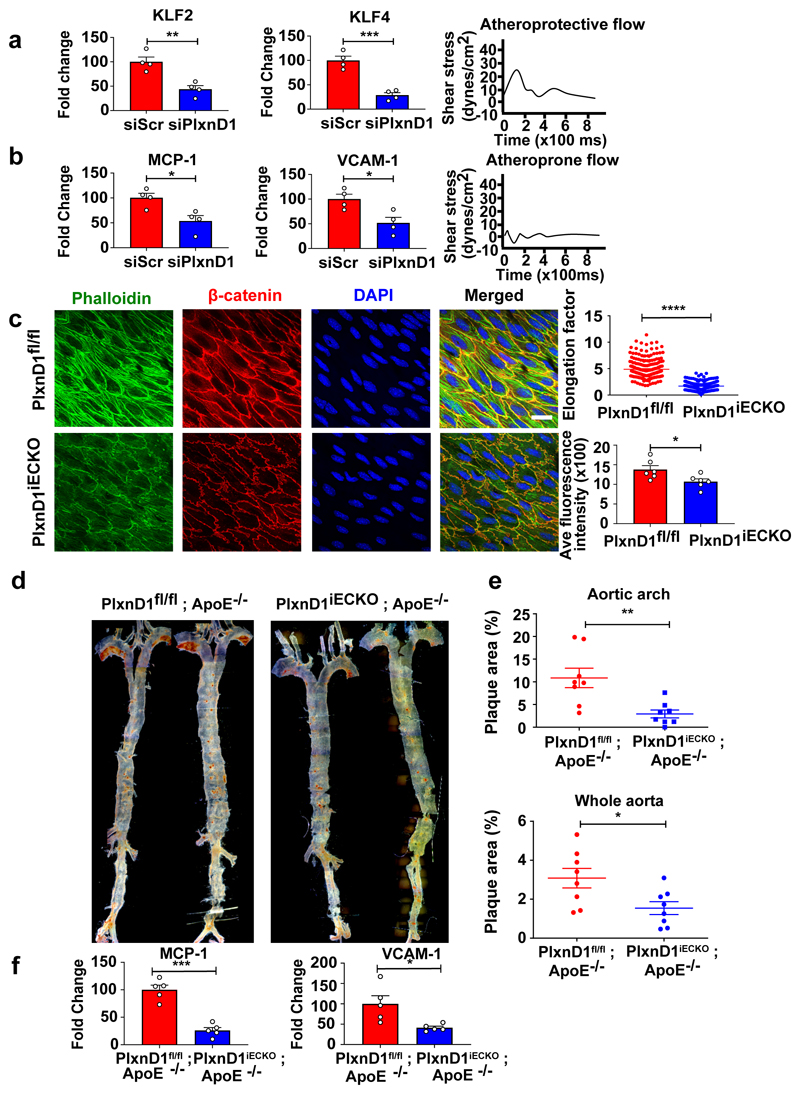
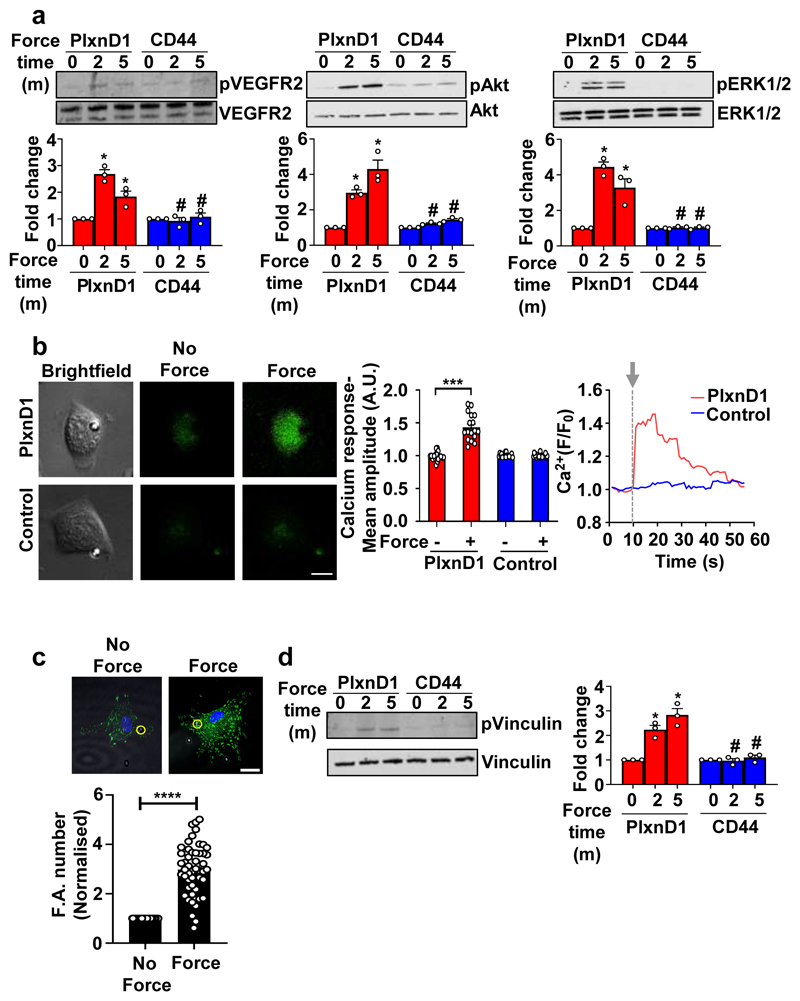
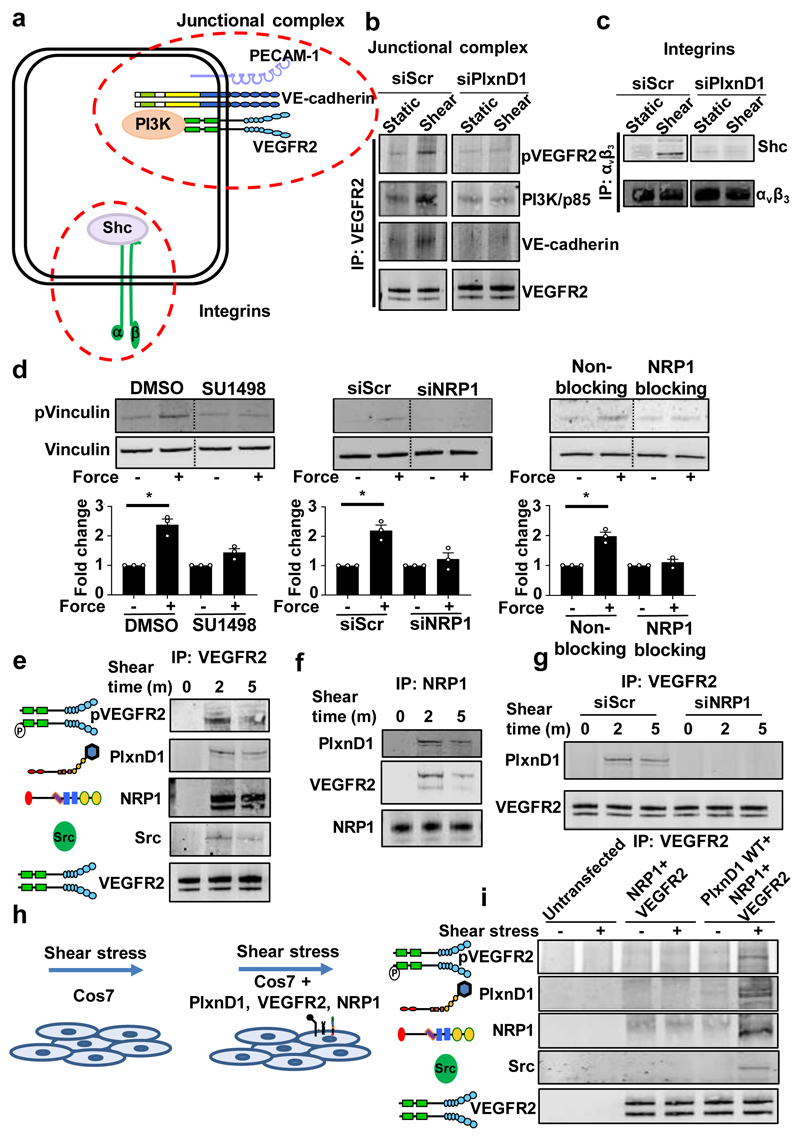
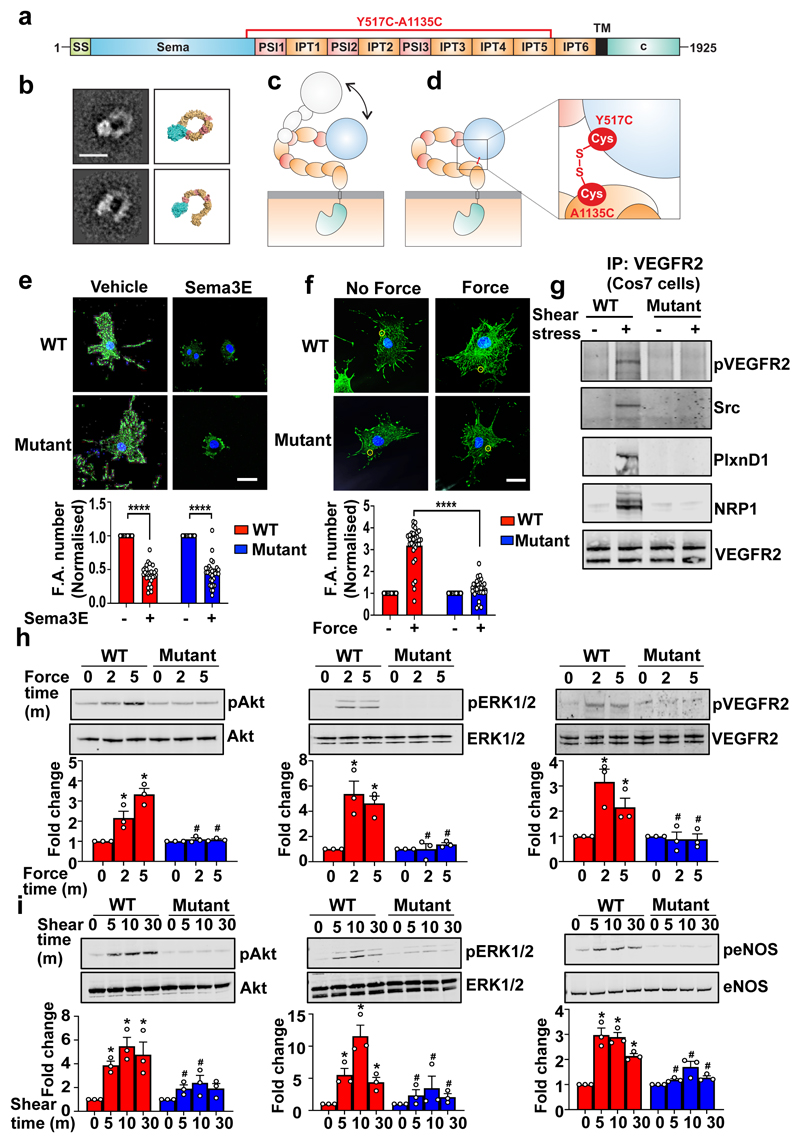
Shear stress on arteries produced by blood flow is important for vascular development and homeostasis but can also initiate atherosclerosis1. Endothelial cells that line the vasculature use molecular mechanosensors to directly detect shear stress profiles that will ultimately lead to atheroprotective or atherogenic responses2. Plexins are key cell-surface receptors of the semaphorin family of cell-guidance signalling proteins and can regulate cellular patterning by modulating the cytoskeleton and focal adhesion structures3-5. However, a role for plexin proteins in mechanotransduction has not been examined. Here we show that plexin D1 (PLXND1) has a role in mechanosensation and mechanically induced disease pathogenesis. PLXND1 is required for the response of endothelial cells to shear stress in vitro and in vivo and regulates the site-specific distribution of atherosclerotic lesions. In endothelial cells, PLXND1 is a direct force sensor and forms a mechanocomplex with neuropilin-1 and VEGFR2 that is necessary and sufficient for conferring mechanosensitivity upstream of the junctional complex and integrins. PLXND1 achieves its binary functions as either a ligand or a force receptor by adopting two distinct molecular conformations. Our results establish a previously undescribed mechanosensor in endothelial cells that regulates cardiovascular pathophysiology, and provide a mechanism by which a single receptor can exhibit a binary biochemical nature.


Conflict of interest statement

The authors declare no competing financial interests.

Figures

Extended Data Figure 1
Extended Data Figure 1. Knockout/knockdown of PlxnD1 and other genes in ECs
(a-f) ECs were either isolated from PlxnD1fl/fl and PlxnD1iECKO mice, or treated with siRNAs to knockdown PlxnD1, NRP1, Piezo1 and Gαq/11. Knockdowns/knockouts were confirmed by western blotting, using GAPDH as a loading control (g) PlxnD1 was knocked down in mouse ECs using a pool of siRNAs, followed by infection with an adenovirus expressing either β-galactosidase (LacZ), WT or mutant PlxnD1. Protein levels were normalised against the housekeeping gene GAPDH. KD=Mean knockdown efficiency based on n=3; KO= Mean knockout efficiency based on n=3.
Extended Data Figure 2
Extended Data Figure 2. PlxnD1 mediates the endothelial cell response to fluid shear stress
(a) Bovine aortic ECs (BAECs) were transfected with Scr or PlxnD1 siRNA and exposed to laminar fluid shear stress (12 dynes/cm2) using a parallel plate system for the indicated time periods. Phosphorylation of Akt (n=6), ERK1/2 (n=5) and eNOS (n=8) was determined by western blotting and quantified using Image Studio Lite Ver 5.2. The data represent mean±SEM. P-values were obtained by performing two-tailed Student's t test using Graphpad Prism.*p<0.05 relative to static condition; #p<0.05 relative to the respective siScr shear time point. (b) BAECs were transfected with Scr or PlxnD1 siRNA and exposed to atheroprotective shear stress for 24 hours. Cells were fixed and stained with phallodin and DAPI as well as antibodies to β-catenin to visualise actin stress fibres, nuclei and cell junctions, respectively. Quantification of alignment was performed using ImageJ; n>50cells over 4 biological replicates (for exact n, please refer to source data). The data represent mean±SEM. P-values were obtained by performing two-tailed Student's t test using Graphpad Prism; ****p<0.0001
Extended Data Figure 3
Extended Data Figure 3. Mechanotransduction via PlxnD1 is independent of its ligand binding functions
(a) BAECs were treated with Sema3E function blocking antibody or control antibody (1ug/ml) and exposed to fluid shear stress for the indicated times. Phosphorylation of eNOS, Akt and ERK1/2 was determined by western blotting and quantified using Image Studio Lite Ver 5.2, n=3 biological repeats. The data represent mean±SEM. (b) BAECs were treated with Sema3E blocking antibody or control antibody for 1 hour before being exposed to Sema3E for 30 minutes at the indicated concentrations. Cells were fixed and probed with anti-vinculin, then stained with phalloidin and DAPI to visualise focal adhesions, actin stress fibres and nuclei, respectively. EC collapse was quantified by measuring cell area using ImageJ. The data represent mean±SEM. Significance was determined by ANOVA with a Tukey post hoc test in Graphpad Prism; ****p<0.0001. n=59-82 cells over 3 independent experiments (for exact n, please refer to source data); scale bar represents 50 μm.
Extended Data Figure 4
Extended Data Figure 4. Lipid profile analysis and expression of inflammatory markers in the aortic arch
(a) Bodyweights and lipid profile analysis of PlxnD1fl/fl; ApoE-/- and PlxnD1iECKO; ApoE-/- mice after 10 weeks of high fat diet feeding (at 16-17 weeks of age); n=8. The data represent mean±SEM. (b) Representative en face preparations of aortic arches immunostained for VCAM-1 (n=3) and MCP-1 (n=5) from PlxnD1fl/fl; ApoE-/- and PlxnD1iECKO, ApoE-/- mice with quantification of fluorescence intensity in fold change; 3-5 images taken from the inner curvature of aortic arches of each mice. The data represent mean±SEM. P-values were obtained by performing two-tailed Student's t test using Graphpad Prism, *p<0.05
Extended Data Figure 5
Extended Data Figure 5. Atherosclerosis in the descending aorta
(a) Representative en face preparations of the whole aorta showing atherosclerosis in PlxnD1fl/fl; ApoE-/- and Plxn D1iECKO; ApoE-/- mice after 20 weeks of high fat diet feeding, visualised by Oil red O staining. (b) Quantification of lesion area in the thoracic aortas, abdominal aortas and whole descending aortas (thoracic aorta+abdominal aorta) from PlxnD1fl/fl; ApoE-/- and PlxnD1iECKO; ApoE-/- mice; n=9 PlxnD1fl/fl; ApoE-/- and 8 PlxnD1iECKO; ApoE-/-. The data represent mean±SEM. P-values were obtained by performing two-tailed Student's t test using Graphpad Prism *p<0.05, **p<0.01, ****p<0.0001
Extended Data Figure 6
Extended Data Figure 6. Mechanical force on PlxnD1 results in integrin activation, but ligand stimulation causes ECs to collapse
(a) BAECs were incubated with anti-PlxnD1-coated beads and subjected to force (10pN) for 5 minutes. ECs were fixed and stained with HUTS4 antibody to mark ligated β1 integrin. Mean fluorescence intensity was quantified using ImageJ software. Values were normalised to the “no force” condition. Location of the beads are highlighted in yellow circles. n=50 cells/condition from 3 independent experiments. The data represent mean±SEM. P-values were obtained by performing two-tailed Student's t test using Graphpad Prism ****p<0.0001, scale bar represents 10 μm. (b) BAECs were incubated with Sema3E or vehicle, fixed and stained with anti-vinculin antibody to mark focal adhesions. Focal adhesion number was quantified using ImageJ software. Values were normalised to the “vehicle” condition. n=30 cells/condition from 3 independent experiments. The data represent mean±SEM. P-values were obtained by performing two-tailed Student's t test using Graphpad Prism ****p<0.0001, scale bar represents 10 μm.
Extended Data Figure 7
Extended Data Figure 7. PlxnD1 co-localises and associates with members of the junctional mechanosensory complex, and its levels are not regulated by flow, unlike Sema3E
(a) The descending thoracic aorta or the inner curvature of aortic arches were isolated and prepared en face from wild-type mice and stained for PlxnD1, PECAM-1 and DAPI. Quantification of PlxnD1 levels was performed by fluorescence intensity measurement on ImageJ; 4-6 images were taken on tissue collected from n=4 animals. The data represent mean±SEM. Scale bar represents 20 μm (b) The descending thoracic aorta was isolated and prepared en face from PlxnD1iECKO mice and stained for PlxnD1 to assess the specificity of the PlxnD1 immunostain, n=3 animals all showing similar result. (c) The descending thoracic aorta or the inner curvature of aortic arches were isolated and prepared en face from wild-type mice and stained for Sema3E, PECAM-1 and DAPI. Quantification of Sema3E levels was performed by fluorescence intensity measurement on ImageJ; 4-6 images were taken on tissue collected from n=3 animals. The data represent mean±SEM. P-values were obtained by performing two-tailed Student's t test using Graphpad Prism *p<0.05; scale bar represents 20 μm (d) Mouse ECs were exposed to shear stress for the indicated times or left as static controls before immunoprecipitating PlxnD1 and examining its association with the junctional mechanosensory complex (PECAM, VE-cadherin and VEGFR2) as well as PI3K/p85, n=3
Extended Data Figure 8
Extended Data Figure 8. Relationship of PlxnD1 with other established mechanosensors
(a) PECAM+/+ and PECAM-/- ECs were incubated with anti-PlxnD1-coated beads and subjected to force application for 5 minutes before examining phosphorylation of vinculin (n=3; *p < 0.05). (b,c) Mouse ECs were treated with siRNAs to Piezo1 and Gαq/11, then incubated with anti-PlxnD1-coated beads and subjected to force application for 5 minutes before examining phosphorylation of vinculin (n=3; *p < 0.05). The data represent mean±SEM. P-values were obtained by performing two-tailed Student's t test using Graphpad Prism
Extended Data Figure 9
Extended Data Figure 9. Force application on other members of the PlxnD1 mechano-complex does not elicit a mechanotransduction response
Mouse ECs were incubated with (a) anti-VEGFR2 or (b) anti-NRP1 antibody-coated beads and subjected to force (10pN) for the indicated time periods. Phosphorylation of Akt and ERK1/2 was determined by western blotting and quantified using Image Studio Lite Ver 5.2, n=3 biological repeats. The data represent mean±SEM.
Extended Data Figure 10
Extended Data Figure 10. Validation of the PlxnD1 mutant.
(a) Negative stain 2D class averages of PlxnD1 WT were obtained by classifying 1305 particles into 10 classes. Scale bar represents 10 nm. (b) Negative stain 2D class averages of PlxnD1 mutant were obtained by classifying 1357 particles into 10 classes. (c) The double mutant of PlxnD1 was labelled with a thiol-reactive fluorescent dye, Alexa Fluor 488 C5 maleimide. The degree of labelling shows that the vast majority of PlxnD1 mutant molecules form the disulphide linked bond and thus the ring of the majority of PlxnD1 mutant molecules appears to be locked by the covalent bond. The degree of labelling for the hen egg ovalbumin, which we used as a positive control, is close to the number of free cysteines in ovalbumin; n=3. The data represent mean±SEM. P values were calculated by two-tailed t-test in Graphpad Prism, ***p<0.001
Extended Data Figure 11
Extended Data Figure 11. An open conformation of PlxnD1 is required for force-dependent signalling.
Mouse lung ECs in which endogenous PlxnD1 was knocked down were infected with adenoviruses expressing β-galactosidase (Ad.LacZ), WT or Mutant PlxnD1 and incubated with anti-PlxnD1 paramagnetic beads, followed by force application for 5 minutes before lysing and assaying vinculin phosphorylation by Western blotting; n=3 biological repeats. The data represent mean±SEM. P-values were obtained by performing two-tailed Student's t test using Graphpad Prism; *p<0.05.
Figure 1
Figure 1. PlxnD1 mediates the endothelial cell response to fluid shear stress and regulates the site-specific distribution of atherosclerosis
(a.b) Mouse ECs were transfected with either Scr or PlxnD1 siRNA and exposed to either atheroprotective or atheroprone flow for 24 hours, using a cone and plate viscometer. Q-PCR was performed for KLF2 and KLF4 on samples subjected to atheroprotective flow, and inflammatory markers MCP-1 and VCAM-1 on samples subjected to atheroprone flow; n=4 biological replicates (c) The descending thoracic aorta was isolated and prepared en face from PlxnD1fl/fl and PlxnD1iECKO mice and stained for β-catenin, phalloidin and DAPI to visualise the cell junctions, actin stress fibres and nuclei. Quantification of alignment was performed using ImageJ; 3-5 images (each image has n≤100 cells) taken from three regions along the length of descending aorta collected from 5 animals of each genotype (for exact n, please refer to source data). (d) Representative en face preparations of whole aortas showing atherosclerosis in PlxnD1fl/fl; ApoE-/- and PlxnD1iECKO; ApoE-/- mice after 10 weeks of high fat diet feeding, visualised by Oil Red O staining. (e) Quantification of lesion area in whole aortas and aortic arches from PlxnD1fl/fl; ApoE-/- and PlxnD1iECKO; ApoE-/- mice; n=8 (f) Aortic arches from PlxnD1fl/fl; ApoE-/- and PlxnD1iECKO, ApoE-/- mice were isolated and Q-PCR was performed for inflammatory markers VCAM-1 and MCP-1; n=5. The data represent mean±SEM. P-values were obtained by performing two-tailed Student's t test using Graphpad Prism. *p<0.05, **p<0.01, ***p<0.001, ****p<0.0001; scale bar represents 20 μm
Figure 2
Figure 2. PlxnD1 is a mechanosensor that mediates the EC response to force
(a) Mouse ECs were incubated with anti-PlxnD1 or C44 (negative control) antibody-coated beads and subjected to force (10pN) for the indicated time periods. Phosphorylation of VEGFR2, Akt and ERK1/2 was determined by western blotting and quantified using Image Studio Lite Ver 5.2, n=3 biological repeats; *p<0.05 relative to no force condition, #p<0.05 relative to the respective force application time point with PlxnD1. (b) BAECs were loaded with Fluo-8AM dye and then incubated with beads coated with an antibody to the extracellular domain of PlxnD1 or Poly L-lysine (negative control). The beads were then subjected to force (1nN). Calcium responses were measured by calculating the fluorescent intensity of individual cells before (10 seconds), during (20 seconds), and after (30 seconds) stimulation. Representative images are shown along with quantification. n=18 cells for PlxnD1 and n=19 cells for control over 3 independent biological replicates. ***p < 0.001 relative to unstimulated controls, scale bar represents 10 μm. Representative trace for calcium influx response over time has also been shown. The arrow marks the start of the stimulation. (c) BAECs were incubated with anti-PlxnD1-coated beads and subjected to force (10pN) for 30min. ECs were fixed and stained with an anti-vinculin antibody to mark focal adhesions. Focal adhesion number was quantified using ImageJ software. Values were normalised to the “no force” condition. Location of the beads are highlighted in yellow circles (n=50 cells for each condition from 3 independent biological replicates;****p<0.0001; scale bar represents 10 μm (d) Mouse ECs were incubated with anti-PlxnD1 or C44 coated beads and subjected to 10pN force for the indicated time periods. Phosphorylation of vinculin was determined by western blotting and quantified using Image Studio Lite Ver 5.2, n=3 biological repeats; *p<0.05 relative to no force condition, #p<0.05 relative to the respective force application time point with PlxnD1. The data represent mean±SEM. P-values were obtained by performing two-tailed Student's t test using Graphpad Prism.
Figure 3
Figure 3. PlxnD1, NRP1 and VEGFR2 mechano-complex functions upstream of known mechanosensory hotspots and is sufficient for responsiveness to shear stress
(a) Schematic showing signalling at the junctional complex and integrins. (b) Mouse ECs were transfected with Scr or PlxnD1 siRNA, exposed to shear stress for 2min before immunoprecipitating VEGFR2 and examining its phosphorylation and association with the p85 subunit of PI3K and VE-Cadherin, n=3. (c) Mouse ECs were transfected with Scr or PlxnD1 siRNA, exposed to shear stress for 30min before immunoprecipitating integrin αVβ3 and examining its association with Shc, n=3. (d) ECs treated with VEGFR2 kinase inhibitor SU1498, transfected with siRNA to NRP1 or treated with NRP1 blocking antibody, then incubated with anti-PlxnD1-coated beads and subjected to force for 5min before examining phosphorylation of vinculin. (n=3; *p < 0.05) The data represent mean±SEM. P-values were obtained by performing two-tailed Student's t test using Graphpad Prism. (e) Mouse ECs were exposed to shear stress before immunoprecipitating VEGFR2 and examining its phosphorylation and association with PlxnD1, NRP1 and Src; n=3. (f) Mouse ECs were exposed to shear stress before immunoprecipitating NRP1 and examining its association with PlxnD1 and VEGFR2; n=3. (g) Mouse ECs transfected with either Scr or NRP1 siRNA were exposed to shear stress before immunoprecipitating VEGFR2 and examining its association with PlxnD1; n=3. (h) Schematic showing that reconstitution of PlxnD1, VEGFR2 and NRP1 in Cos7 cells confers shear stress sensitivity to these cells. (i) Cos7 cells were left untransfected or transfected with NRP1 and VEGFR2, with or without PlxnD1 before being subjected to shear stress for 2min and VEGFR2 was immunoprecipitated. Shear stress sensitivity was assessed by examining phospho-VEGFR2 levels, complex formation between VEGFR2 and Src and complex formation of PlxnD1, VEGFR2 and NRP1, n=3. All shear stress experiments were at 12 dynes/cm2 using a parallel plate system.
Figure 4
Figure 4. PlxnD1 flexion is required for mechanotransduction.
(a) Schematic domain organisation of PlxnD1 spanning amino acids 1-1925. SS, signal sequence; TM, transmembrane region; c, cytoplasmic region. (b) Representative negative stain class averages of the PlxnD1 ectodomain and corresponding structural models showing the ring-like and open conformations, scale bar 10nm. 2D class averages were obtained by classifying 1357 particles into 10 classes. (c) Model of opening the ring-like ectodomain which confers PlxnD1 mechanosensory functions. (d) Design of PlxnD1 mutant with an intramolecular disulphide bond to lock the ring-like structure. Zoom-in view shows the disulphide bond between the sema domain (domain 1) and IPT5 domain (domain 9). (e,f) ECs in which endogenous PlxnD1 was knocked down were infected with adenoviruses expressing WT or Mutant PlxnD1, treated with Sema3E for 30min or incubated with anti-PlxnD1 paramagnetic beads followed by force application (10pN; 30min). Cells were immunostained with anti-vinculin antibodies. Focal adhesion number was quantified using ImageJ; n=30 cells over either 4 (in e) or 3 (in f) biological replicates ****p<0.0001; scale bar 10 μm. (g) Cos7 cells were transfected with WT or mutant PlxnD1, NRP1 and VEGFR2 before shear stress application for 2mins and VEGFR2 was immunoprecipitated. Shear stress sensitivity was assessed by examining phospho-VEGFR2 levels, complex formation between VEGFR2 and Src and complex of PlxnD1, VEGFR2 and NRP1, n=3. (h) ECs in which endogenous PlxnD1 was knocked down were infected with adenoviruses expressing WT or mutant PlxnD1 and incubated with anti-PlxnD1 paramagnetic beads followed by force application (10pN). Phosphorylation of Akt, ERK 1/2 and VEGFR2 was determined, n=3; *p<0.05 relative to “no force” condition; #p<0.05 relative to the respective WT force time point. (i) ECs in which endogenous PlxnD1 was knocked down were infected with adenoviruses expressing WT or mutant PlxnD1 and subjected to fluid shear stress. Phosphorylation of Akt, ERK 1/2 and eNOS was determined, n=3 biological repeats; *p<0.05 relative to static condition; #p<0.05 relative to the respective WT shear time point. All data are mean±SEM. P-values were obtained by performing two-tailed Student's t test using Graphpad Prism.

Comment in

References

    1. Davies PF. Flow-mediated endothelial mechanotransduction. Physiological reviews. 1995;75:519–560. - PMC - PubMed
    1. Givens C, Tzima E. Endothelial Mechanosignaling: Does One Sensor Fit All? Antioxid Redox Signal. 2016;25:373–388. doi: 10.1089/ars.2015.6493. - DOI - PMC - PubMed
    1. Sakurai A, et al. Semaphorin 3E initiates antiangiogenic signaling through plexin D1 by regulating Arf6 and R-Ras. Mol Cell Biol. 2010;30:3086–3098. doi: 10.1128/MCB.01652-09. - DOI - PMC - PubMed
    1. Aghajanian H, et al. Semaphorin 3d and semaphorin 3e direct endothelial motility through distinct molecular signaling pathways. J Biol Chem. 2014;289:17971–17979. doi: 10.1074/jbc.M113.544833. - DOI - PMC - PubMed
    1. Jongbloets BC, Pasterkamp RJ. Semaphorin signalling during development. Development. 2014;141:3292–3297. doi: 10.1242/dev.105544. - DOI - PubMed

MeSH terms

LinkOut - more resources