. 2017;164(3):337-351.
doi: 10.1007/s10546-017-0258-x. Epub 2017 Jun 8.

Are Urban-Canopy Velocity Profiles Exponential?

Affiliations

Are Urban-Canopy Velocity Profiles Exponential?

Ian P Castro. Boundary Layer Meteorol. 2017.

Abstract

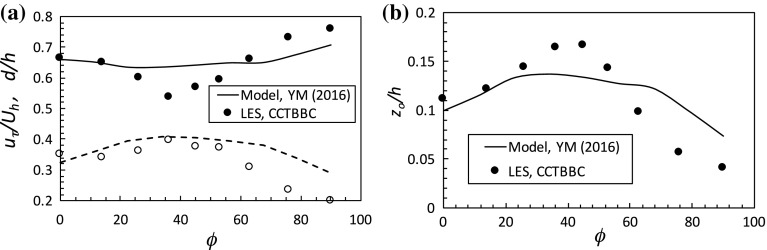
Using analyses of data from extant direct numerical simulations and large-eddy simulations of boundary-layer and channel flows over and within urban-type canopies, sectional drag forces, Reynolds and dispersive shear stresses are examined for a range of roughness densities. Using the spatially-averaged mean velocity profiles these quantities allow deduction of the canopy mixing length and sectional drag coefficient. It is shown that the common assumptions about the behaviour of these quantities, needed to produce an analytical model for the canopy velocity profile, are usually invalid, in contrast to what is found in typical vegetative (e.g. forest) canopies. The consequence is that an exponential shape of the spatially-averaged mean velocity profile within the canopy cannot normally be expected, as indeed the data demonstrate. Nonetheless, recent canopy models that allow prediction of the roughness length appropriate for the inertial layer's logarithmic profile above the canopy do not seem to depend crucially on their (invalid) assumption of an exponential profile within the canopy.

Keywords: Canopy flows; Urban environment; Velocity profiles.


Figures

Fig. 1
Fig. 1
On left plan view of a typical cube array—a staggered array with λp=0.11 (Leonardi and Castro 2010). Aligned arrays would, for λp=0.25 for example, have cubes in boxes 1, 3, 5 (or 2, 4, 6, ) along alternate rows in the figure. At right plan view of DIPLOS array of h×2h×h cuboids (Castro et al. 2016)
Fig. 2
Fig. 2
Canopy spatially-averaged mean velocity profiles for cases of flow-aligned arrays. Values of λp are given in the legends. a Staggered array; b aligned array. The legends indicate data sources: YSMM (black circles), Yang et al. (2016); CCTBBC (green), Claus et al. (2012); CTCB (brown), Coceal et al. (2006); LC (black, blue, red, purple), Leonardi and Castro (2010); CXFRCHHC (green), Castro et al. (2016); BCTB (black), Branford et al. (2011); CP-A (green), Cheng and Porte-Agel (2016)
Fig. 3
Fig. 3
Canopy spatially-averaged mean velocity profiles for λp=0.25. a Staggered and aligned arrays, various wind directions; CCTBBC (green), Claus et al. (2012); BCTB (black), Branford et al. (2011). The dashed line is exponential with a=1.5, fitting the profile for the case of staggered blocks of random height, Xie et al. (2008) (XCC, brown), which is plotted using h=hm and U/Uh=U/Uhm. b The DIPLOS array at various wind angles, from Castro et al. (2016), and the DAPPLE array, from Xie and Castro (2009) (λp=0.53), with a flow angle of about 51 to the major street direction. This case was not modelled as a channel flow and thus required appropriate turbulent boundary-layer inlet conditions, as explained by Xie and Castro (2009)
Fig. 4
Fig. 4
a Sectional drag coefficient within the canopy. All data for a staggered array of cubes with the λp values given in the legend, from Leonardi and Castro (2010), except for the aligned array data from Branford et al. (2011) (BCTB, blue dashed) and the random height array of Xie et al. (2008) (XCC, brown dashed). The solid circles are experimental values obtaining during the course of the laboratory study of Cheng and Castro (2002). b Canopy mixing length, normalized (like z) by h. Legend as for a. Results from DAPPLE (Xie and Castro 2009) are included (green dashed)
Fig. 5
Fig. 5
lm2 versus cd/λf2 for the LC data, with λp values given in the right window. Data for the aligned array (BCTB, dashed lines) are included. Note the direction of increasing z and that the peak mixing length often occurs around mid-canopy height (as evident in Fig. 4b) (Recall that for cube arrays, λp=λf.)
Fig. 6
Fig. 6
a Reynolds shear stress (-uw¯) in the canopy. The legend gives values of λp, the horizontal dashed line denotes the canopy top. The dotted lines are the expected normalised total stress—i.e. all stress components including the pressure contribution across the obstacles—(running from (1,0) to (0,8) for the domain with height 8h and (1,0) to (0,12) for the domain with height 12h). Data are from Leonardi and Castro (2010) and (for the λp=0.33 cases, dashed lines) Castro et al. (2016). b The ratio of dispersive (-u~w~) to Reynolds (-uw¯) shear stresses
Fig. 7
Fig. 7
Mixing length profiles. Data from Leonardi and Castro (2010) cases (solid lines). In a, dashed blue line is aligned array data from Branford et al. (2011) (BCTB) and dotted line is the Coceal et al. (2006) model (CB); b includes data from Cheng and Porte-Agel (2015) (CP-A, staggered cubes in a boundary layer, long-dashed yellow and red), Branford et al. (2011) (BCTB, aligned array, long-dashed blue), Castro et al. (2016) (CXFRCHHC, aligned 1h×2h×1h blocks, short-dashed green and red) and random height array, Xie et al. (2008) (XCC, long-dashed brown). Figures in legends give λp values
Fig. 8
Fig. 8
Variations of uτ/Uh and d / h (a) and zo/h (b) with wind direction. The lines are from the model of Yang et al. (2016) and the symbols are from the LES of Claus et al. (2012), both for a staggered cube array roughness with λf=0.25

References

    1. Böhm M, Finnigan JJ, Raupach MR, Hughes D. Turbulence structure within and above a canopy of bluff elements. Boundary-Layer Meteorol. 2013;146:393–419. doi: 10.1007/s10546-012-9770-1. - DOI
    1. Boudreault LE, Dupont S, Bechmann A, Dellwick E. How forest inhomogeneities affect the edge flow. Boundary-Layer Meteorol. 2017;162:375–400. doi: 10.1007/s10546-016-0202-5. - DOI
    1. Branford S, Coceal O, Thomas TG, Belcher SE. Dispersion of a point-source release of a passive scalar through an urban-like array for different wind directions. Boundary-Layer Meteorol. 2011;139:367–394. doi: 10.1007/s10546-011-9589-1. - DOI
    1. Castro IP, Xie ZT, Fuka V, Robins AG, Carpentieri M, Hayden P, Hertwig D, Coceal O. Measurements and computations of flow in an urban street system. Boundary-Layer Meteorol. 2016
    1. Cheng H, Castro IP. Near-wall flow over urban-type roughness. Boundary-Layer Meteorol. 2002;104:229–259. doi: 10.1023/A:1016060103448. - DOI

LinkOut - more resources