Review
. 2020;216(1):12.
doi: 10.1007/s11214-019-0626-6. Epub 2020 Jan 23.

Ground and In-Flight Calibration of the OSIRIS-REx Camera Suite

Affiliations
Review

Ground and In-Flight Calibration of the OSIRIS-REx Camera Suite

D R Golish et al. Space Sci Rev. 2020.

Abstract

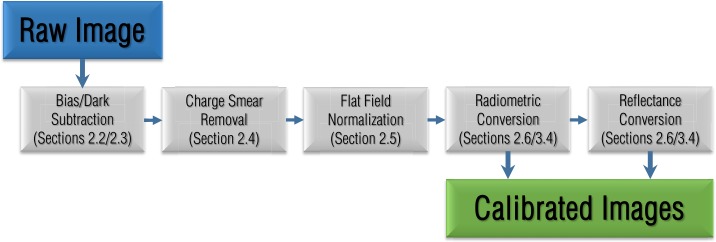
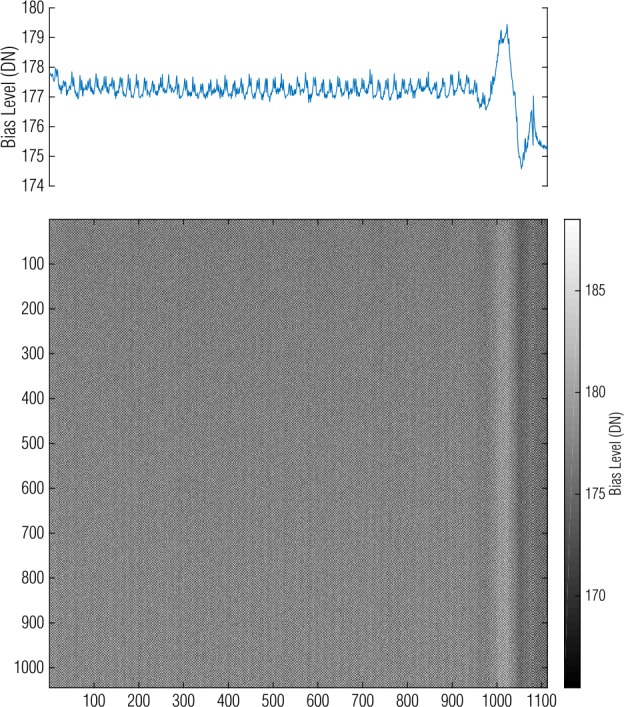
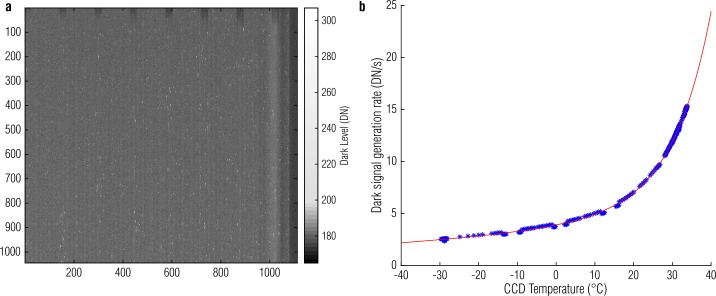
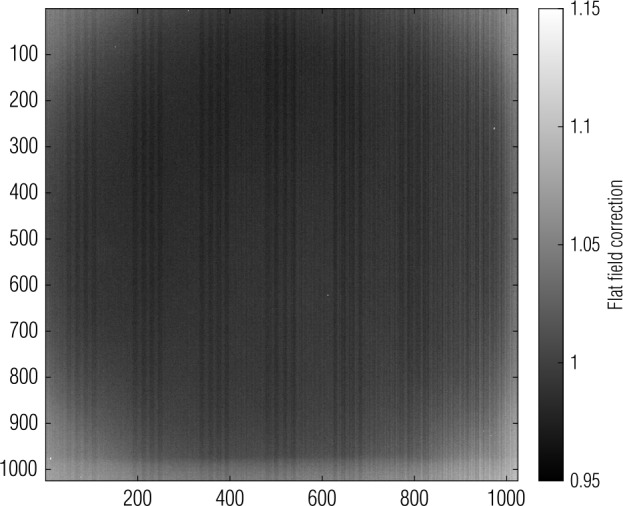
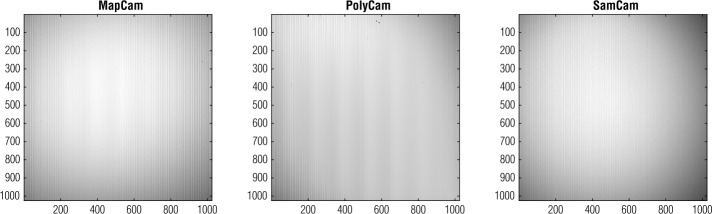
The OSIRIS-REx Camera Suite (OCAMS) onboard the OSIRIS-REx spacecraft is used to study the shape and surface of the mission's target, asteroid (101955) Bennu, in support of the selection of a sampling site. We present calibration methods and results for the three OCAMS cameras-MapCam, PolyCam, and SamCam-using data from pre-flight and in-flight calibration campaigns. Pre-flight calibrations established a baseline for a variety of camera properties, including bias and dark behavior, flat fields, stray light, and radiometric calibration. In-flight activities updated these calibrations where possible, allowing us to confidently measure Bennu's surface. Accurate calibration is critical not only for establishing a global understanding of Bennu, but also for enabling analyses of potential sampling locations and for providing scientific context for the returned sample.

Keywords: (101955) Bennu; Asteroids; Data reduction techniques; Instrumentation; OSIRIS-REx.


Figures

Fig. 1
Fig. 1
A schematic of the OCAMS image calibration pipeline that processes images from their raw form to products that are ready for scientific analysis. Each step includes a reference to the relevant section of this document
Fig. 2
Fig. 2
(a) OCAMS detector region layout, showing (column, row) extents. (b) Opaque metalized strips (light gray), which overlay the edges of every pixel (blue), increase the detector transfer speed, but reduce the optically sensitive area to a 6.5×8.5 μm region. Anti-blooming barriers (yellow), bisected by anti-blooming drains (brown), are located beneath the surface between every pair of pixels. Channel stops (dark gray) prevent charge from transferring between pairs of pixels
Fig. 3
Fig. 3
OCAMS CCD frame transfer architecture
Fig. 4
Fig. 4
Color portrait of Earth acquired during OSIRIS-REx’s EGA maneuver in September 2017, which put the spacecraft on its trajectory to reach Bennu. Observations of Earth and the Moon were collected during this maneuver to check and calibrate the instruments. Earth was such a bright target that it required static exposure times of 0.45 ms, precluding the possibility of a final storage area flush and horizontal serial register flush. The incident light overwhelmed the serial registers with signal, which overflowed onto the image in the storage area, shown here as icicles at the top (the location of the serial register in this image). The length of each contaminating line is a reflection of the accumulated brightness in the column below it
Fig. 5
Fig. 5
A MapCam master bias image depicts columnar spatial variation. The plot at the top represents the average of each column and depicts the sinusoidal roll-on effect on the right side
Fig. 6
Fig. 6
A MapCam master bias/dark image, shown with a non-linear stretch that visualizes both the bulk signal level and the bright hot pixels (a) and its temperature model (b)
Fig. 7
Fig. 7
A schematic depiction of the CCD frame transfer process and resulting charge smear
Fig. 8
Fig. 8
A PolyCam image of the Moon taken on 25 September 2017 before (a) and after (b) charge smear correction. The guided method reduces the charge smear by ∼99%
Fig. 9
Fig. 9
A MapCam master flat is normalized to its mean and inverted to make its application multiplicative; bright areas will be amplified when the correction is applied
Fig. 10
Fig. 10
Temperature-spectral responsivity as measured in a flight-spare detector. Data points are colored from red to blue to represent their temperatures from hot to cold. The bandpasses of the b′, v, w, and x filters are overlaid in blue, green, red, and dark red from left to right; the panchromatic filter is indicated with a dashed black line. There is no significance to the relative height of the pass bands and the normalized detector response; they are scaled for display
Fig. 11
Fig. 11
Measuring linearity with the flight cameras (a) identifies the linear regime. A more comprehensive test with a flight-spare detector at a series of exposure times (b), where color indicates a unique exposure time, provides a large data set that covers the range of light levels expected at Bennu. Independently analyzing each exposure time produces a summary of detector linearity across this dynamic range (c) and confirms the results of the flight camera tests. The detectors are ≥2% nonlinear at signals below 1000 DN and above 14000, 12500, and 13000 DN for MapCam, PolyCam, and SamCam, respectively
Fig. 12
Fig. 12
Calibration lamp images from the 6-month post-launch checkout for each camera. We will monitor changes in these images from before launch and throughout the mission to update the master flats as necessary
Fig. 13
Fig. 13
Plotting intensity of a point source as a function of pixel position demonstrates a different aliasing pattern for each MapCam filter and suggests a potential correction. However, independently acquired data (of other point sources or in different regions of the detector) do not follow the same pattern. Therefore, the OCAMS calibration pipeline does not include an automatic correction for this effect
Fig. 14
Fig. 14
SamCam, MapCam, and PolyCam images of the Moon during OSIRIS-REx’s EGA (ac). Comparison of the EGA images with a ROLO image (d) re-projected to match OCAMS geometry (e, f) updates the radiometric calibration of the cameras. Comparison with simulated images using a Kaguya MI photometric model of the Moon (gi) verifies the calibration for MapCam and PolyCam and directly provides the calibration for SamCam
Fig. 15
Fig. 15
Taking the ratio of OCAMS data to ROLO data taken at the same phase angle produces a histogram (a); excluding data outside two standard deviations (red dashed lines), we calculate the mean (black dashed line) to find the radiometric correction applied to the ground calibration. The MapCam filters required corrections between 6 and 14% (b). Calculations of band ratios on ROLO and OCAMS data separately (c) and a comparison of MapCam measurements of Bennu to ground-based observations (d) demonstrate a <2% relative radiometric uncertainty. Comparison with simulations based on a Kaguya Multiband Imager basemap independently determines an absolute radiometric uncertainty of ∼5% (e)

References

    1. Barker M.K., Mazarico E., Neumann G.A., Zuber M.T., Haruyama J., Smith D.E. Icarus. 2016;273:346. doi: 10.1016/j.icarus.2015.07.039. - DOI
    1. Choi M.K. Planet. Def. Sp. Environ. Appl. 2016;9981:99810E.
    1. Choi M.K., Bos B.J., Tveekrem J.L., D’Aubigny C., Rizk B., Lauretta D.S. Abstr. 2019-3966 Present. 2019 AIAA Propuls. Energy; 2019.
    1. Clark B.E., Binzel R.P., Howell E.S., Cloutis E.A., Ockert-Bell M., Christensen P., Barucci M.A., DeMeo F., Lauretta D.S., Connolly H., Soderberg A., Hergenrother C., Lim L., Emery J., Mueller M. Icarus. 2011;216:462. doi: 10.1016/j.icarus.2011.08.021. - DOI
    1. Crombie M., Selznick S., Loveridge M., Rizk B., DellaGiustina D.N., Golish D.R., Bos B.J., Christensen P.R., Hamilton V.E., Reuter D., Simon A.A., Barnouin O.S., Daly M.G., Espiritu R.C., Clark B., Nolan M.C., Lauretta D.S. Abstr. P33C-3858 Present. 2018 Fall Meet. Washington: AGU; 2018.

LinkOut - more resources