. 2020 Jan;40(1):509-529.
doi: 10.1002/joc.6225. Epub 2019 Aug 11.

Effects of the tropospheric large-scale circulation on European winter temperatures during the period of amplified Arctic warming

Affiliations

Effects of the tropospheric large-scale circulation on European winter temperatures during the period of amplified Arctic warming

Timo Vihma et al. Int J Climatol. 2020 Jan.

Abstract

We investigate factors influencing European winter (DJFM) air temperatures for the period 1979-2015 with the focus on changes during the recent period of rapid Arctic warming (1998-2015). We employ meteorological reanalyses analysed with a combination of correlation analysis, two pattern clustering techniques, and back-trajectory airmass identification. In all five selected European regions, severe cold winter events lasting at least 4 days are significantly correlated with warm Arctic episodes. Relationships during opposite conditions of warm Europe/cold Arctic are also significant. Correlations have become consistently stronger since 1998. Large-scale pattern analysis reveals that cold spells are associated with the negative phase of the North Atlantic Oscillation (NAO-) and the positive phase of the Scandinavian (SCA+) pattern, which in turn are correlated with the divergence of dry-static energy transport. Warm European extremes are associated with opposite phases of these patterns and the convergence of latent heat transport. Airmass trajectory analysis is consistent with these findings, as airmasses associated with extreme cold events typically originate over continents, while warm events tend to occur with prevailing maritime airmasses. Despite Arctic-wide warming, significant cooling has occurred in northeastern Europe owing to a decrease in adiabatic subsidence heating in airmasses arriving from the southeast, along with increased occurrence of circulation patterns favouring low temperature advection. These dynamic effects dominated over the increased mean temperature of most circulation patterns. Lagged correlation analysis reveals that SCA- and NAO+ are typically preceded by cold Arctic anomalies during the previous 2-3 months, which may aid seasonal forecasting.

Keywords: Arctic; European weather; North Atlantic oscillation; Scandinavian pattern; subsidence heating; teleconnections.


Figures

Figure 1
Figure 1
Map of five European areas. CE: Central Europe 45°–55°N, 0°–20°E; SE: Southern Europe 35°–45°N, 10°W–35°E; NE: Northern Europe 55°–70°N, 5°–25°E; WE: Western Europe 50°–60°N, 10°W–5°E; EE: Eastern Europe 45°–55°N, 20°–40°E [Colour figure can be viewed at http://wileyonlinelibrary.com]
Figure 2
Figure 2
Self‐organizing maps (SOMs) generated using 500 hPa height anomalies from ERA‐interim reanalysis, 1979–2015. The patterns are numbered from 1 to 12, and most are named after the large‐scale circulation patterns they resemble. The percentages above each pattern denote their relative frequency of occurrence
Figure 3
Figure 3
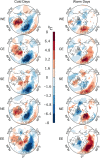
Composite maps of the northern hemisphere T2m anomalies related to (1ST column) extremely cold events (−2SD as threshold) and (second column) extremely warm events (+1.75SD as threshold) in western (WE), central (CE), southern (SE), northern (NE), and eastern Europe (EE) during winters (DJFM) 1979–2015. The colour shadings denote the areas with significant (95% confidence) differences between the mean values of composites of anomalous events and the normal events (less than +1.75SD and greater than −2SD). The colour shadings denote the areas with significant (95% confidence) differences between the mean values of composites of anomalous events and the normal events (less than +1.75SD and greater than −2SD)
Figure 4
Figure 4
Winter (DJFM) anomalies of the divergence of vertically integrated latent heat transport mapped to the six most common nodes of the SOM matrix in Figure 2. Anomalies are relative to monthly climatology of 1979–2015. Dotted and solid green contours enclose areas with significant values at the 95 and 99% level, respectively. The significance is determined using a Monte‐Carlo approach, where the anomaly has been compared with 5,000 artificial anomalies that are similar to the original anomaly, but based on a random selection of days from the winter season during the study period
Figure 5
Figure 5
Winter (DJFM) anomalies of the divergence of vertically integrated dry‐static energy transport mapped to the six most common nodes of the SOM matrix in Figure 2. Anomalies are relative to monthly climatology of 1979–2015. Dotted and solid green contours enclose areas with significant values at the 95 and 99% level, respectively. The significance is determined using a Monte‐Carlo approach, where the anomaly has been compared with 5,000 artificial anomalies that are similar to the original anomaly, but based on a random selection of days from the winter season during the study period
Figure 6
Figure 6
2‐m temperature anomalies (in °C) for winter (DJFM) in 1979–2015 projected on the same SOM nodes as in Figure 4. The green lines indicate the area 35°–70°N, 10°W–60°E
Figure 7
Figure 7
Composites of Arctic (north of 70°N) winter (DJFM) detrended 2‐m air temperature anomalies as a function of time lag with respect to the six most common large‐scale circulation patterns identified by the SOM analysis. Dark lines indicate significance at the 95% confidence level. The significance is determined using a Monte‐Carlo approach similar to that applied for Figure 4
Figure 8
Figure 8
Difference in DJFM 2‐m temperature anomalies, 1998–2015 minus 1979–1997, for the same SOM nodes as in Figure 4. The black crosses indicate areas with significant values at the 95% confidence level
Figure 9
Figure 9
Histograms for the monthly (DJFM) relative frequency of occurrence of the same SOM nodes as in Figure 4 for (a–f) all events and (g–l) solely for cases when the atmosphere has resided in the same pattern for at least four consecutive days. The blue and red bars are for the periods 1979–1997 and 1998–2015, respectively
Figure 10
Figure 10
Geopotential anomalies at 500 hPa for the five most common large‐scale patterns obtained by a cluster analysis using winter (DJFM) ERA‐interim data. Histogram shows the relative monthly frequency of occurrence of each cluster, where blue and red bars are for the periods 1979–1997 and 1998–2015
Figure 11
Figure 11
Differences in winter (DJFM) mean air temperature (°C) at 1 km height between the periods 1998–2015 and 1979–1997 in cases of airmass origins in the northwest, northeast, southeast, and southwest (noted in corresponding quadrants of circles) for Archangelsk (Ar), Berlin (be), Bucharest (Bu), Glasgow (Gl), Hammerfest (ha), Helsinki (he), Kazan (Ka), Minsk (mi), Moscow (Mo), and Rome (Ro)
Figure 12
Figure 12
(a) Winter (DJFM) mean air temperature at 1 km height over the selected cities during 1979–2015 for the five circulation patterns identified on the basis of cluster analysis, and (b) the temperature difference between periods 1998–2015 and 1979–1997, for Helsinki (blue solid lines), Hammerfest (black solid lines), Kazan (green solid lines), Moscow (red solid lines), Archangelsk (magenta solid lines), Minsk (blue dashed lines), Berlin (black dashed lines), Bucharest (green dashed lines), Rome (red dashed lines), and Glasgow (magenta dashed lines)

References

    1. Barnston, A.G. and Livezey, R.E. (1987) Classification, seasonality and persistence of low frequency atmospheric circulation patterns. Monthly Weather Review, 115, 1083–1126.
    1. Bojariu, R. and Reverdin, G. (2002) Large‐scale variability modes of freshwater flux and precipitation over the Atlantic. Climate Dynamics, 18, 369–381.
    1. Buckley, M.W. and Marshall, J. (2016) Observations, inferences, and mechanisms of Atlantic meridional overturning circulation variability: a review. Reviews of Geophysics, 54, 5–63. 10.1002/2015RG000493. - DOI
    1. Bueh, C. and Nakamura, H. (2007) Scandinavian pattern and its climate impact. Quarterly Journal of the Royal Meteorological Society, 133, 2117–2131.
    1. Cassou, C. , Terray, L. , Hurrell, J.W. and Deser, C. (2004) North Atlantic winter climate regimes: spatial asymmetry, stationarity with time, and oceanic forcing. Journal of Climate, 17, 1055–1068.

LinkOut - more resources