. 2020 Jan 28:6:4.
doi: 10.1038/s41421-019-0138-2. eCollection 2020.

"Dysfunctions" induced by Roux-en-Y gastric bypass surgery are concomitant with metabolic improvement independent of weight loss

Affiliations

"Dysfunctions" induced by Roux-en-Y gastric bypass surgery are concomitant with metabolic improvement independent of weight loss

Meiyi Li et al. Cell Discov. .

Erratum in

Abstract

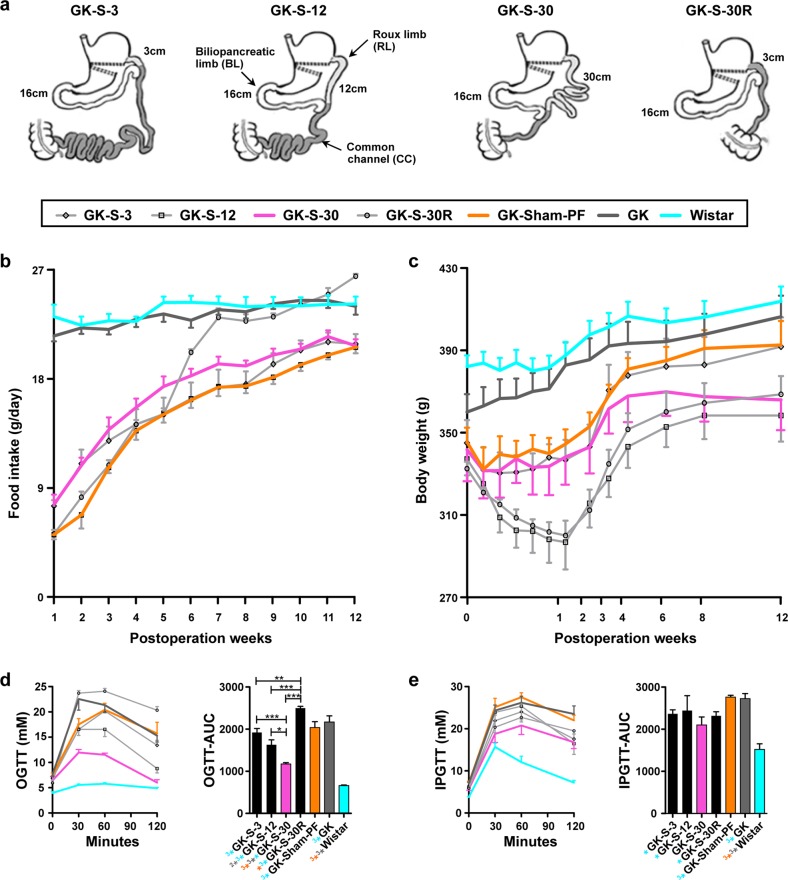
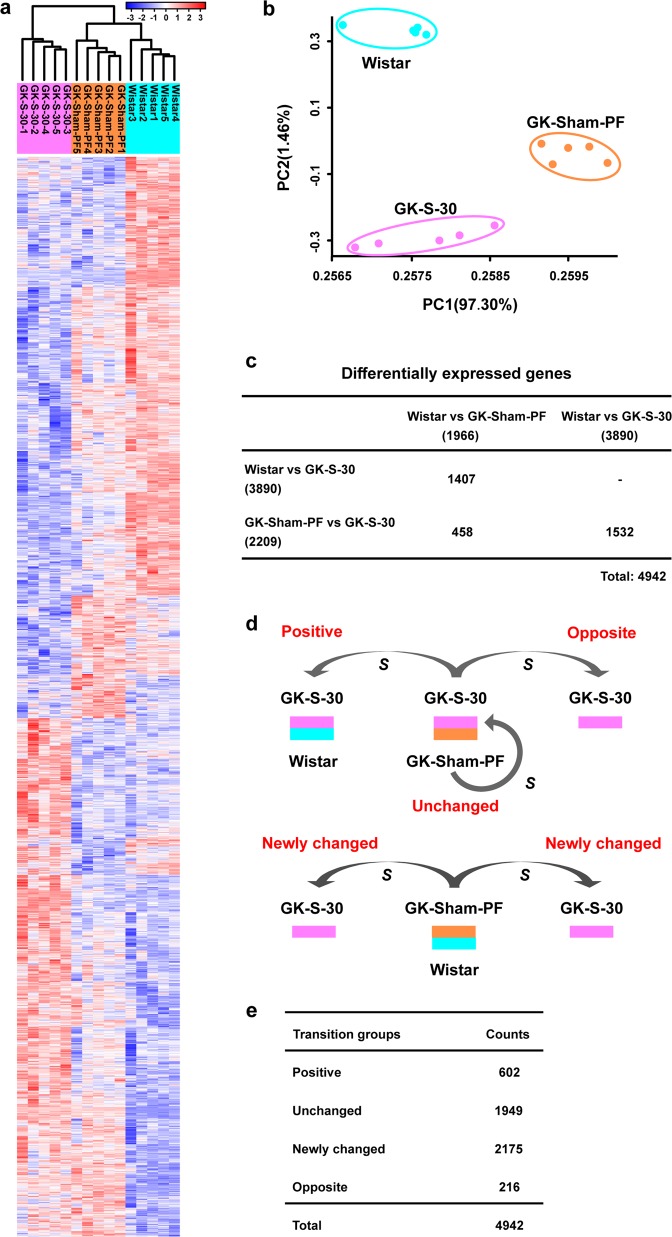
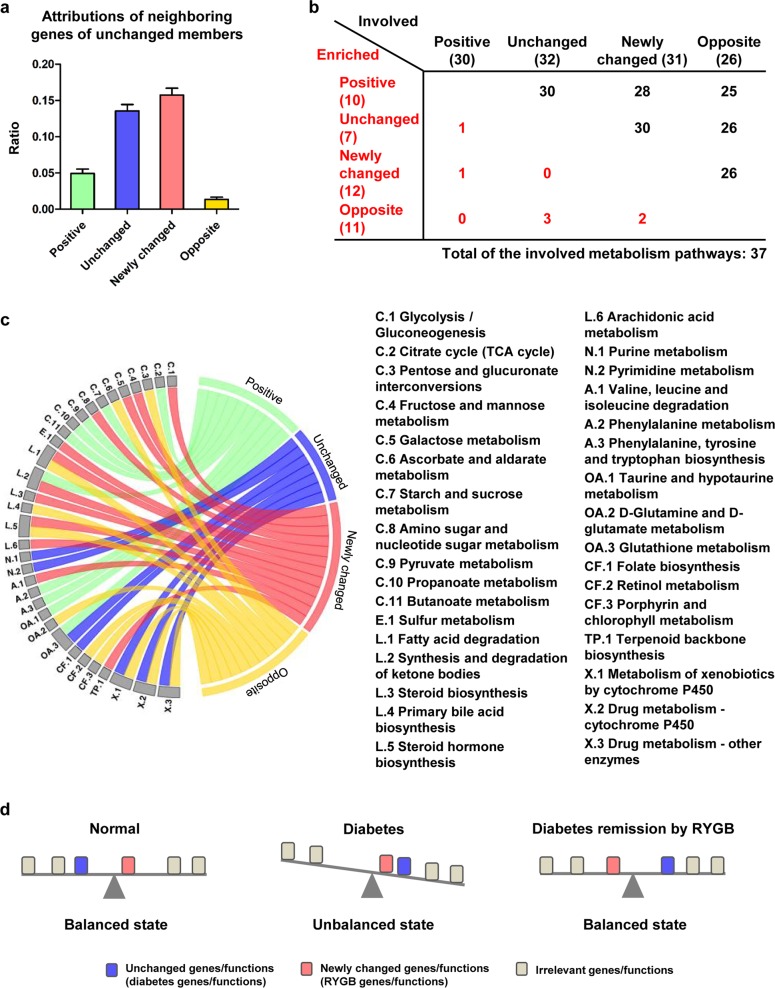
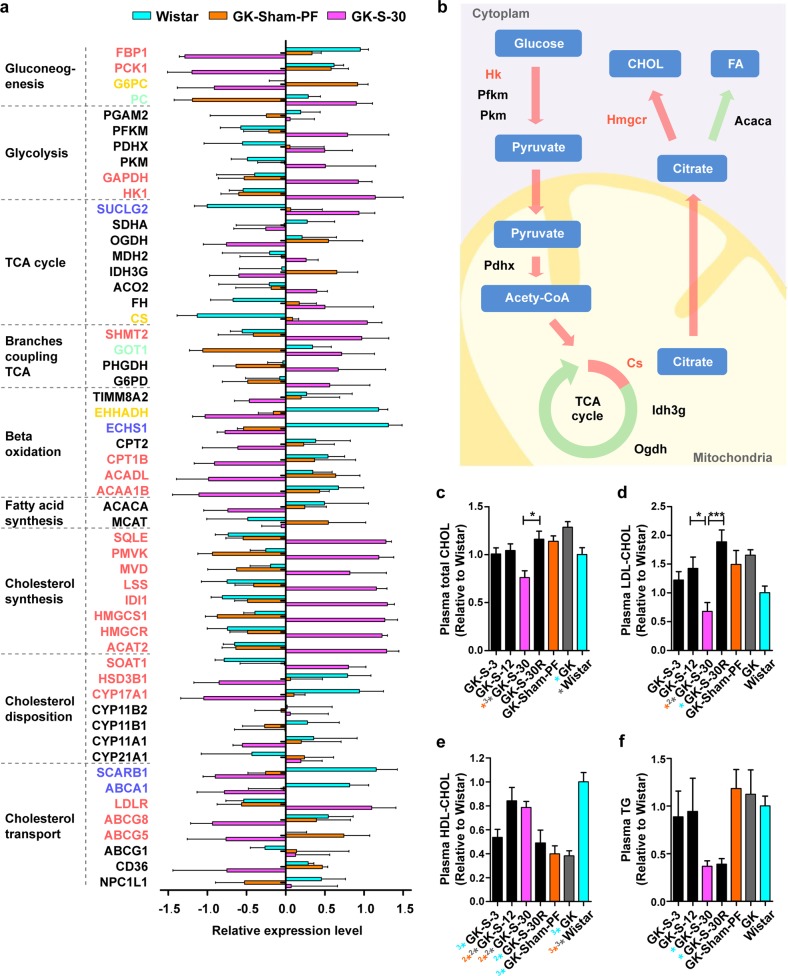
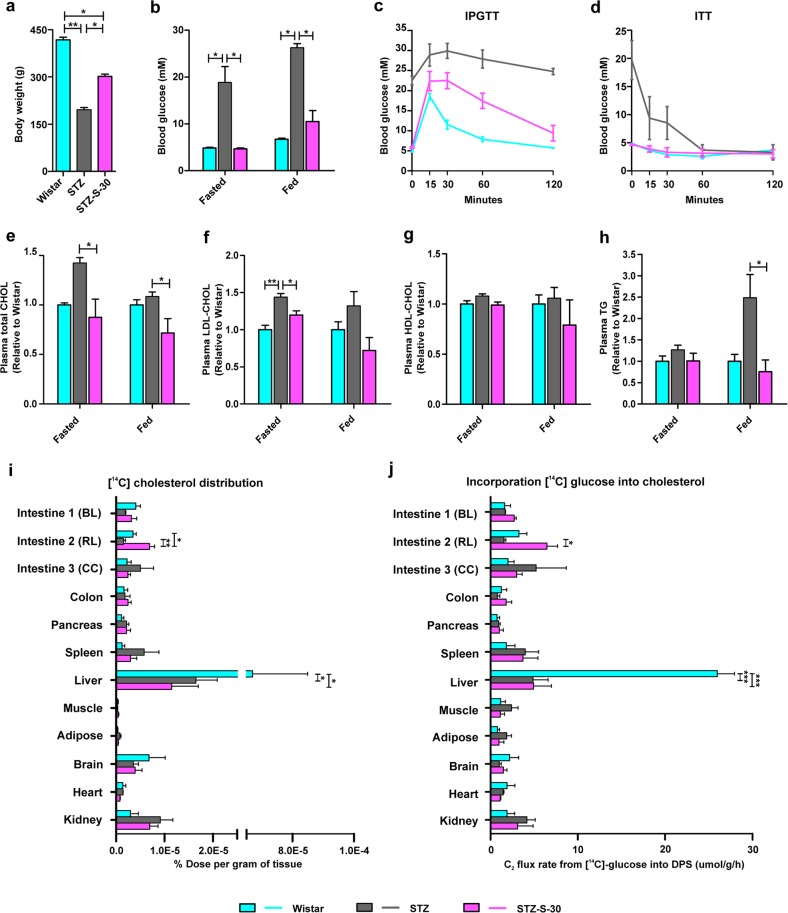
Metabolic surgery has been increasingly recommended for obese diabetic patients, but questions remain as to its molecular mechanism that leads to improved metabolic parameters independently of weight loss from a network viewpoint. We evaluated the role of the Roux limb (RL) in Roux-en-Y gastric bypass (RYGB) surgery in nonobese diabetic rat models. Improvements in metabolic parameters were greater in the long-RL RYGB group. Transcriptome profiles reveal that amelioration of diabetes state following RYGB differs remarkably from both normal and diabetic states. According to functional analysis, RYGB surgery significantly affected a major gene group, i.e., the newly changed group, which represented diabetes-irrelevant genes abnormally expressed after RYGB. We hypothesize that novel "dysfunctions" carried by this newly changed gene group induced by RYGB rebalance diabetic states and contribute to amelioration of metabolic parameters. An unusual increase in cholesterol (CHOL) biosynthesis in RL enriched by the newly changed group was concomitant with ameliorated metabolic parameters, as demonstrated by measurements of physiological parameters and biodistribution analysis using [14C]-labeled glucose. Our findings demonstrate RYGB-induced "dysfunctions" in the newly changed group as a compensatory role contributes to amelioration of diabetes. Rather than attempting to normalize "abnormal" molecules, we suggest a new disease treatment strategy of turning "normal" molecules "abnormal" in order to achieve a new "normal" physiological balance. It further implies a novel strategy for drug discovery, i.e. targeting also on "normal" molecules, which are traditionally ignored in pharmaceutical development.

Keywords: Mechanisms of disease; Transcriptomics.


Conflict of interest statement

Conflict of interestThe authors declare that they have no conflict of interest.

Figures

Fig. 1
Fig. 1. Various RYGB procedures (with regard to RL length) performed in GK rats, and measurement of the corresponding physiological parameters.
a Schematic description of the various RYGB procedures used in this study. BL, located 16 cm from the ligament of Treitz, was identical in the four surgical groups. RL (light gray), 3, 12, or 30 cm in length, is connected to the upper portion of the stomach and passes food to the CC (dark gray). GK-S-3 group (3-cm RL; very long CC), GK-S-12 group (12-cm RL), GK-S-30 group (30-cm RL; short CC), GK-S-30R group (BL and CC same as in GK-S-30, but 30 cm of RL is excised, and only 3 cm is left). be Physiological parameters in four RYGB groups and three control groups (GK pair-fed/sham-operated (GK-PF), untreated GK (GK), and normal Wistar). Amelioration of diabetes in the seven groups was assessed by measurement of physiological parameters. b Food intake. c Body weight. d OGTT and AUC-glucose. Glucose (2 g/kg) was administered orally. e IPGTT and AUC-glucose. Glucose (1 g/kg) was injected i.p. Rats in both d and e were fasted overnight before experiments. Data are expressed as mean ± SE. AUC was calculated by trapezoidal integration. Statistical significance of differences of means between groups was determined by ANOVA with Tukey’s multiple comparison test (n ≥ 5), with *P < 0.05; **(2*)P < 0.01; ***(3*)P < 0.001. Symbols with orange color refer to comparison with GK-Sham-PF; gray, with GK; cyan, with Wistar.
Fig. 2
Fig. 2. Analyses of transcriptomic profiles among three physiological states.
a Heatmap illustrating dynamics of 4942 DEGs among the three state groups (normal Wistar, diabetes-GK-PF, diabetes remission-GK-S (short for GK-S-30)). Unsupervised hierarchical clustering was performed to distinguish among physiological states. The three types of rats were distinctly clustered into three independent groups, indicating that physiological state of diabetes remission by RYGB differed strongly from both normal and diabetic states. b PCA results showing visually that the three types of rats were clustered distinctly into three independent groups, confirming similar results from hierarchical clustering. c Few overlapping DEGs in comparison with pairwise groups, with no statistical significance by the hypergeometric test (all P values are 1). d Schematic diagram illustrates four transition groups (positive, unchanged, opposite, and newly changed) of DEGs to fractionize functional roles of DEGs and clarify relationships between RYGB-associated and diabetes-associated changes at the gene expression level. S: surgery. e DEGs in the four transition groups were counted. Most of the DEGs belonged to the unchanged and newly changed groups. Positive group was out of proportion to unchanged group.
Fig. 3
Fig. 3. Rebalance model to explain compensatory strategy of diabetes remission by RYGB.
a Histogram showing distributions of neighboring nodes of unchanged genes in four transition groups. b Overlapping functional analysis in a total of 37 metabolism-associated processes significantly enriched by each of four transition groups. c Enriched metabolism-associated pathways by four transition groups graphically shown in detail. C carbohydrate metabolism, E energy metabolism, L lipid metabolism, N nucleotide metabolism, A amino acid metabolism, OA metabolism of other amino acids, CF metabolism of cofactors and vitamins, X xenobiotic biodegradation and metabolism. d Schematic diagram illustrating rebalance strategy of diabetes remission by RYGB. Blue block: diabetes-related genes/functions not recovered by RYGB (unchanged group). Red block: newly changed genes, i.e., diabetes-irrelevant genes unusually expressed after RYGB. Not all diabetes-related genes could be restored following RYGB, but the physical system rearranges other normal metabolic pathways, newly changed “dysfunctions”, which unexpectedly improve metabolic parameters and rebalance the abnormalities caused by unchanged diabetes-associated genes. In a and c, positive transition group is indicated by green color, unchanged group by blue, newly changed group by red, and opposite group by yellow.
Fig. 4
Fig. 4. Increase in newly synthesized HDL-CHOL contributes to glycometabolism rebalance.
a Changes in expression of key enzymes of glucose and CHOL metabolism in three groups (Wistar, GK-PF, GK-S-30; each n = 5) in terms of relative mRNA level. Gene symbols are colored green for positive transition group; blue: unchanged; red: newly changed; yellow: opposite; black: non-DEGs. b Schematic diagram showing that increased de novo CHOL synthesis in RL has direct beneficial effect on glycemic control after RYGB. c Plasma total CHOL, d plasma LDL-CHOL, e plasma HDL-CHOL, and f plasma TG were measured in overnight-fasted blood samples from GK and Wistar groups. Data are expressed as mean ± SE. Statistical terms (n ≥ 6) and symbol colors as in Fig. 1.
Fig. 5
Fig. 5. Amelioration of diabetes and changes in [14C] glucose metabolism in STZ-treated diabetic rats after long-RL RYGB.
aj Amelioration of diabetes in 30-cm RL RYGB STZ rats (STZ-S-30) was compared with both nonoperated STZ rats (STZ) and normal Wistar rats by measurement of physiological parameters 3 months postoperation. a Body weight. b Blood glucose. c IPGTT (1 g/kg glucose was injected i.p.). d Insulin tolerance test (ITT) (1 U/kg insulin was injected i.p.). e Plasma total CHOL. f Plasma LDL-CHOL. g Plasma HDL-CHOL. h Plasma TG. Rats were in fasted-overnight and fed states. i [14C] glucose was administered orally according to body weight. Three hours later, [14C] CHOL was precipitated and biodistribution was measured in the three groups. Newly synthesized CHOL from [14C] glucose was significantly increased in intestine 2 (RL) but remained low in liver. j [14C] glucose incorporation rate into CHOL. Data are expressed as µmol [14C] glucose incorporated into digitonin-precipitable sterols (DPS) per gram of tissue per hour. Data are expressed as mean ± SE. Statistically significant differences of means between groups were determined by ANOVA with Tukey’s multiple comparison test (in ah, n ≥ 4; in i and j, n = 3 for each group), where *P < 0.05, **P < 0.01 for multiple comparisons among the three groups by ANOVA.

Similar articles

Cited by

References

    1. Giovannucci E, et al. Diabetes and cancer: a consensus report. Diabetes Care. 2010;33:1674–1685. doi: 10.2337/dc10-0666. - DOI - PMC - PubMed
    1. Pearson-Stuttard J, et al. Worldwide burden of cancer attributable to diabetes and high body-mass index: a comparative risk assessment. Lancet Diabetes Endocrinol. 2018;6:e6–e15. doi: 10.1016/S2213-8587(18)30150-5. - DOI - PMC - PubMed
    1. Rubino F, et al. Metabolic surgery in the treatment algorithm for type 2 diabetes: a joint statement by International Diabetes Organizations. Diabetes Care. 2016;39:861–877. doi: 10.2337/dc16-0236. - DOI - PubMed
    1. Brito JP, Montori VM, Davis AM. Metabolic surgery in the treatment algorithm for type 2 diabetes: a joint statement by International Diabetes Organizations. JAMA. 2017;317:635–636. doi: 10.1001/jama.2016.20563. - DOI - PMC - PubMed
    1. Caiazzo R, et al. Roux-en-Y gastric bypass versus adjustable gastric banding to reduce nonalcoholic fatty liver disease: a 5-year controlled longitudinal study. Ann. Surg. 2014;260:893–898. doi: 10.1097/SLA.0000000000000945. - DOI - PubMed