. 2020 Jan 14:2020:1360843.
doi: 10.1155/2020/1360843. eCollection 2020.

Altered Expression of Long Noncoding and Messenger RNAs in Diabetic Nephropathy following Treatment with Rosiglitazone

Affiliations

Altered Expression of Long Noncoding and Messenger RNAs in Diabetic Nephropathy following Treatment with Rosiglitazone

Liwen Zhang et al. Biomed Res Int. .

Abstract

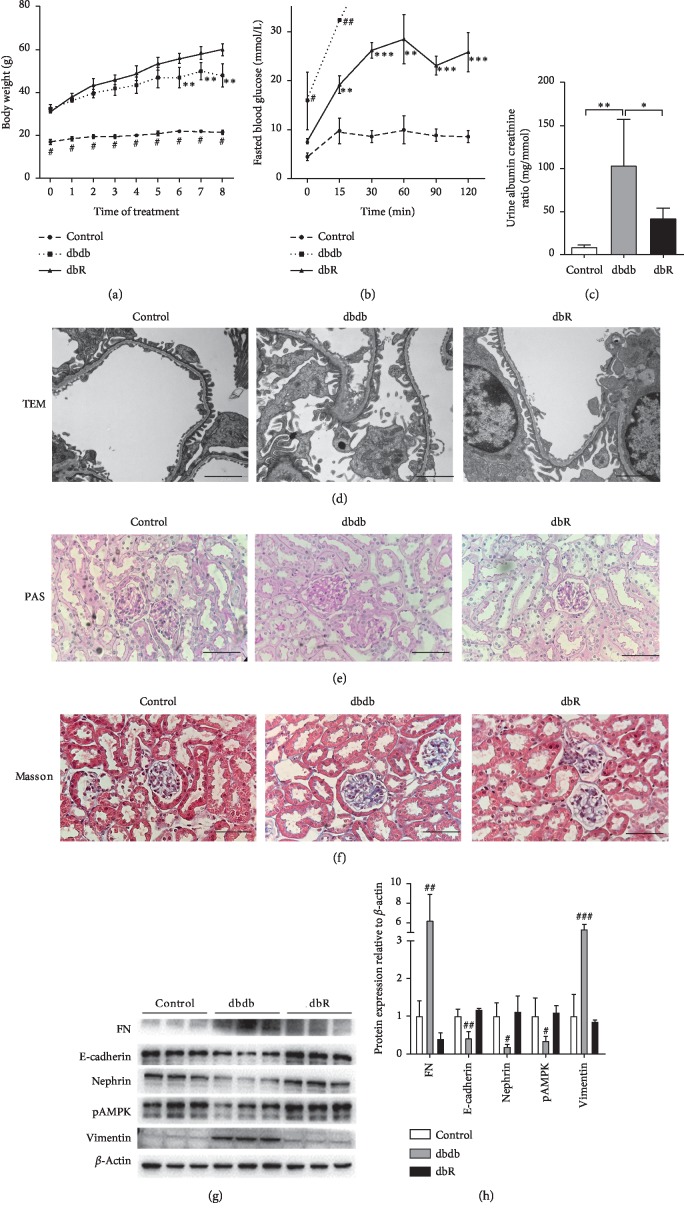
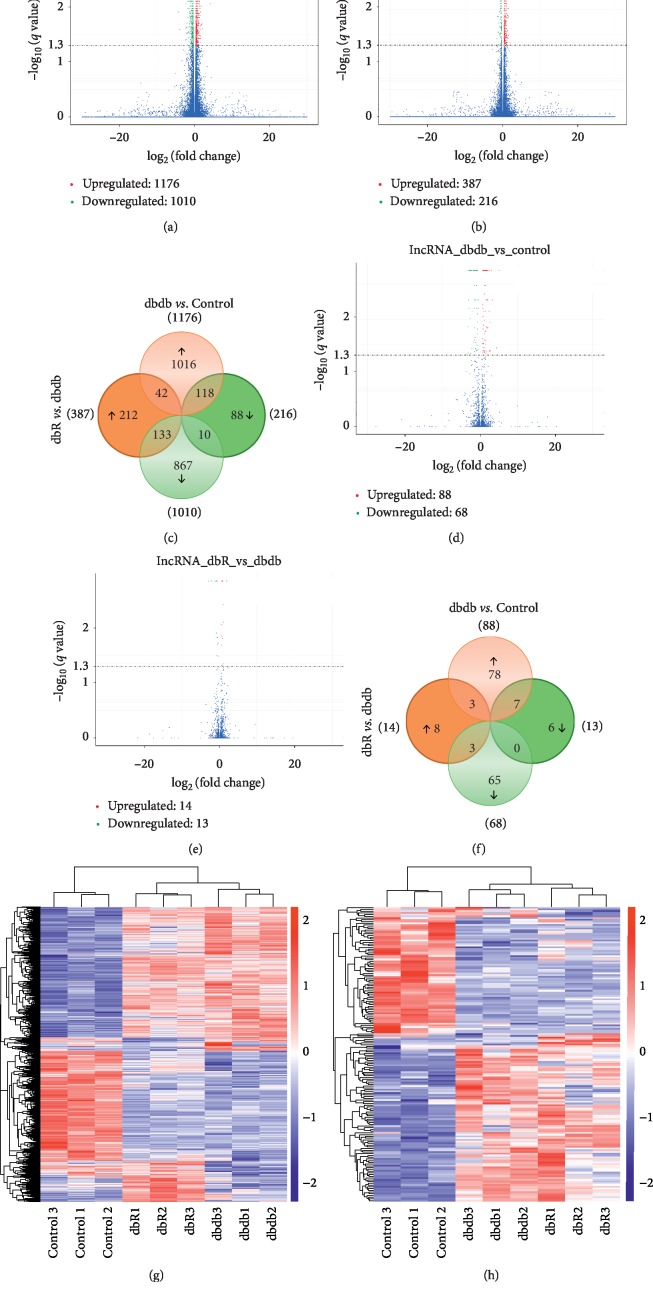
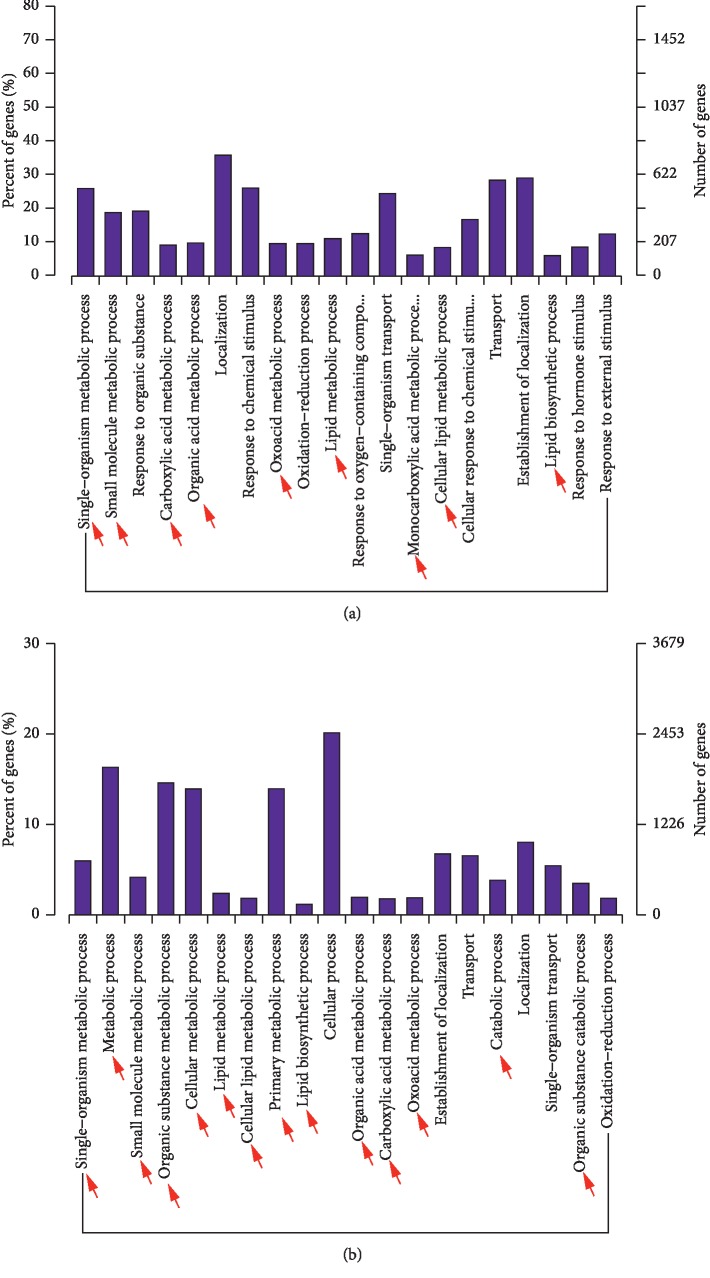
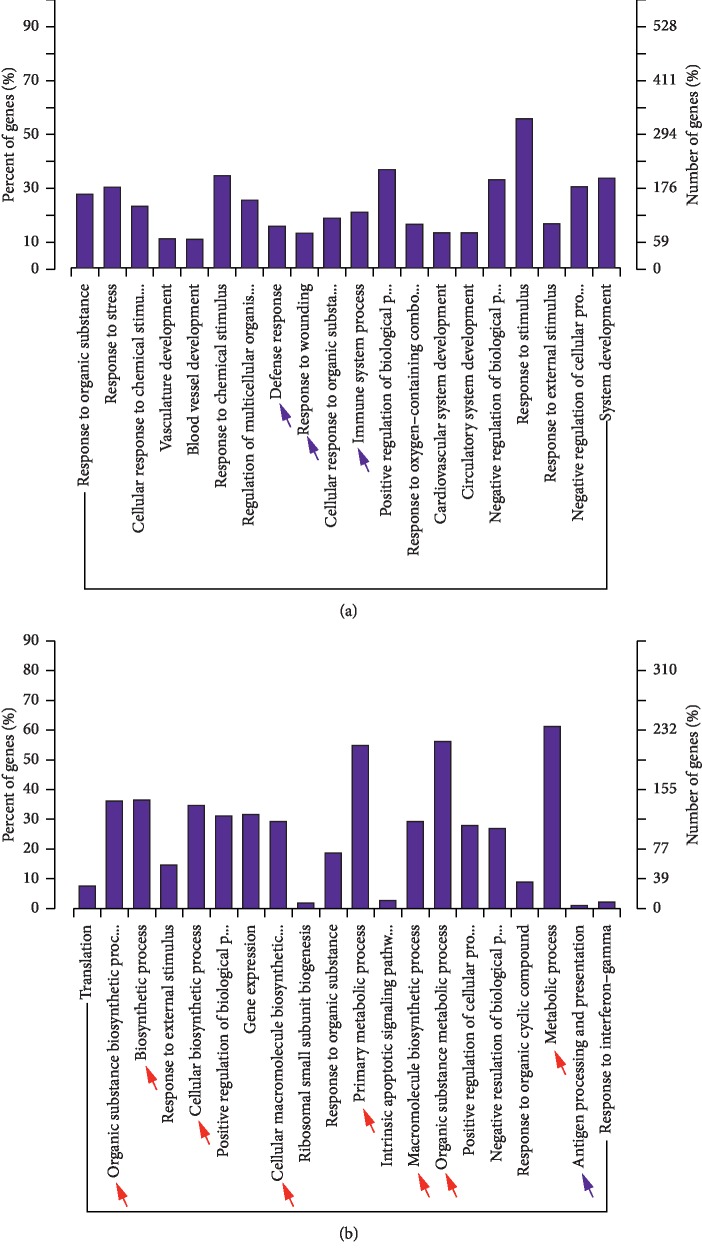
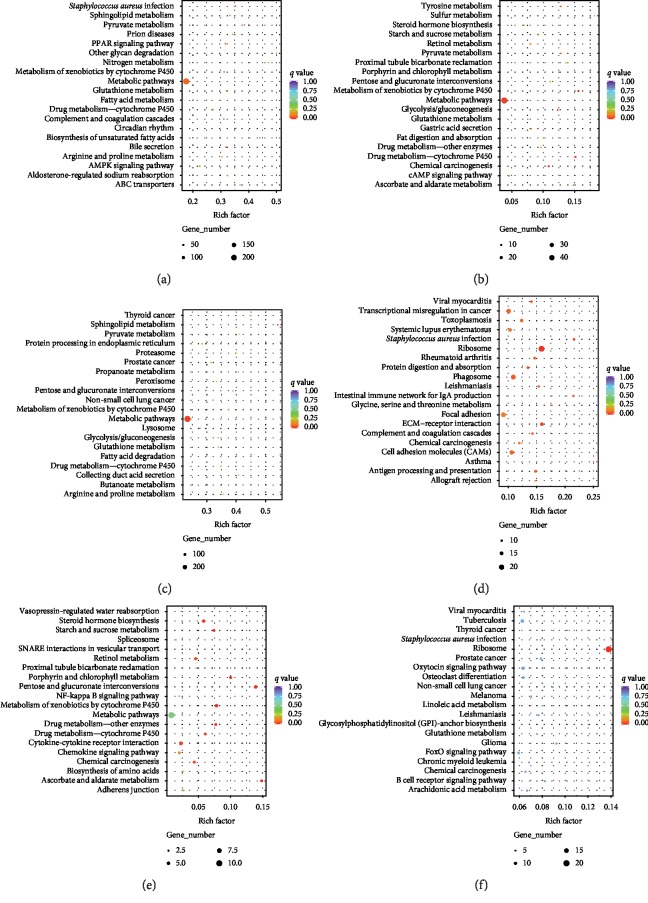
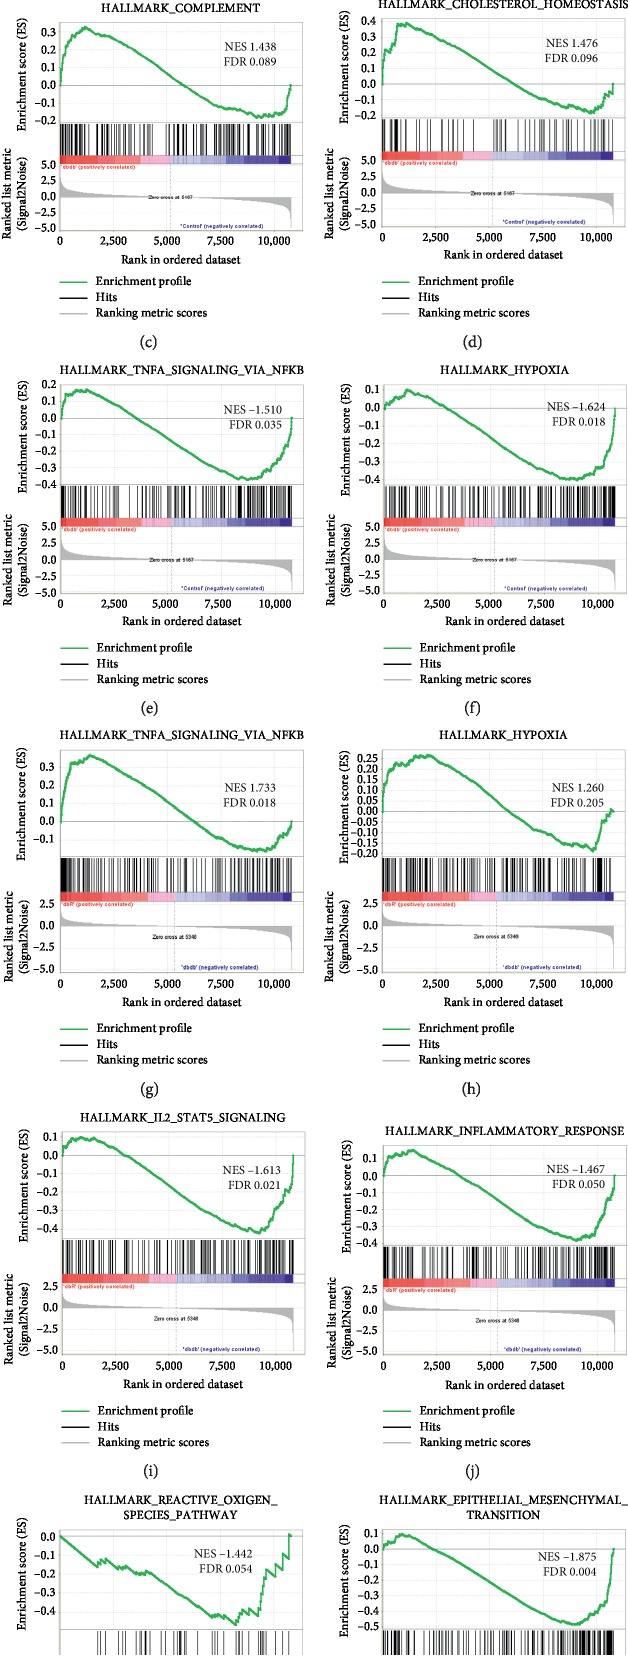
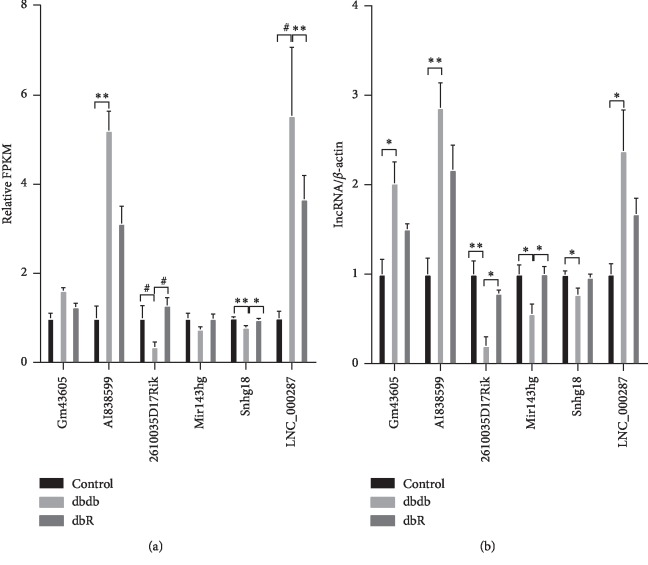
Diabetic nephropathy (DN) is characterized by metabolic disorder and inflammation. However, the regulatory effects that long noncoding RNAs (lncRNAs) have on the pathogenesis of DN and on the efficacy of rosiglitazone treatment have yet to be clearly defined. Herein, we performed unbiased RNA sequencing to characterize the transcriptomic profiles in db/db diabetic mouse model with or without rosiglitazone treatment that served to improve the phenotypes of DN. Moreover, RNA-seq profiling revealed that the development of DN caused an upregulation in the expression of 1176 mRNAs and a downregulation in the expression of 1010 mRNAs compared to controls, with the expression of 251 mRNAs being returned to normal following treatment with rosiglitazone. Further, 88 upregulated and 68 downregulated lncRNAs were identified in db/db mice compared to controls, 10 of which had their normal expression restored following treatment with rosiglitazone. Bioinformatic analysis revealed that the primary pathways involved in the pathogenesis of DN, and subsequently in the therapeutic effects of PPARγ, are related to inflammatory and metabolic processes. From bioinformatics analysis, lncRNA-AI838599 emerged as a novel molecular mechanism for rosiglitazone treatment in DN through TNFα-NFκb pathway. These findings may indicate a new molecular regulatory approach for the development of DN therapeutic agents.


Conflict of interest statement

All authors declare that they have no conflicts of interest.

Figures

Figure 1
Figure 1
Rosiglitazone treatment protected against diabetic nephropathy in db/db mice. (a) Body weight levels were evaluated weekly in the control, dbdb, and dbR groups. Data are presented as the mean ± SEM (n = 6 per group). #P < 0.001 compared to the other groups at the same time point, ∗∗P < 0.01 compared to dbR at the same time point. (b) Intraperitoneal glucose tolerance test (IPGTT) in rosiglitazone-treated and untreated control and db/db mice. After eight weeks of treatment with rosiglitazone, mice were fasted for 16 hours and injected with glucose (1.5 g/kg I.P). Blood glucose levels were measured at 0 min, 15 min, 30 min, 60 min, 90 min, and 120 min after injection. The data omitted in the dbdb group are due to blood glucose levels above the upper limit of instrument detection. ∗∗P < 0.01 compared to the control group; ∗∗∗P < 0.001 compared to the control group; #P < 0.05 compared to the other two groups; ##P < 0.01 compared to the other two groups. Data are represented as mean ± SEM. n = 6 per group. (c) After 8 weeks of treatment, urinary albumin creatine ration (ACR) in control, dbdb, and dbR mice was determined. n = 6 per group. P < 0.05, ∗∗P < 0.01, as indicated. Representative photomicrographs depicting (d) transmission electron microscope (TEM), (e) periodic acid-Schiff (PAS) staining, and (f) Masson's trichome staining in the control, dbdb, and dbR groups after the 8-week experimental period. Scale bars: (d) 2 μm and (e, f) 50 μm. (f) Western blot analysis of fibronectin (FN), E-cadherin, nephrin, pAMPK, vimentin, and β-actin expression in the renal cortices of control, dbdb and dbR mice. (g) Densitometric analysis of western blot results. (h) Relative band intensity was normalized to the β-actin signal. Data are presented as the mean ± SEM (n = 6 per group). #P < 0.05, ##P < 0.01, ###P < 0.001, as compared to the other groups.
Figure 2
Figure 2
Differentially expressed mRNAs and lncRNAs in the renal cortices of diabetic nephropathic mice. Volcano plot for comparison of (a) mRNA expression between the dbdb and control group, (b) mRNA expression between the dbR and dbdb group, (d) lncRNA expression between the dbdb and control group, and (e) lncRNA expression between the dbR and dbdb group. On the right side, the red color is indicative of the upregulated genes (q < 0.05); on the left side, the green color is indicative of the downregulated gene (q < 0.05). The blue points indicate mRNAs that were not statistically significant (q > 0.05). Venn diagrams illustrate the number of significantly differentially expressed (c) mRNAs and (f) lncRNAs. The overlapping areas represent the coregulated genes in both dbdb/control and dbR/dbdb analyses. Differentially expressed (g) mRNAs and (h) lncRNAs (q < 0.05) in dbdb/control or dbR/dbdb analyses were assessed using hierarchical clustering. Each row represents a single gene expression, and each column represents one tissue sample.
Figure 3
Figure 3
GO analysis of differentially expressed mRNAs. GO term enrichment analysis of regulated genes as they relate to biological processes for (a) dbdb compared to the control mice and (b) dbR compared to the dbdb mice. GO, Gene Ontology; BP, biological process.
Figure 4
Figure 4
GO analysis of differentially expressed lncRNAs coexpressed with mRNAs. GO term enrichment analysis of regulated lncRNAs coexpressed with mRNAs as they relate to biological processes for (a) dbdb compared to the control mice and (b) dbR compared to the dbdb mice. GO, Gene Ontology; BP, biological process.
Figure 5
Figure 5
KEGG enrichment scatter plot of differentially expressed genes. The top 20 significantly enriched KEGG pathways associated with differentially expressed mRNAs for (a) dbdb compared to the control group and (d) dbR compared to the dbdb group. The top 20 significantly enriched KEGG pathways associated with differentially expressed lncRNAs colocated with mRNAs for (b) dbdb compared to the control group and (e) dbR compared to the dbdb group. The top 20 significantly enriched KEGG pathways associated with differentially expressed lncRNAs coexpressed with mRNAs for (c) dbdb compared to the control group and (f) dbR compared to the dbdb group. Notes: rich factor: input number/background number. Input number: number of corresponding genes associated with differential mRNAs enriched in the KEGG pathway and background number: number of genes in the pathway.
Figure 6
Figure 6
Representative significantly enriched gene sets from GSEA for the global mRNA expression profile. Upregulated gene sets identified in dbdb mice (a–d) and upregulated genes in control mice (e, f) following analysis of dbdb compared to control groups. Upregulated gene sets in dbR mice (g, h), and upregulated genes in dbdb mice (i–l) following analysis of dbR compared to dbdb group. In every thumbnail, the green curve represents the evolution of the density of the genes identified in the RNA-seq. The false discovery rate (FDR) is calculated by comparing the actual data with 1000 Monte Carlo simulations. The NES (normalized enrichment score) computes the density of modified genes in the dataset with the random expectancies, normalized by the number of genes found in a given gene cluster, to account for the size of the cluster.
Figure 7
Figure 7
Differential expression of lncRNAs validated by qRT-PCR. (a) The relative expression of lncRNAs as identified via RNA-seq analysis. The fragments per kilobase of exon per million mapped reads (FPKM) values in the control group were normalized to 1, and the relative expressions in the dbdb and dbR groups are shown. P < 0.05, ∗∗P < 0.01, and #P < 0.001, as indicated. (b) The relative expressions of lncRNAs in qRT-PCR were validated in the control, dbdb, and dbR mice (n = 6 for each group). P < 0.05, ∗∗P < 0.01.

References

    1. Koye D. N., Magliano D. J., Nelson R. G., Pavkov M. E. The global epidemiology of diabetes and kidney disease. Advances in Chronic Kidney Disease. 2018;25(2):121–132. doi: 10.1053/j.ackd.2017.10.011. - DOI - PMC - PubMed
    1. Ma R. C. W. Epidemiology of diabetes and diabetic complications in China. Diabetologia. 2018;61(6):1249–1260. doi: 10.1007/s00125-018-4557-7. - DOI - PubMed
    1. Bichu P., Nistala R., Khan A., Sowers J. R., Whaley-Connell A. Angiotensin receptor blockers for the reduction of proteinuria in diabetic patients with overt nephropathy: results from the AMADEO study. Vascular Health and Risk Management. 2008;5(1):129–140. doi: 10.2147/vhrm.s3121. - DOI - PMC - PubMed
    1. Kanwar Y. S., Wada J., Sun L., et al. Diabetic nephropathy: mechanisms of renal disease progression. Experimental Biology and Medicine. 2008;233(1):4–11. doi: 10.3181/0705-mr-134. - DOI - PubMed
    1. Perkovic V., Jardine M. J., Neal B, et al. Canagliflozin and renal outcomes in type 2 diabetes and nephropathy. New England Journal of Medicine. 2019;380(24):2295–2306. doi: 10.1056/NEJMoa1811744. - DOI - PubMed