

Individual-patient prediction of meningioma malignancy and survival using the Surveillance, Epidemiology, and End Results database
- PMID: 32025573
- PMCID: PMC6992687
- DOI: 10.1038/s41746-020-0219-5
Individual-patient prediction of meningioma malignancy and survival using the Surveillance, Epidemiology, and End Results database
Abstract
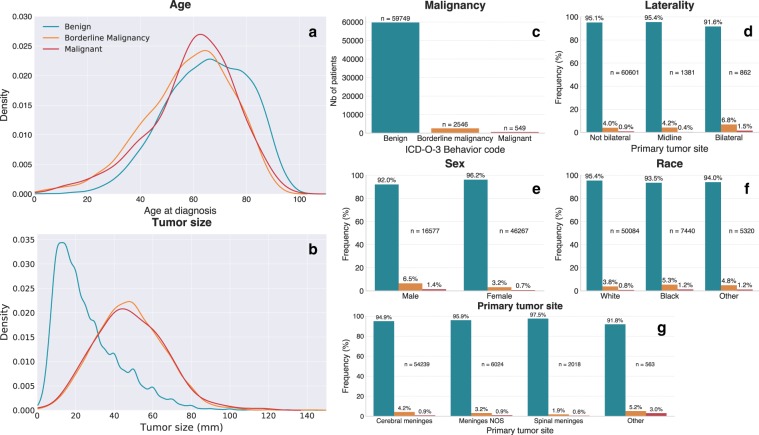
Meningiomas are known to have relatively lower aggressiveness and better outcomes than other central nervous system (CNS) tumors. However, there is considerable overlap between clinical and radiological features characterizing benign, atypical, and malignant tumors. In this study, we developed methods and a practical app designed to assist with the diagnosis and prognosis of meningiomas. Statistical learning models were trained and validated on 62,844 patients from the Surveillance, Epidemiology, and End Results database. We used balanced logistic regression-random forest ensemble classifiers and proportional hazards models to learn multivariate patterns of association between malignancy, survival, and a series of basic clinical variables-such as tumor size, location, and surgical procedure. We demonstrate that our models are capable of predicting meaningful individual-specific clinical outcome variables and show good generalizability across 16 SEER registries. A free smartphone and web application is provided for readers to access and test the predictive models (www.meningioma.app). Future model improvements and prospective replication will be necessary to demonstrate true clinical utility. Rather than being used in isolation, we expect that the proposed models will be integrated into larger and more comprehensive models that integrate imaging and molecular biomarkers. Whether for meningiomas or other tumors of the CNS, the power of these methods to make individual-patient predictions could lead to improved diagnosis, patient counseling, and outcomes.
Keywords: CNS cancer; Cancer epidemiology; Predictive markers.
© The Author(s) 2020.
Conflict of interest statement
Competing interestsThe authors declare no competing interests.
Figures


Similar articles
-
Determining the role of adjuvant radiotherapy in the management of meningioma: a Surveillance, Epidemiology, and End Results analysis.Neurosurg Focus. 2019 Jun 1;46(6):E3. doi: 10.3171/2019.3.FOCUS1971. Neurosurg Focus. 2019. PMID: 31153148
-
Epidemiology of meningiomas post-Public Law 107-206: The Benign Brain Tumor Cancer Registries Amendment Act.Cancer. 2015 Jul 15;121(14):2400-10. doi: 10.1002/cncr.29379. Epub 2015 Apr 14. Cancer. 2015. PMID: 25872752 Free PMC article.
-
Deep learning models for predicting the survival of patients with hepatocellular carcinoma based on a surveillance, epidemiology, and end results (SEER) database analysis.Sci Rep. 2024 Jun 9;14(1):13232. doi: 10.1038/s41598-024-63531-9. Sci Rep. 2024. PMID: 38853169 Free PMC article.
-
Meningioma: A Review of Epidemiology, Pathology, Diagnosis, Treatment, and Future Directions.Biomedicines. 2021 Mar 21;9(3):319. doi: 10.3390/biomedicines9030319. Biomedicines. 2021. PMID: 33801089 Free PMC article. Review.
-
Meta-analysis of adjuvant radiotherapy for intracranial atypical and malignant meningiomas.J Neurooncol. 2021 Apr;152(2):205-216. doi: 10.1007/s11060-020-03674-7. Epub 2021 Feb 26. J Neurooncol. 2021. PMID: 33635510 Review.
Cited by
-
De Novo Glioblastoma Masqueraded within a Hemispheric Dural Meningiomatosis: Rare Imaging Findings and Rationale for Two-Staged Resection.J Neurol Surg Rep. 2022 Jun 1;83(2):e44-e49. doi: 10.1055/s-0042-1749215. eCollection 2022 Apr. J Neurol Surg Rep. 2022. PMID: 35693250 Free PMC article.
-
Prognostic Factors and Treatment Strategies for Elderly Patients with Malignant Meningioma: A SEER Population-Based Study.Front Oncol. 2022 May 13;12:913254. doi: 10.3389/fonc.2022.913254. eCollection 2022. Front Oncol. 2022. PMID: 35646660 Free PMC article.
-
Trends in the use of radiation for meningioma across the United States.Radiat Oncol J. 2022 Mar;40(1):29-36. doi: 10.3857/roj.2021.00563. Epub 2022 Mar 15. Radiat Oncol J. 2022. PMID: 35368198 Free PMC article.
-
A generalizable and interpretable model for mortality risk stratification of sepsis patients in intensive care unit.BMC Med Inform Decis Mak. 2023 Sep 15;23(1):185. doi: 10.1186/s12911-023-02279-0. BMC Med Inform Decis Mak. 2023. PMID: 37715194 Free PMC article.
-
Machine learning for predicting post-operative outcomes in meningiomas: a systematic review and meta-analysis.Acta Neurochir (Wien). 2024 Dec 17;166(1):505. doi: 10.1007/s00701-024-06344-z. Acta Neurochir (Wien). 2024. PMID: 39688716 Free PMC article.
References
-
- National Cancer Institute. Overview of the SEER Program. Available at: https://seer.cancer.gov/about/overview.html. Accessed in 2019.
Grants and funding
LinkOut - more resources
Full Text Sources
