. 2020 Feb 1;9(2):giaa007.
doi: 10.1093/gigascience/giaa007.

Genomic diversity affects the accuracy of bacterial single-nucleotide polymorphism-calling pipelines

Affiliations

Genomic diversity affects the accuracy of bacterial single-nucleotide polymorphism-calling pipelines

Stephen J Bush et al. Gigascience. .

Abstract

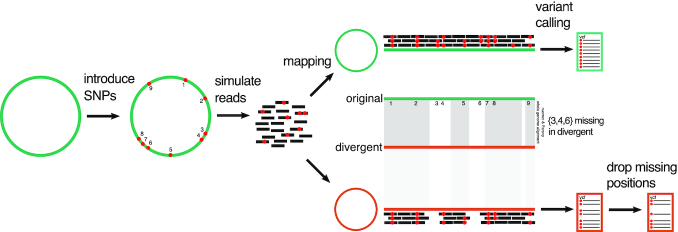
Background: Accurately identifying single-nucleotide polymorphisms (SNPs) from bacterial sequencing data is an essential requirement for using genomics to track transmission and predict important phenotypes such as antimicrobial resistance. However, most previous performance evaluations of SNP calling have been restricted to eukaryotic (human) data. Additionally, bacterial SNP calling requires choosing an appropriate reference genome to align reads to, which, together with the bioinformatic pipeline, affects the accuracy and completeness of a set of SNP calls obtained. This study evaluates the performance of 209 SNP-calling pipelines using a combination of simulated data from 254 strains of 10 clinically common bacteria and real data from environmentally sourced and genomically diverse isolates within the genera Citrobacter, Enterobacter, Escherichia, and Klebsiella.

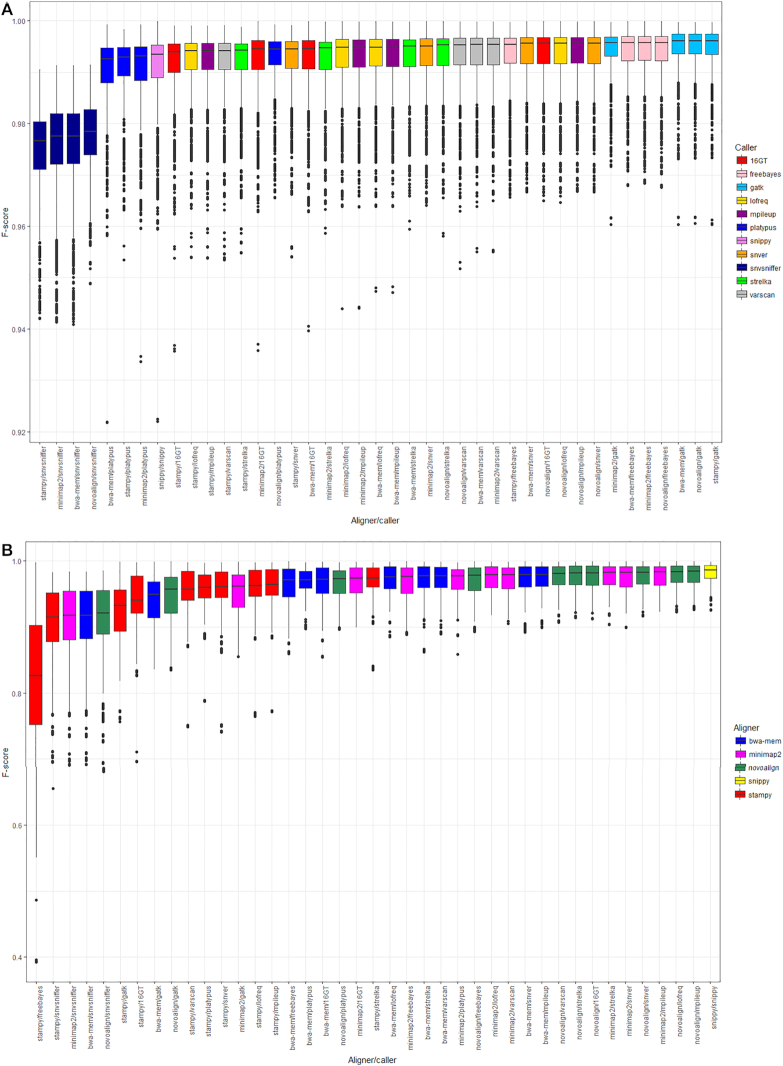
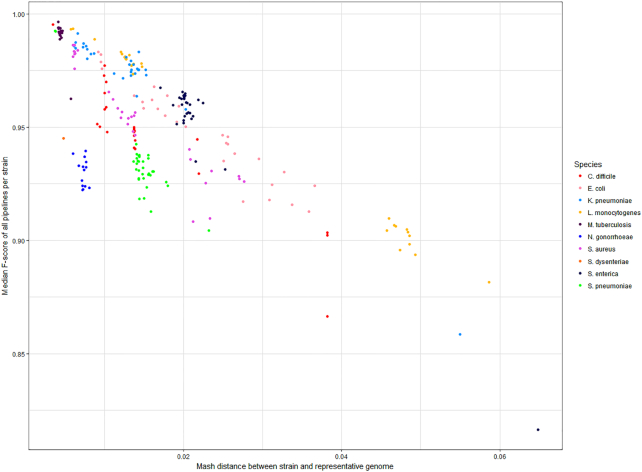
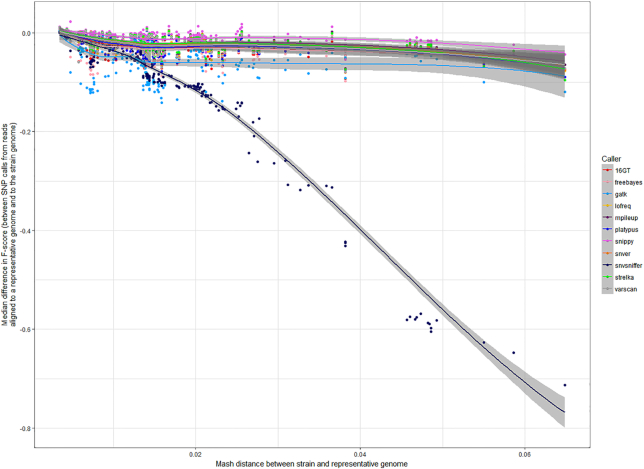
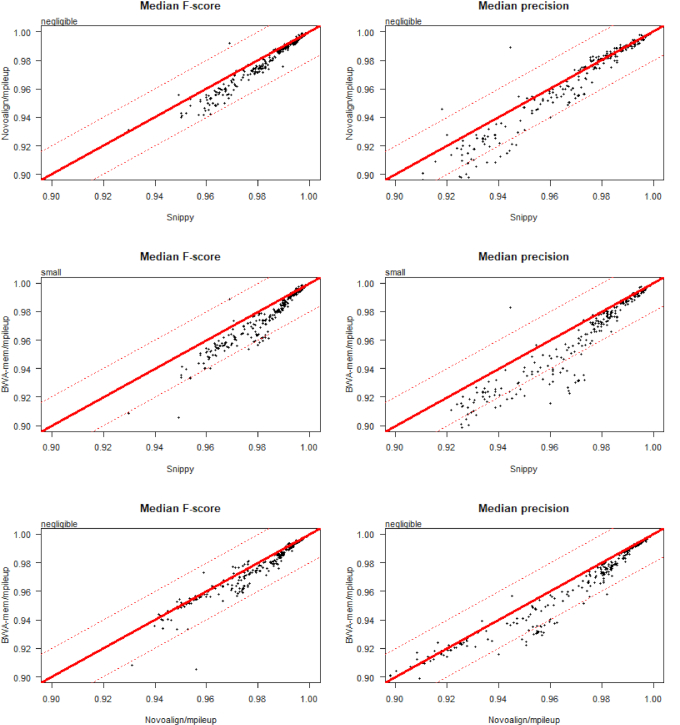
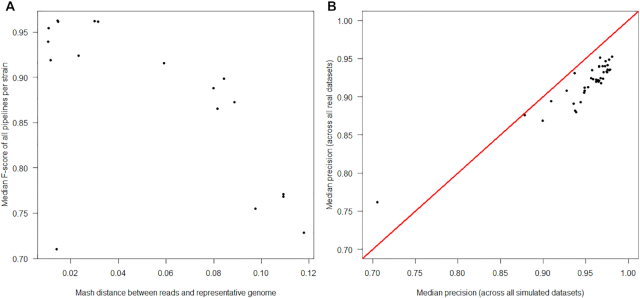
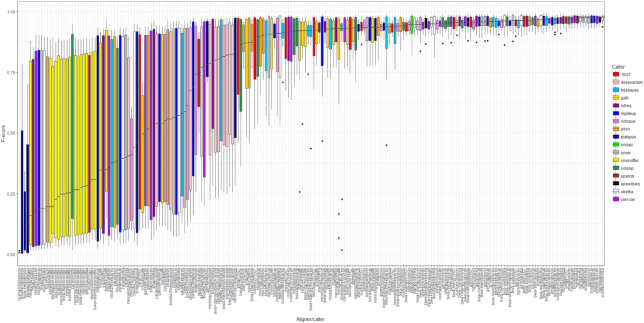
Results: We evaluated the performance of 209 SNP-calling pipelines, aligning reads to genomes of the same or a divergent strain. Irrespective of pipeline, a principal determinant of reliable SNP calling was reference genome selection. Across multiple taxa, there was a strong inverse relationship between pipeline sensitivity and precision, and the Mash distance (a proxy for average nucleotide divergence) between reads and reference genome. The effect was especially pronounced for diverse, recombinogenic bacteria such as Escherichia coli but less dominant for clonal species such as Mycobacterium tuberculosis.

Conclusions: The accuracy of SNP calling for a given species is compromised by increasing intra-species diversity. When reads were aligned to the same genome from which they were sequenced, among the highest-performing pipelines was Novoalign/GATK. By contrast, when reads were aligned to particularly divergent genomes, the highest-performing pipelines often used the aligners NextGenMap or SMALT, and/or the variant callers LoFreq, mpileup, or Strelka.

Keywords: SNP calling; bacteria; benchmarking; evaluation; variant calling.


Figures

Figure 1:
Figure 1:
Overview of SNP-calling evaluation. SNPs were introduced in silico into 254 closed bacterial genomes (Supplementary Table 2) using Simulome. Reads were then simulated from these genomes. A total of 41 SNP-calling pipelines (Supplementary Table 1) were evaluated using 2 different genomes for read alignment: the original genome from which the reads were simulated and a divergent genome, the species-representative NCBI “reference genome.” In the latter case, it will not be possible to recover all of the original in silico SNPs because some will be found only within genes unique to the original genome. Accordingly, to evaluate SNP calls, the coordinates of the original genome need to be converted to those of the representative genome. To do so, whole-genome alignments were made using both nucmer and Parsnp, with consensus calls identified within 1-to-1 alignment blocks. Inter-strain SNPs (those not introduced in silico) are excluded. The remaining subset of in silico calls comprise the truth set for evaluation. There is a strong correlation between the total number of SNPs introduced in silico into the original genome and the total number of nucmer/Parsnp consensus SNPs in the divergent genome (Supplementary Figure 3).
Figure 2:
Figure 2:
Median F-score per pipeline when the reference genome for alignment is (A) the same as the source of the reads and (B) a representative genome for that species. Panels show the median F-score of 41 different pipelines when SNPs are called using error-free 150- and 300-bp reads simulated from 254 genomes (of 10 species) at 50-fold coverage. Boxes represent the interquartile range of F-score, with midlines representing the median. Upper and lower whiskers extend, respectively, to the largest and smallest values no further than 1.5x the interquartile range. Data beyond the ends of each whisker are outliers and plotted individually. Pipelines are ordered according to median F-score and coloured according to either the variant caller (A) or aligner (B) in each pipeline. Note that because F-scores are uniformly >0.9 when the reference genome for alignment is the same as the source of the reads, the vertical axes on each panel have different scales. Genomes are detailed in Supplementary Table 2, summary statistics for each pipeline in Supplementary Tables 3 and 6, and performance ranks in Supplementary Tables 4 and 7, for alignments to the same or to a representative genome, respectively.
Figure 3:
Figure 3:
Reduced performance of SNP-calling pipelines with increasing genetic distance between the reads and the reference genome. The median F-score across the complete set of 41 pipelines, per strain, decreases as the distance between the strain and the reference genome increases (assayed as the Mash distance, which is based on the proportion of k-mers shared between genomes). Each point indicates the median F-score, across all pipelines, for the genome of 1 strain per species (n = 254 strains). Points are coloured by the species of each strain (n = 10 species). Summary statistics for each pipeline are shown in Supplementary Table 6, performance ranks in Supplementary Table 7, and the genetic distance between strains in Supplementary Table 2. Quantitatively similar results are seen if assaying distance as the total number of SNPs between the strain and representative genome, i.e., the set of strain-specific in silico SNPs plus inter-strain SNPs (Supplementary Figure 1).
Figure 4:
Figure 4:
Stability of pipeline performance, in terms of F-score, with increasing genetic distance between the reads and the reference genome. The performance of an SNP-calling pipeline decreases with increasing distance between the genome from which reads are sequenced and the reference genome to which they are aligned. Each point shows the median difference in F-score for a pipeline that calls SNPs when the reference genome is the same as the source of the reads, and when it is instead a representative genome for that species. Points are coloured according to the variant caller in each pipeline, with those towards the top of the figure less affected by distance. Lines fitted using LOESS smoothing, with the grey band representing the 0.95 confidence interval.
Figure 5:
Figure 5:
Head-to-head performance comparison of 3 pipelines using simulated data, on the basis of precision, recall, and F-score. This figure directly compares the performance of 3 pipelines using simulated data: Snippy, Novoalign/mpileup, and BWA/mpileup. Each point indicates the median F-score, precision, or recall, for the genome of 1 strain per species (n = 254 strains). Raw data for this figure are given in Supplementary Table 6. Text in the top left of each figure is an interpretation of the difference between each pair of distributions, obtained using the R package “effsize,” which applies the non-parametric effect size estimator Cliff delta to the results of a Mann-Whitney U test. The line y = x is shown in solid red. The lines y+0.02 = x and y-0.02 = x are shown in dotted red. An expanded version of this figure, comparing 40 pipelines relative to Snippy, is given as Supplementary Figure 4.
Figure 6:
Figure 6:
Similarity of performance for pipelines evaluated using both simulated and real sequencing data. Panel A shows that pipelines evaluated using real sequencing data show reduced performance with increasing Mash distances between the reads and the reference genome, similar to that observed with simulated data (see Figure 3A). Each point indicates the median F-score, across all pipelines, for the genome of an environmentally sourced/reference isolate (detailed in Supplementary Table 8). Panel B shows that pipelines evaluated using real and simulated sequencing data have comparable accuracy. Each point shows the median precision of each of 41 pipelines, calculated across both a divergent set of 254 simulated genomes (2–36 strains from 10 clinically common species) and 18 real genomes (isolates of Citrobacter, Enterobacter, Escherichia, and Klebsiella). The outlier pipeline, with lowest precision on both real and simulated data, is Stampy/Freebayes. Raw data for this figure are available in Supplementary Tables 6 (simulated genomes) and 9 (real genomes).
Figure 7:
Figure 7:
Median F-score per pipeline using real sequencing data, and when the reference genome for alignment can diverge considerably from the source of the reads. This figure shows the F-score distribution of 209 pipelines evaluated using real sequencing data sourced from the REHAB project and detailed in [63]. This dataset comprises 16 environmentally sourced gram-negative isolates (all Enterobacteriaceae), and cultures of 2 reference strains (K. pneumoniae subsp. pneumoniae MGH 78,578 and E. coli CFT073). For this figure, data from 1 outlier, E. coli isolate RHB11-C04, were excluded. Raw data for this figure are available as Supplementary Table 9, with summary statistics for each pipeline detailed in Supplementary Table 10. Genomes are detailed in Supplementary Table 8. Boxes represent the interquartile range of F-score, with midlines representing the median. Upper and lower whiskers extend, respectively, to the largest and smallest values no further than 1.5x the interquartile range. Data beyond the ends of each whisker are outliers and plotted individually.

References

    1. Taylor AJ, Lappi V, Wolfgang WJ, et al.. Characterization of foodborne outbreaks of Salmonella enterica serovar enteritidis with whole-genome sequencing single nucleotide polymorphism-based analysis for surveillance and outbreak detection. J Clin Microbiol. 2015;53(10):3334–40. - PMC - PubMed
    1. Hendriksen RS, Price LB, Schupp JM, et al.. Population genetics of Vibrio cholerae from Nepal in 2010: evidence on the origin of the Haitian outbreak. mBio. 2011;2(4): e00157–11. - PMC - PubMed
    1. Caspar SM, Dubacher N, Kopps AM, et al.. Clinical sequencing: from raw data to diagnosis with lifetime value. Clin Genet. 2018;93(3):508–19. - PubMed
    1. Altmann A, Weber P, Bader D, et al.. A beginners guide to SNP calling from high-throughput DNA-sequencing data. Hum Genet. 2012;131(10):1541–54. - PubMed
    1. Reinert K, Langmead B, Weese D, et al.. Alignment of next-generation sequencing reads. Annu Rev Genom Hum Genet. 2015;16:133–51. - PubMed

Publication types

MeSH terms