

Muscle-derived GDF15 drives diurnal anorexia and systemic metabolic remodeling during mitochondrial stress
- PMID: 32026535
- PMCID: PMC7054681
- DOI: 10.15252/embr.201948804
Muscle-derived GDF15 drives diurnal anorexia and systemic metabolic remodeling during mitochondrial stress
Abstract
Mitochondrial dysfunction promotes metabolic stress responses in a cell-autonomous as well as organismal manner. The wasting hormone growth differentiation factor 15 (GDF15) is recognized as a biomarker of mitochondrial disorders, but its pathophysiological function remains elusive. To test the hypothesis that GDF15 is fundamental to the metabolic stress response during mitochondrial dysfunction, we investigated transgenic mice (Ucp1-TG) with compromised muscle-specific mitochondrial OXPHOS capacity via respiratory uncoupling. Ucp1-TG mice show a skeletal muscle-specific induction and diurnal variation of GDF15 as a myokine. Remarkably, genetic loss of GDF15 in Ucp1-TG mice does not affect muscle wasting or transcriptional cell-autonomous stress response but promotes a progressive increase in body fat mass. Furthermore, muscle mitochondrial stress-induced systemic metabolic flexibility, insulin sensitivity, and white adipose tissue browning are fully abolished in the absence of GDF15. Mechanistically, we uncovered a GDF15-dependent daytime-restricted anorexia, whereas GDF15 is unable to suppress food intake at night. Altogether, our evidence suggests a novel diurnal action and key pathophysiological role of mitochondrial stress-induced GDF15 in the regulation of systemic energy metabolism.
Keywords: GDF15; anorexia; integrated stress response; mitochondrial dysfunction; muscle wasting.
© 2020 The Authors. Published under the terms of the CC BY 4.0 license.
Conflict of interest statement
The authors declare that they have no conflict of interest.
Figures

- A
Schematic representation of HSA‐Ucp1‐transgenic (TG) mouse line as model of compromised skeletal muscle‐specific mitochondrial OXPHOS capacity via respiratory uncoupling.
- B
Uncoupled (LEAK) mitochondrial respiration of soleus (SOL) and extensor digitorum longus (EDL) muscle of wild‐type (WT) versus Ucp1‐TG (TG) mice (WT n = 9, TG n = 5).
- C
Relative mRNA expression in quadriceps (Quad) of ISR components (n = 8 per genotype).
- D, E
Representative immunoblots of ISR component eIF2α and quantification of phospho‐eIF2α (p‐eIF2aSer51) relative protein expression in quadriceps skeletal muscle (WT n = 3, TG n = 4).
- F, G
Multi‐tissue transcriptomic profiling of Gdf15 gene expression. Heatmap is shown as raw ct expression values (n = 4 per genotype). Quantification of Gdf15 mRNA expression in TG mice is shown as fold change compared to WT littermates (WT n = 5, TG n = 4).
- H
Skeletal muscle (Quad and Gastroc) GDF15 protein content normalized to total protein content (WT n = 9, TG n = 18).
- I
Ex vivo secretion of GDF15 from SOL and EDL muscle of WT versus TG mice (n = 6 per genotype) after 2‐h incubation normalized to muscle wet weight (mg).
- J
Mouse GDF15 plasma levels in post‐absorptive state of male and female WT versus TG mice at 20 weeks of age (male WT n = 8, TG n = 9; female WT n = 5, TG n = 6).
- K
Mouse GDF15 plasma levels in post‐absorptive state of male WT versus TG mice fed low‐fat diet (LFD) or high‐fat diet (HFD) at 24 weeks of age (LFD WT n = 6, TG n = 5; HFD WT n = 5, TG n = 5).
- L
Mouse GDF15 plasma levels in post‐absorptive state of young (10 weeks) versus old (95 weeks) male WT and TG mice (young WT n = 10, TG n = 13; old WT n = 13, TG n = 13).
- M
Representative scheme of in vitro study design in differentiated C2C12 myocytes.
- N
Gdf15 gene expression of differentiated C2C12 myotubes treated with vehicle control (Ctrl) or chemical mitochondrial uncoupler (FCCP, 1 μM versus 5 μM) for 5 h (n = 3 biological replicates).

- A
Genotyping PCR panel of Gdf15 and HSA‐Ucp1 loci shown for wild‐type (WT), Gdf15‐KO (KO), Ucp1‐TG (TG), and Ucp1‐TGxGdf15‐KO (TGxKO) mice.
- B
Relative mRNA expression in quadriceps (Quad) of Ucp1 and Gdf15 in 20‐week‐old male WT (n = 8), TG (n = 7), and TGxKO (n = 6) mice.
- C
Plasma mGDF15 levels at 20 weeks of age (WT n = 9, TG n = 10, TGxKO n = 9).
- D
Voluntary wheel running (VWR) activity shown hourly over 24 h at 15 weeks of age (n = 4 per genotype).
- E
Grip strength at 10–20 weeks of age (WT n = 15, TG n = 14, TGxKO n = 11).
- F
Skeletal muscle mass relative to body lean mass of quadriceps (Quad) and gastrocnemius (Gastroc) from mice at 95 weeks of age (WT n = 8, TG n = 5, TGxKO n = 5).
- G, H
Representative H&E histological staining of tibialis anterior (TA) muscle (G) (scale bars represent 50 μm), and cross‐sectional area (CSA) of myofibers (H) at 95 weeks (WT n = 12, TG n = 8, TGxKO n = 8).
- I
Representative traces of oxygen consumption rate (OCR) during substrate–uncoupler–inhibitor titration (SUIT) protocol for mitochondrial respiratory capacity in permeabilized mouse soleus muscle fibers, PM (pyruvate+malate; LEAK respiration), ADP (OXPHOS capacity), Cyt c (cytochrome c, integrity of outer mt‐membrane), G (glutamate;), S (succinate), U (uncoupler, FCCP), Rot (rotenone), and Ama (antimycin A; less than 2% residual oxygen consumption, ROX).
- J–L
Mitochondrial respiratory capacity (oxygen consumption rate, OCR) from oxidative soleus (SOL) (J) and glycolytic extensor digitorum longus (EDL) muscle fibers (K), and NetOXPHOS control ratio of 95‐week‐old mice (L) (n = 5 per genotype).
- M
Quadriceps (Quad) relative mRNA expression of ISR components at 95 weeks of age (WT n = 8, TG n = 5, TGxKO n = 5).
- N
Representative immunoblots of ISR component eIF2α in quadriceps (Quad) muscle of 95‐week‐old mice.
- O
Gastrocnemius enzyme activity of NAD(P)H quinone dehydrogenase 1 (NQO1) and total glutathione peroxidase (GPX) in 95‐week‐old male mice (WT n = 8, TG n = 5, TGxKO n = 5).

- A
Plasma GDF15 levels at 20 weeks of age (WT n = 9, KO n = 9).
- B
Voluntary wheel running (VWR) activity shown hourly over 24 h at 15 weeks of age (n = 4 per genotype).
- C
Grip strength at 10–20 weeks of age (WT n = 15, KO n = 14).
- D
Skeletal muscle mass relative to body lean mass of quadriceps (Quad), gastrocnemius (Gastroc), soleus, and EDL (WT n = 9, KO = 10).
- E
Representative H&E histological staining of tibialis anterior (TA) muscle (G) (scale bars represent 50 μm)
- F–H
Mitochondrial respiratory capacity (oxygen consumption rate, OCR) from oxidative soleus (SOL) (F) and glycolytic extensor digitorum longus (EDL) muscle fibers (G), and NetOXPHOS control ratio (H) (n = 5 per genotype).
- I, J
Representative immunoblots of OXPHOS in quadriceps (Quad) muscle (I) and their corresponding quantifications normalized to MFN2 (J) (n = 6 per genotype).
- K
Skeletal muscle (Quad) relative mRNA expression of ISR components (WT n = 8, KO n = 6).
- L
Representative immunoblots of ISR component eIF2α and phospho‐eIF2α (p‐eIF2aSer51), TG sample was included as positive control.
- M
Skeletal muscle (Gastroc) enzyme activity of NQO1 and GPX (WT n = 8, KO n = 6).

- A
Muscle mass relative to body lean mass of quadriceps (Quad), gastrocnemius (Gastroc), soleus, and extensor digitorum longus (EDL) muscles in 20‐week‐old male mice (WT n = 9, TG, n = 9, TGxKO = 10).
- B, C
Representative H&E histological staining of tibialis anterior (TA) muscle (B), and cross‐sectional area (CSA) of myofibers (C) at 20 weeks (WT n = 8, TG n = 6, TGxKO n = 8), scale bars represent 50 μm.
- D–I
Representative immunoblots and their corresponding quantifications (WT n = 8, TG n = 8, TGxKO n = 8), normalized to ATUB of p‐AMPKThr172/t‐AMPK (D, E), slow myosin (F, G), and OXPHOS (H, I) in quadriceps (Quad) muscle at 20 weeks of age.
- J
Quantification of ISR component eIF2α and of phospho‐eIF2α (p‐eIF2aSer51) relative protein expression in quadriceps skeletal muscle at 95 weeks of age (WT n = 8, TG n = 8, TGxKO n = 8).

- A–C
Body mass (A), body lean mass (B), and body fat mass (C) development.
- D–F
Body mass (D), body lean mass (E), and body fat mass (F) during aging at 20, 45, and 95 weeks of age.
- G, H
Subcutaneous white adipose tissue (sWAT) (G) and epididymal white adipose tissue (eWAT) (H) mass development at 10, 20, 45, and 95 weeks of age.

- A–C
Body mass (A), body lean mass (B), and body fat mass (C) development.
- D–F
Body mass (D), body lean mass (E), and body fat mass (F) during aging at 20, 45, and 95 weeks of age.
- G, H
Subcutaneous white adipose tissue (sWAT) (G) and epididymal white adipose tissue (eWAT) (H) mass development at 20, 45, and 95 weeks of age.

- A, B
Representative H&E histological staining of sWAT at 20 weeks of age (scale bars represent 50 μm) (A) and relative mRNA expression profile in sWAT of male mice (WT n = 7, KO n = 8) (B).
- C
Representative immunoblots of UCP1 protein expression in sWAT of male mice at 20 weeks of age. TG samples were included as positive control.
- D
Relative mRNA expression profile in eWAT (WT n = 7, KO n = 8).
- E
Plasma FGF21 levels from male mice at 20 weeks of age (WT n = 8, KO n = 10).
- F
Plasma Leptin levels from male mice at 20 weeks of age (WT n = 8, KO n = 10).
- G
Post‐absorptive plasma insulin levels at 20 weeks of age (WT n = 8, KO n = 10).
- H–J
Blood glucose (H) and insulin levels (I) with total area under the curve (AUC) of insulin (J) during oral glucose tolerance test (oGTT) at 17 weeks of age (WT n = 5, KO n = 3).

- A, B
Representative H&E histological staining of subcutaneous white adipose tissue (sWAT) at 20 weeks of age (scale bars represent 50 μm) (A) and relative mRNA expression profile in sWAT of male mice (WT n = 7, TG n = 8, TGxKO n = 8) (B).
- C, D
Representative immunoblots (C) and quantification (D) of UCP1 protein expression in sWAT of male mice at 20 weeks of age (WT n = 4, TG n = 6, TGxKO n = 4).
- E
Relative mRNA expression profile in epididymal white adipose tissue (eWAT) (WT n = 7, TG n = 8, TGxKO n = 8).
- F
Plasma FGF21 levels from male mice at 20 weeks of age (n = 10 per genotype).
- G
Plasma Leptin levels from male mice at 20 weeks of age (n = 5 per genotype).
- H
Post‐absorptive plasma insulin levels at 20 weeks of age (WT n = 8, TG n = 9, TG n = 9).
- I–K
Blood glucose (I) and insulin levels (J) with total area under the curve (AUC) of insulin (K) during oral glucose tolerance test (oGTT) at 17 weeks of age (WT n = 8, TG n = 11, TG n = 11).
- A–F
Physical activity (A, B), energy expenditure (C, D), total assimilated energy (E, F) of male mice shown hourly over 24 h and as day and night time.
- G
Table showing mean values of assimilated energy (kJ) at day/night time and per 24 h.
- H
Energy balance calculated as delta of assimilated energy (AE) and energy expenditure (EE) and energy balance (J) per 24 h.
- I
Table showing mean values of energy balance (∆AE‐EE, kJ) at day/night time and per 24 h.
- J–L
Respiratory quotient (RQ) shown hourly over 24 h (J), RQ amplitude (K), and metabolic flexibility via percentage relative cumulative frequency (PRCF) (L).

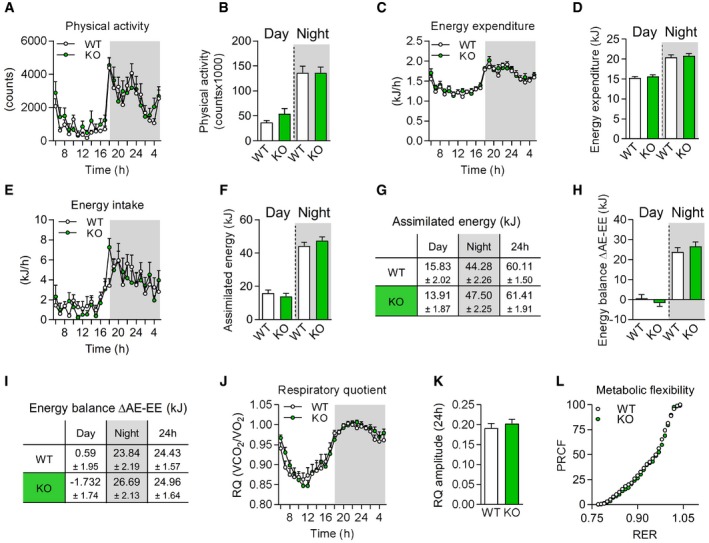
- A–F
Physical activity (A, B), energy expenditure (C, D), total assimilated energy (E, F) of male mice shown hourly over 24 h and as day and night time.
- G
Table showing mean values of assimilated energy (kJ) at day/night time and per 24 h.
- H
Energy balance (kJ) calculated as delta of assimilated energy (AE) and energy expenditure (EE).
- I
Table showing mean values of energy balance (∆AE‐EE, kJ) at day/night time and per 24 h.
- J–L
Respiratory quotient (RQ) shown hourly over 24 h (J), RQ amplitude (K), and metabolic flexibility via percentage relative cumulative frequency (PRCF) (L).

- A
Relative quadriceps (Quad) mRNA expression of the ISR components Atf4, Atf5, Atf6, and Chop (WT day n = 9, WT night n = 5, TG day n = 20, TG night n = 12).
- B, C
Representative immunoblots of ISR component eIF2α (B) and quantification of phospho‐eIF2α (p‐eIF2aSer51) relative protein expression (C) in skeletal muscle (Gastroc, WT day n = 4, WT night n = 5, TG day n = 9, TG night n = 9).
- D, E
Relative mRNA expression of Rev‐erba (D) and Gdf15 (E) in quadriceps, liver, and eWAT (WT day n = 9, WT night n = 5, TG day n = 20, TG night n = 12).
- F
Skeletal muscle (Quad) GDF15 protein content normalized to total protein content (WT day n = 4, WT night n = 5, TG day n = 14, TG night n = 12)
- G
Circulating GDF15 plasma levels (WT day n = 9, WT night n = 5, TG day n = 18, TG night n = 12).
- H
Graphical summary showing muscle mitochondrial stress induced secretion and diurnal variation of GDF15 to drive a daytime‐restricted anorexia, affecting in turn metabolic flexibility, adiposity, WAT browning, and systemic insulin sensitivity. Parts of this cartoon were created using Servier Medical Art (
http://smart.servier.com ).
References
-
- Suomalainen A, Battersby BJ (2018) Mitochondrial diseases: the contribution of organelle stress responses to pathology. Nat Rev Mol Cell Biol 19: 77–92 - PubMed
-
- Ernster L, Ikkos D, Luft R (1959) Enzymic activities of human skeletal muscle mitochondria: a tool in clinical metabolic research. Nature 184: 1851–1854 - PubMed
Publication types
MeSH terms
Substances
Grants and funding
LinkOut - more resources
Full Text Sources
Molecular Biology Databases
Miscellaneous
