. 2021 Jan 18;22(1):545-556.
doi: 10.1093/bib/bbz158.

Toward a gold standard for benchmarking gene set enrichment analysis

Affiliations

Toward a gold standard for benchmarking gene set enrichment analysis

Ludwig Geistlinger et al. Brief Bioinform. .

Abstract

Motivation: Although gene set enrichment analysis has become an integral part of high-throughput gene expression data analysis, the assessment of enrichment methods remains rudimentary and ad hoc. In the absence of suitable gold standards, evaluations are commonly restricted to selected datasets and biological reasoning on the relevance of resulting enriched gene sets.

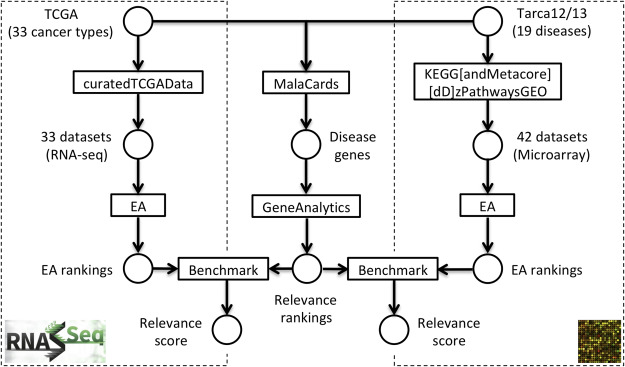
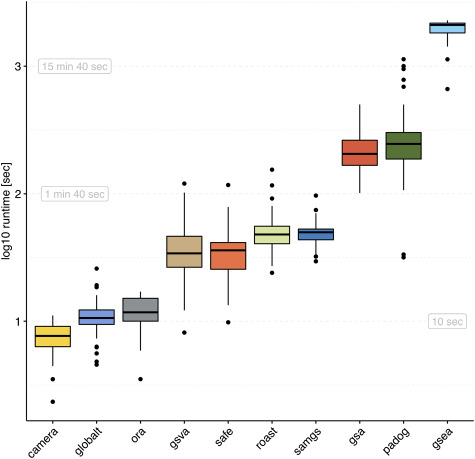
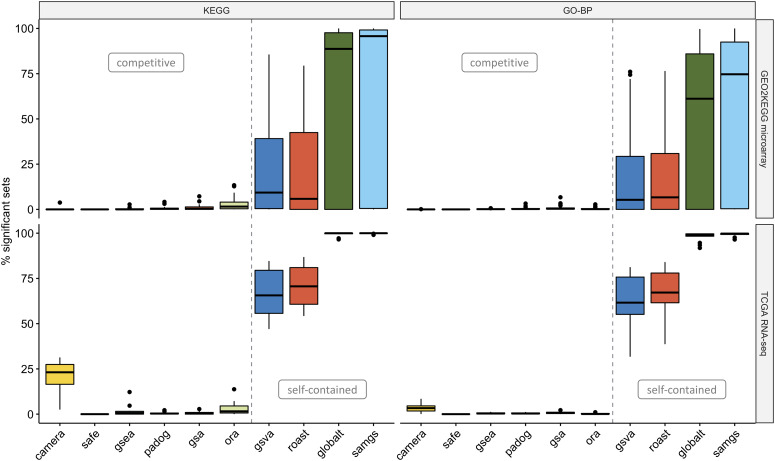
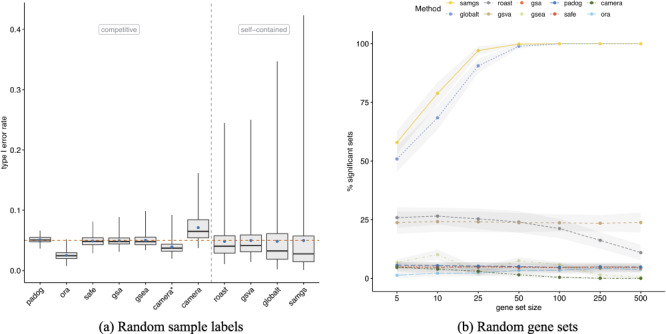
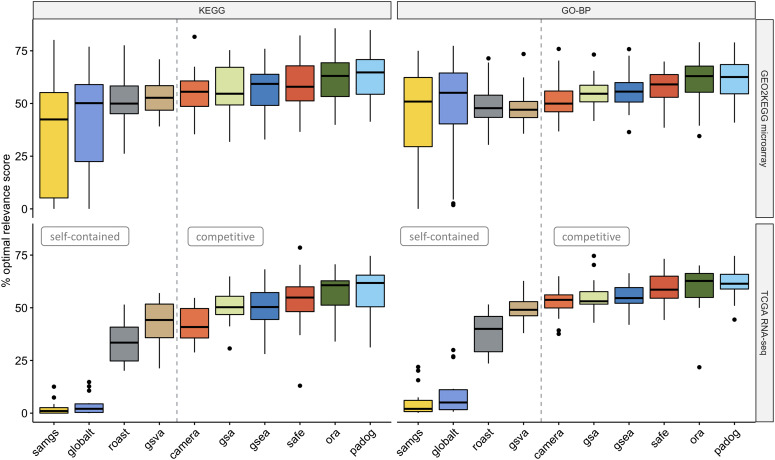
Results: We develop an extensible framework for reproducible benchmarking of enrichment methods based on defined criteria for applicability, gene set prioritization and detection of relevant processes. This framework incorporates a curated compendium of 75 expression datasets investigating 42 human diseases. The compendium features microarray and RNA-seq measurements, and each dataset is associated with a precompiled GO/KEGG relevance ranking for the corresponding disease under investigation. We perform a comprehensive assessment of 10 major enrichment methods, identifying significant differences in runtime and applicability to RNA-seq data, fraction of enriched gene sets depending on the null hypothesis tested and recovery of the predefined relevance rankings. We make practical recommendations on how methods originally developed for microarray data can efficiently be applied to RNA-seq data, how to interpret results depending on the type of gene set test conducted and which methods are best suited to effectively prioritize gene sets with high phenotype relevance.

Availability: http://bioconductor.org/packages/GSEABenchmarkeR.

Contact: ludwig.geistlinger@sph.cuny.edu.

Keywords: RNA-seq; gene expression data; gene set analysis; microarray; pathway analysis.


Figures

Figure 1
Figure 1
Benchmark setup. The benchmark framework incorporates a pre-defined RNA-seq panel (left), gene set relevance rankings (center) and a microarray panel (right). The RNA-seq panel investigates 33 cancer types across 33 datasets from TCGA [32], which are accessed through the curatedTCGAData package. The microarray panel investigates 19 human diseases across 42 datasets collected by Tarca et al. [25, 26], which are available in the KEGGdzPathwaysGEO and KEGGandMetacoreDzPathwaysGEO packages. Gene set relevance rankings for both data panels are constructed by (i) querying the MalaCards database [33] for each disease investigated and (ii) subjecting resulting disease genes to GeneAnalytics [34], which yields relevance rankings for GO-BP terms and KEGG pathways. EA methods selected for benchmarking are carried out across datasets of the data panels, yielding a gene set ranking (EA ranking) for each method on each dataset. The resulting EA rankings for each dataset are then benchmarked against the precompiled relevance rankings for the corresponding disease investigated.
Figure 2
Figure 2
Runtime. Elapsed processing times (formula image-axis, log-scale) when applying the enrichment methods indicated on the formula image-axis to the 42 datasets of the GEO2KEGG microarray compendium. Gene sets were defined according to GO-BP (formula image). Computation was carried out on an Intel Xeon 2.7 GHz machine. Runtimes for the TCGA RNA-seq compendium and when using KEGG gene sets are shown in Supplementary Figure S8.
Figure 3
Figure 3
Statistical significance. Percentage of significant gene sets (FDR formula image, formula image-axis) when applying methods to the GEO2KEGG microarray compendium (top, 42 datasets) and the TCGA RNA-seq compendium (bottom, 15 datasets). Gene sets were defined according to KEGG (left, 323 gene sets) and GO-BP (right, 4631 gene sets). The gray dashed line divides methods based on the type of null hypothesis tested [6]. Supplementary Figure S8 shows the percentage of significant gene sets when using a nominal significance threshold of 0.05.
Figure 4
Figure 4
Random sample labels and random gene sets. (a) Type I error rates (formula image-axis) as evaluated on the dataset from Golub et al. [42] by shuffling sample labels 1000 times and assessing in each permutation the fraction of gene sets with formula image. Gene sets were defined according to GO-BP (formula image). Blue points indicate the mean type I error rate and the red dashed line the significance level of 0.05. The gray dashed line divides methods based on the type of null hypothesis tested [6]. *Application of CAMERA without accounting for inter-gene correlation (default: inter-gene correlation of 0.01). Supplementary Figure S5 shows type I error rates when using KEGG gene sets. Supplementary Figure S6 shows type I error rates for all four combinations of benchmark compendium and gene set collection. (b) Percentage of significant gene sets (formula image, formula image-axis) when applying methods to the Golub dataset (true sample labels) and using 100 randomly sampled gene sets of defined size (formula image-axis). Shown is the mean formula image standard deviation (gray bands) across 100 replications of the simulation experiment.
Figure 5
Figure 5
Phenotype relevance. Percentage of the optimal phenotype relevance score (formula image-axis) when applying methods to the GEO2KEGG microarray compendium (top, 42 datasets) and the TCGA RNA-seq compendium (bottom, 15 datasets). Gene sets were defined according to KEGG (left, 323 gene sets) and GO-BP (right, 4631 gene sets). The gray dashed line divides methods based on the type of null hypothesis tested [6]. The phenotype relevance score of a method formula image applied to a dataset formula image is the sum of the gene set relevance scores, weighted by the relative position of each gene set in the ranking of method formula image (as outlined in Figure 1 and detailed in Phenotype relevance 2.6 section).

References

    1. Malone JH, Oliver B. Microarrays, deep sequencing and the true measure of the transcriptome. BMC Biol 2011;9:34. - PMC - PubMed
    1. Gene Ontology Consortium Gene ontology consortium: going forward. Nucleic Acids Res 2015;43:D1049–56. - PMC - PubMed
    1. Kanehisa M, Goto S, Sato Y, et al. Data, information, knowledge and principle: back to metabolism in KEGG. Nucleic Acids Res 2014;42:D199–205. - PMC - PubMed
    1. Croft D, O’Kelly G, Wu G, et al. Reactome: a database of reactions, pathways and biological processes. Nucleic Acids Res 2011;39:D691–7. - PMC - PubMed
    1. Liberzon A, Subramanian A, Pinchback R, et al. Molecular signatures database (MSigDB) 3.0. Bioinformatics 2011;27(12):1739–40. - PMC - PubMed

Publication types