. 2020 May;92(5):501-511.
doi: 10.1002/jmv.25701. Epub 2020 Feb 14.

Transmission dynamics and evolutionary history of 2019-nCoV

Affiliations

Transmission dynamics and evolutionary history of 2019-nCoV

Xingguang Li et al. J Med Virol. 2020 May.

Abstract

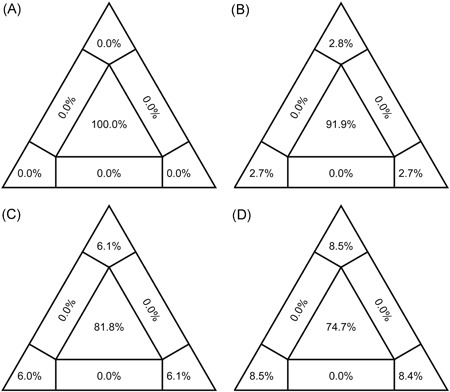
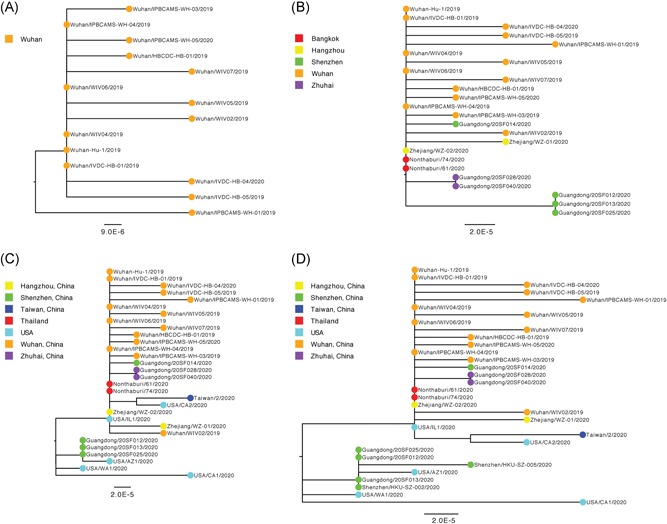
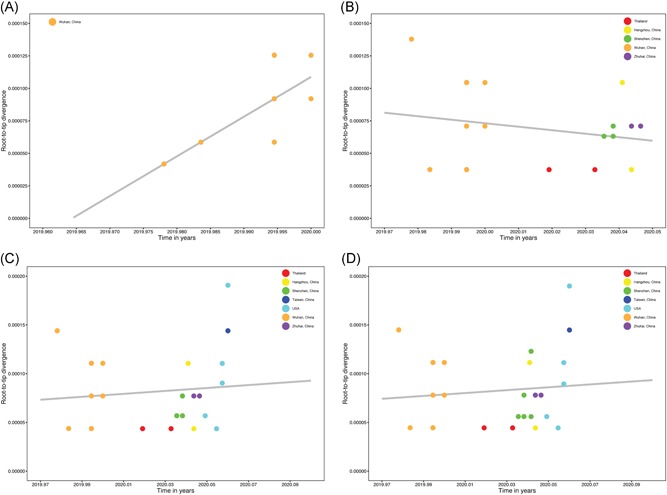
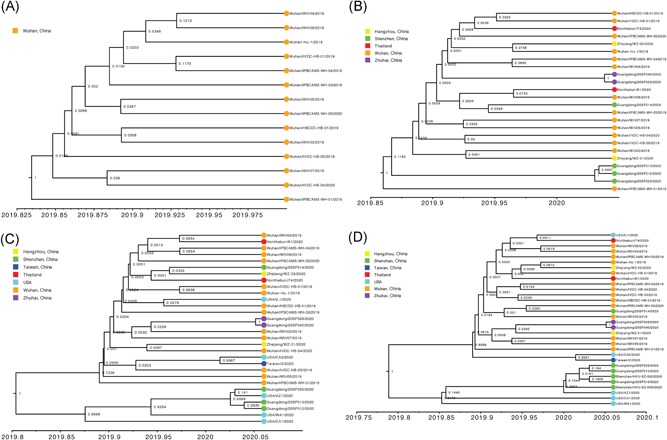
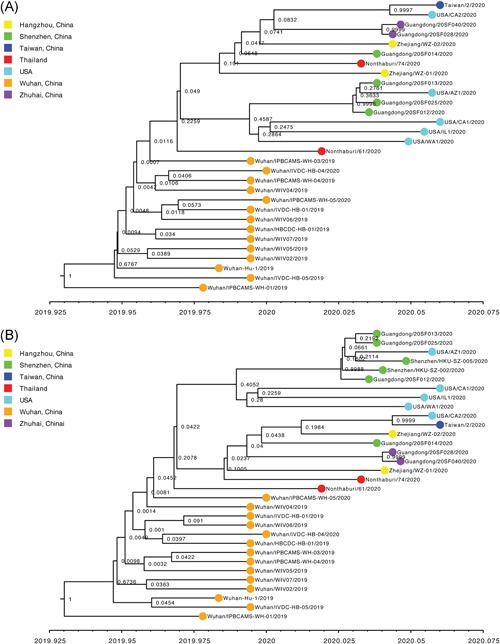
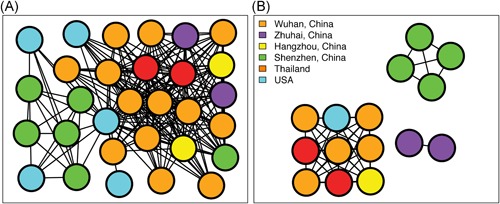
To investigate the time origin, genetic diversity, and transmission dynamics of the recent 2019-nCoV outbreak in China and beyond, a total of 32 genomes of virus strains sampled from China, Thailand, and the USA with sampling dates between 24 December 2019 and 23 January 2020 were analyzed. Phylogenetic, transmission network, and likelihood-mapping analyses of the genome sequences were performed. On the basis of the likelihood-mapping analysis, the increasing tree-like signals (from 0% to 8.2%, 18.2%, and 25.4%) over time may be indicative of increasing genetic diversity of 2019-nCoV in human hosts. We identified three phylogenetic clusters using the Bayesian inference framework and three transmission clusters using transmission network analysis, with only one cluster identified by both methods using the above genome sequences of 2019-nCoV strains. The estimated mean evolutionary rate for 2019-nCoV ranged from 1.7926 × 10⁻³ to 1.8266 × 10⁻³ substitutions per site per year. On the basis of our study, undertaking epidemiological investigations and genomic data surveillance could positively impact public health in terms of guiding prevention efforts to reduce 2019-nCOV transmission in real-time.

Keywords: 2019-nCoV; TMRCA; evolutionary rate; phylogenetic cluster; time to most recent common ancestor; transmission cluster.


Conflict of interest statement

The authors declare that there are no conflict of interests.

Figures

Figure 1
Figure 1
Likelihood‐mapping analyses of 2019‐nCOV. Likelihoods of three tree topologies for each possible quartet (or for a random sample of quartets) are denoted by a data point in an equilateral triangle. The distribution of points in seven areas of triangle reflects tree‐likeness of data. Specifically, three corners represent fully resolved tree topologies; center represents an unresolved (star) phylogeny; and sides represent support for conflicting tree topologies. Results of likelihood‐mapping analyses of four datasets (A, “dataset_14”; B, “dataset_24”; C, “dataset_30”; and D, “dataset_32”) are shown
Figure 2
Figure 2
Estimated maximum‐likelihood phylogenies of 2019‐nCOV. Colors indicate different sampling locations. The tree is midpoint rooted. Results of maximum‐likelihood phylogenetic analyses of four datasets (A, “dataset_14”; B, “dataset_24”; C, “dataset_30”; and D, “dataset_32”) are shown
Figure 3
Figure 3
Regression of root‐to‐tip genetic distance against the year of sampling for 2019‐nCOV. Colors indicate different sampling locations. Gray indicates the linear regression line. Results of linear regression analyses of four datasets (A, “dataset_14”; B, “dataset_24”; C, “dataset_30”; and D, “dataset_32”) are shown
Figure 4
Figure 4
Estimated maximum clade credibility tree of 2019‐nCOV using constrained evolutionary rate. Colors indicate different sampling locations. Nodes are labeled with posterior probability values. Estimated maximum clade credibility tree of four datasets (A, “dataset_14”; B, “dataset_24”; C, “dataset_30”; and D, “dataset_32”) are shown
Figure 5
Figure 5
Estimated maximum clade credibility tree of 2019‐nCOV using the tip‐dating method. Colors indicate different sampling locations. Nodes are labeled with posterior probability values. Estimated maximum clade credibility tree of four datasets (A, “dataset_30”; and B, “dataset_32”) are shown
Figure 6
Figure 6
Transmission clusters of 2019‐nCOV. Structure of inferred 2019‐nCOV transmission clusters from full dataset (“dataset_32”) using genetic distances of less than 0.01% and less than 0.001% substitutions/site are illustrated in (A) and (B), respectively. Nodes (circles) represent connected individuals in the overall network, and putative transmission linkages are represented by edges (lines). Nodes are color‐coded by sampling locations

References

    1. Chan JFW, Yuan S, Kok KH, et al. A familial cluster of pneumonia associated with the 2019 novel coronavirus indicating person‐to‐person transmission: a study of a family cluster. Lancet. 2020. 10.1016/S0140-6736(20)30154-9 - DOI - PMC - PubMed
    1. Li Q, Guan X, Wu P, et al. Early transmission dynamics in Wuhan, China, of novel coronavirus‐infected pneumonia. N Engl J Med. 2020. 10.1056/NEJMoa2001316 - DOI - PMC - PubMed
    1. Su S, Wong G, Shi W, et al. Epidemiology, genetic recombination, and pathogenesis of coronaviruses. Trends Microbiol. 2016;24:490‐502. 10.1016/j.tim.2016.03.003 - DOI - PMC - PubMed
    1. Drosten C, Günther S, Preiser W, et al. Identification of a novel coronavirus in patients with severe acute respiratory syndrome. N Engl J Med. 2003;348:1967‐1976. 10.1056/NEJMoa030747 - DOI - PubMed
    1. Ksiazek TG, Erdman D, Goldsmith CS, et al. A novel coronavirus associated with severe acute respiratory syndrome. N Engl J Med. 2003;348:1953‐1966. 10.1056/NEJMoa030781 - DOI - PubMed

Publication types