Meta-Analysis
. 2020 Mar;146(3):218-244.
doi: 10.1037/bul0000223.

Promoting memory consolidation during sleep: A meta-analysis of targeted memory reactivation

Affiliations
Meta-Analysis

Promoting memory consolidation during sleep: A meta-analysis of targeted memory reactivation

Xiaoqing Hu et al. Psychol Bull. 2020 Mar.

Abstract

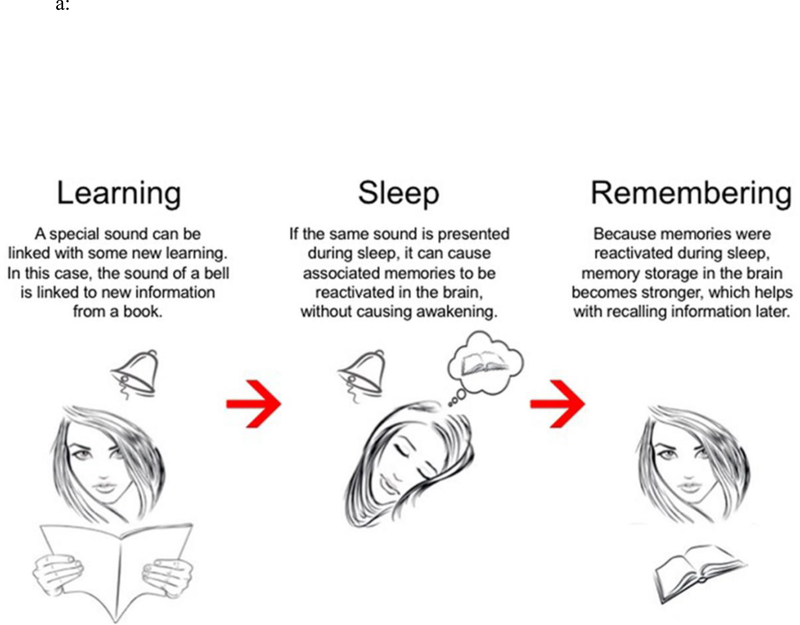
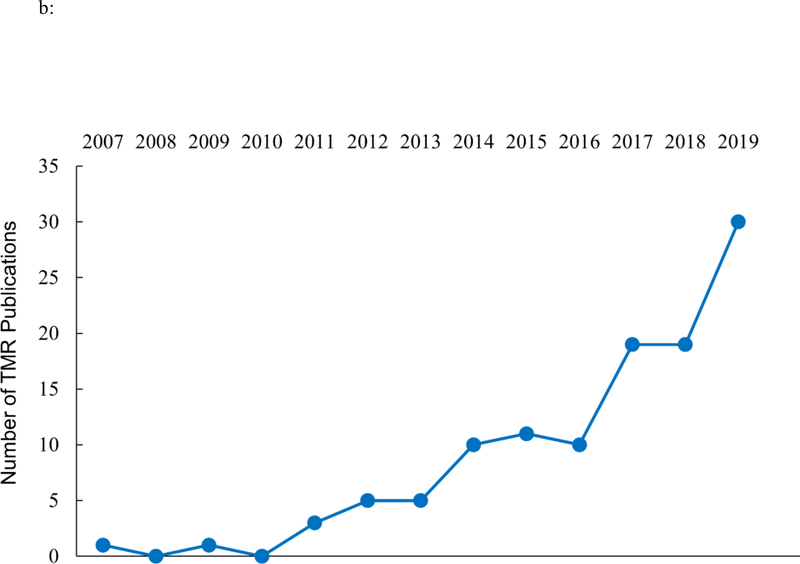
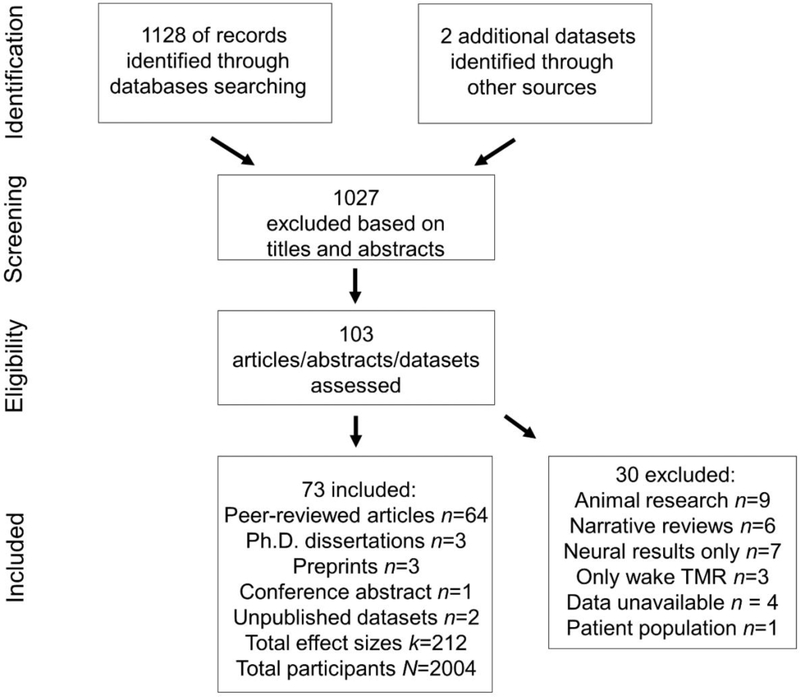
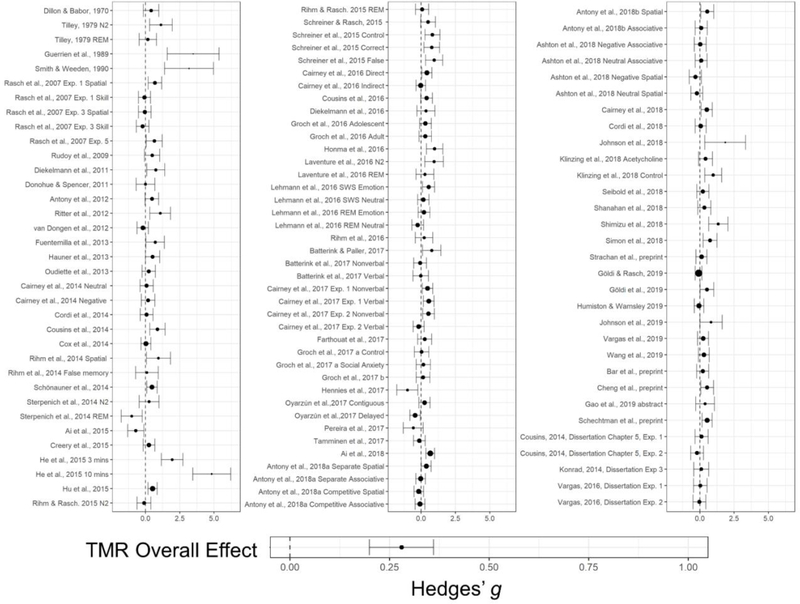
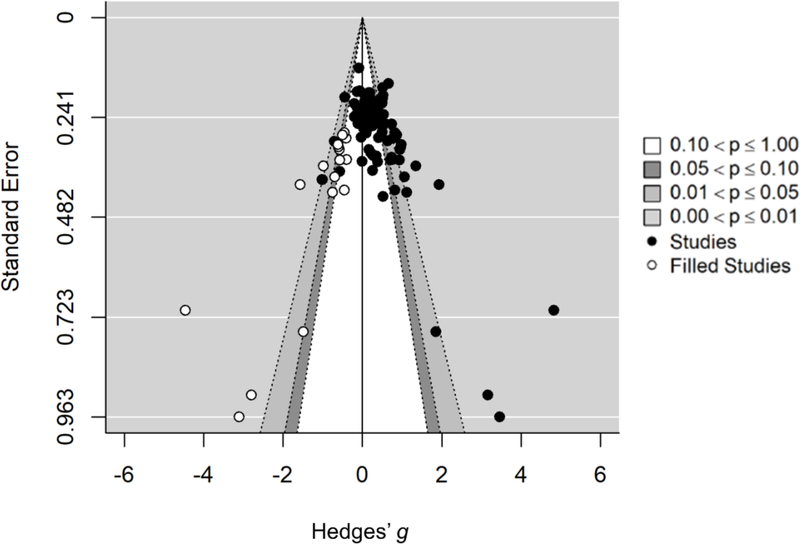
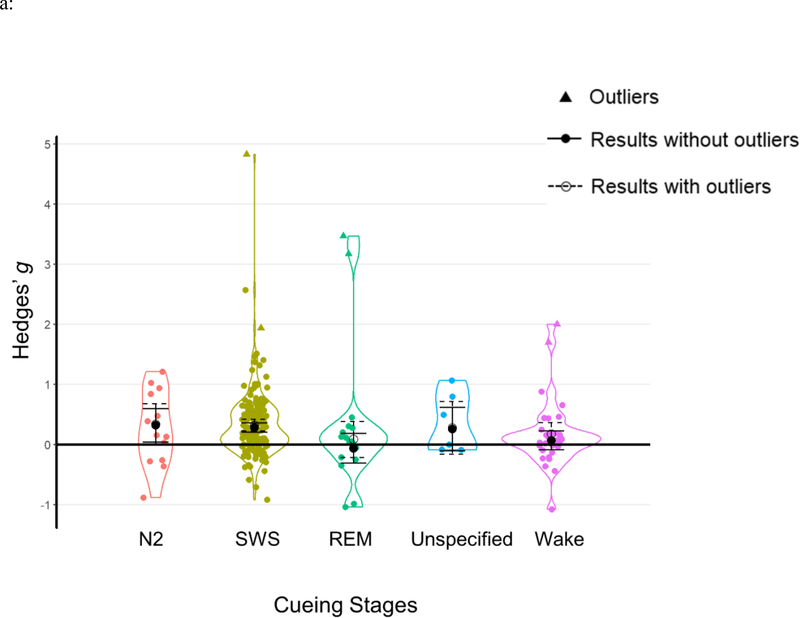
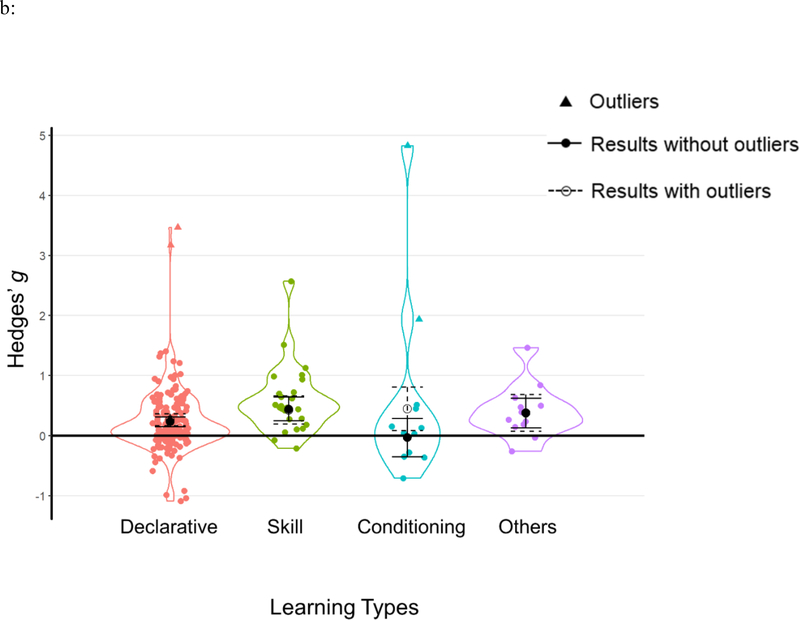
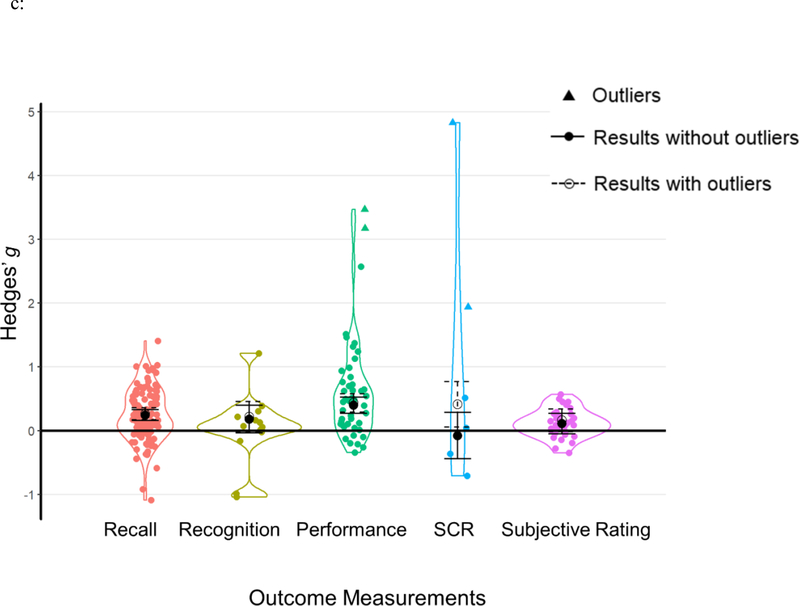
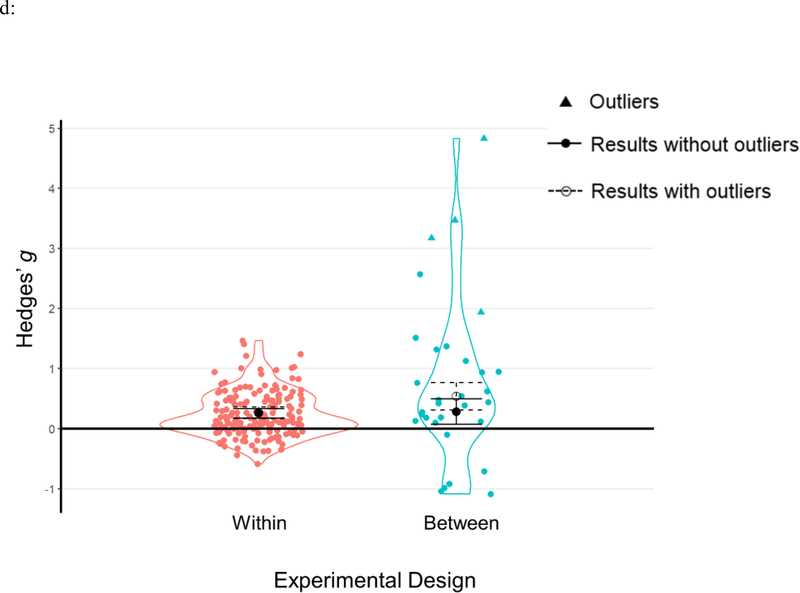
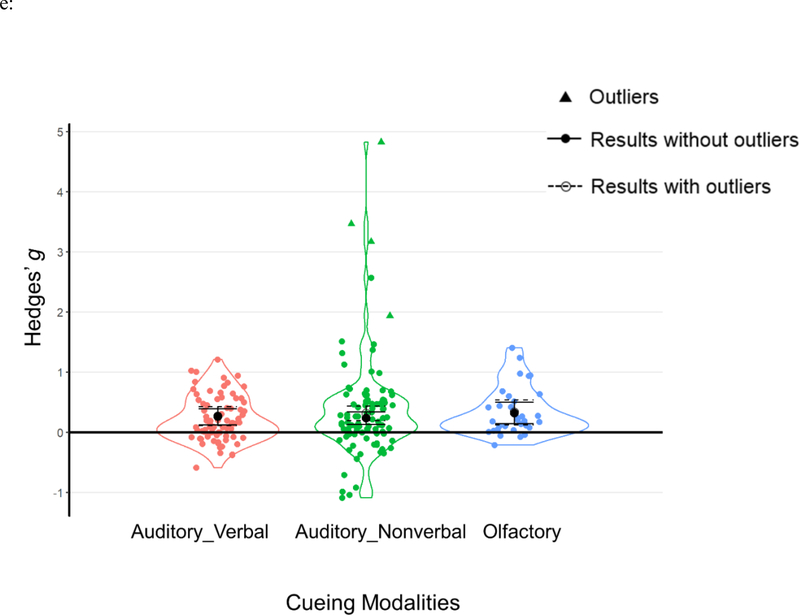
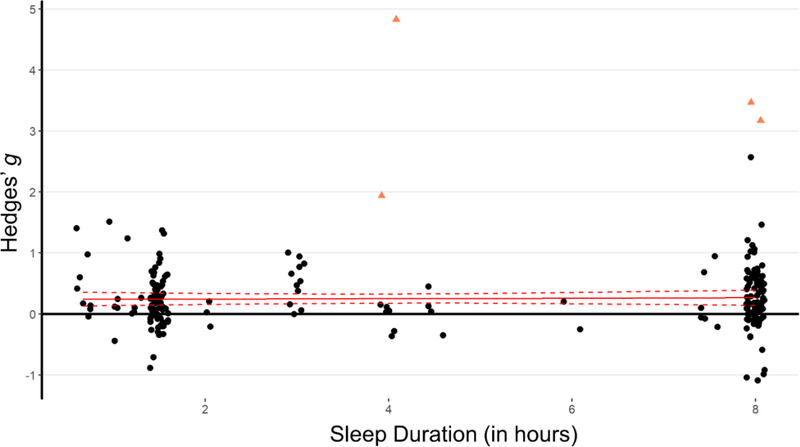
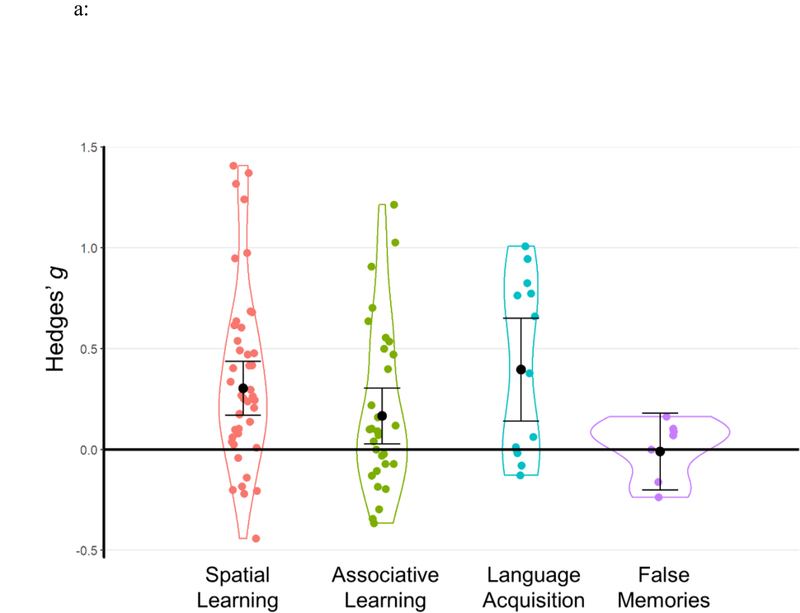
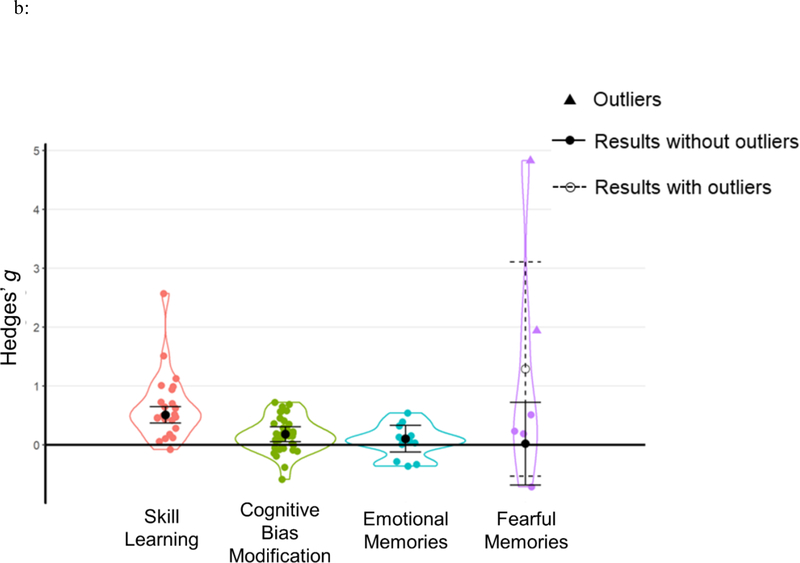
Targeted memory reactivation (TMR) is a methodology employed to manipulate memory processing during sleep. TMR studies have great potential to advance understanding of sleep-based memory consolidation and corresponding neural mechanisms. Research making use of TMR has developed rapidly, with over 70 articles published in the last decade, yet no quantitative analysis exists to evaluate the overall effects. Here we present the first meta-analysis of sleep TMR, compiled from 91 experiments with 212 effect sizes (N = 2,004). Based on multilevel modeling, overall sleep TMR was highly effective (Hedges' g = 0.29, 95% CI [0.21, 0.38]), with a significant effect for two stages of non-rapid-eye-movement (NREM) sleep (Stage NREM 2: Hedges' g = 0.32, 95% CI [0.04, 0.60]; and slow-wave sleep: Hedges' g = 0.27, 95% CI [0.20, 0.35]). In contrast, TMR was not effective during REM sleep nor during wakefulness in the present analyses. Several analysis strategies were used to address the potential relevance of publication bias. Additional analyses showed that TMR improved memory across multiple domains, including declarative memory and skill acquisition. Given that TMR can reinforce many types of memory, it could be useful for various educational and clinical applications. Overall, the present meta-analysis provides substantial support for the notion that TMR can influence memory storage during NREM sleep, and that this method can be useful for understanding neurocognitive mechanisms of memory consolidation. (PsycINFO Database Record (c) 2020 APA, all rights reserved).


Figures

Figure 1
Figure 1
a: Schematic of the typical procedure in a TMR experiment (reprinted from Paller, 2018). 1b: Number of TMR articles (including both human/non-human empirical studies and review articles) published by year since Rasch et al. (2007). The last data point represents the annualized number based on number of articles published from January to June 2019.
Figure 1
Figure 1
a: Schematic of the typical procedure in a TMR experiment (reprinted from Paller, 2018). 1b: Number of TMR articles (including both human/non-human empirical studies and review articles) published by year since Rasch et al. (2007). The last data point represents the annualized number based on number of articles published from January to June 2019.
Figure 2:
Figure 2:
A PRISMA flow chart of literature search and inclusion.
Figure 3:
Figure 3:
A forest plot displaying sleep TMR effect sizes calculated from each experiment at a task level, matching descriptive from Table 1. The overall TMR effect was presented, calculated from a random effects model using task-level effect sizes from the forest plot and Table 1.
Figure 4:
Figure 4:
A contour-enhanced funnel plot displaying all effect sizes at experiment levels (solid circles) from sleep TMR research. Y-axis indicates standard errors of effect sizes, x-axis indicates magnitudes of effect sizes in terms of Hedges’ g. Imputed effect sizes calculated from the Trim-and-Fill analysis are displayed in open circles.
Figures 5:
Figures 5:
Results of moderator analyses from a) cueing stages; b) learning types; c) outcome measurements; d) experimental designs and e) cueing modalities. Each data point represents an individual effect size at an outcome level. Statistical outliers are the same as those indicated in Table 1 and are marked as triangles. The figure displays aggregated effect sizes from each moderator analyses, with error bars representing 95% CIs. The figure displays both results without outliers (solid lines with solid circles) and results including all data points (dashed lines with open circles).
Figures 5:
Figures 5:
Results of moderator analyses from a) cueing stages; b) learning types; c) outcome measurements; d) experimental designs and e) cueing modalities. Each data point represents an individual effect size at an outcome level. Statistical outliers are the same as those indicated in Table 1 and are marked as triangles. The figure displays aggregated effect sizes from each moderator analyses, with error bars representing 95% CIs. The figure displays both results without outliers (solid lines with solid circles) and results including all data points (dashed lines with open circles).
Figure 6:
Figure 6:
A meta-regression analysis revealed no relationship between sleep length and TMR effects. Statistical outliers are the same as those indicated in Table 1 and are marked as triangles. The regression line (the solid line) and its 95% confidence intervals (the dashed lines) were calculated from the meta-regression model without outliers.
Figure 7:
Figure 7:
Results of focal analyses. Each data point represents an individual effect size at an outcome level. Statistical outliers are the same as those indicated in Table 1 and are marked as triangles. The figure displays aggregated effect sizes based on each focal analysis, with error bars representing 95% CIs. For fearful memories, the figure displays both result without outliers (the solid line with a solid circle) and result including all data points (the dashed line with an open circle).
Figure 7:
Figure 7:
Results of focal analyses. Each data point represents an individual effect size at an outcome level. Statistical outliers are the same as those indicated in Table 1 and are marked as triangles. The figure displays aggregated effect sizes based on each focal analysis, with error bars representing 95% CIs. For fearful memories, the figure displays both result without outliers (the solid line with a solid circle) and result including all data points (the dashed line with an open circle).

References

    1. Aarons L (1976). Sleep-assisted instruction. Psychological Bulletin, 83(1), 1–40. 10.1037/0033-2909.83.1.1 - DOI - PubMed
    1. *Ai SZ, Chen J, Liu JF, He J, Xue YX, Bao YP, … Shi J (2015). Exposure to extinction-associated contextual tone during slow-wave sleep and wakefulness differentially modulates fear expression. Neurobiology of Learning and Memory, 23, 159–167. doi:10.1016/j.nlm.2015.06.005 - DOI - PubMed
    1. *Ai SZ, Yin Y, Chen Y, Wang C, Sun Y, Tang X, … & Shi J (2018). Promoting subjective preferences in simple economic choices during nap. eLife, 7, e40583. doi: 10.7554/eLife.40583 - DOI - PMC - PubMed
    1. Albouy G, Sterpenich V, Balteau E, Vandewalle G, Desseilles M, Dang-Vu T, … & Peigneux P (2008). Both the hippocampus and striatum are involved in consolidation of motor sequence memory. Neuron, 58(2), 261–272. 10.1016/j.neuron.2008.02.008 - DOI - PubMed
    1. Alm KH, Ngo CT, & Olson IR (2019). Hippocampal signatures of awake targeted memory reactivation. Brain Structure and Function, 224(2), 713–726. 10.1007/s00429-018-1790-2 - DOI - PMC - PubMed

Publication types