. 2020 Feb 6:9:e52976.
doi: 10.7554/eLife.52976.

Selective egg cell polyspermy bypasses the triploid block

Affiliations

Selective egg cell polyspermy bypasses the triploid block

Yanbo Mao et al. Elife. .

Abstract

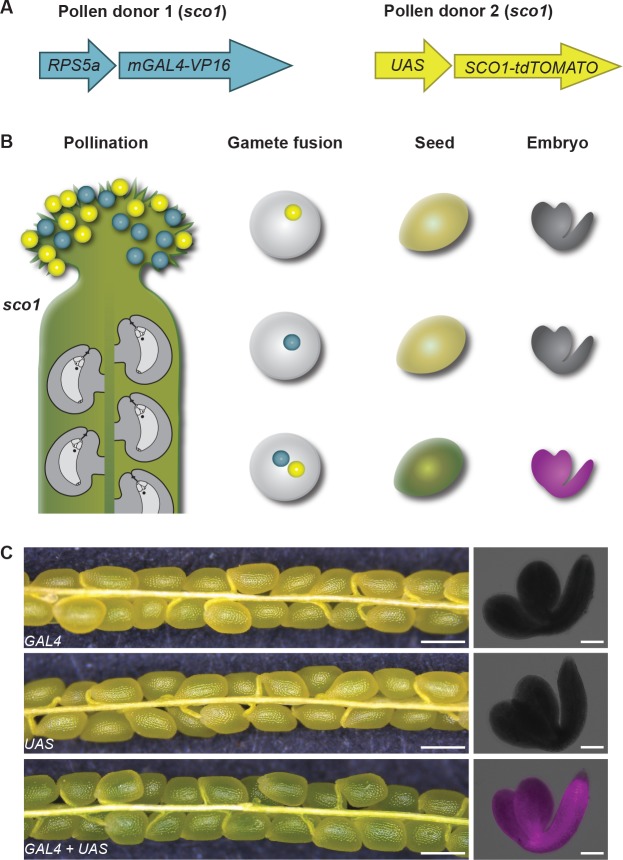
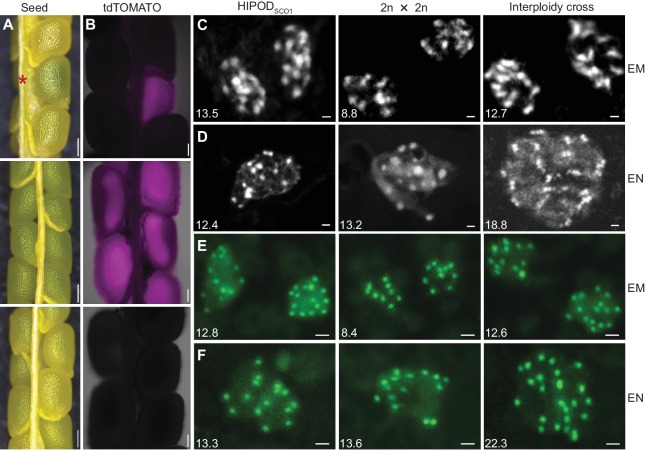
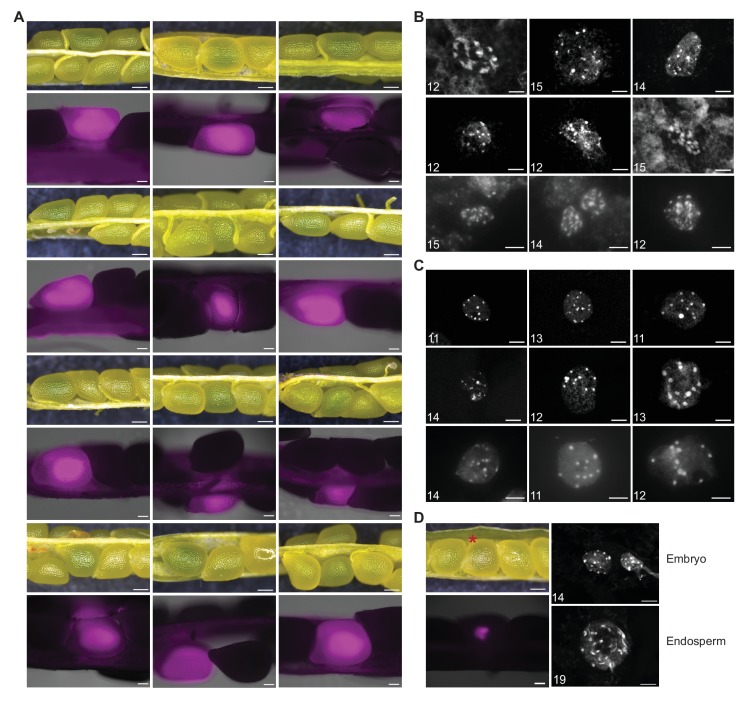
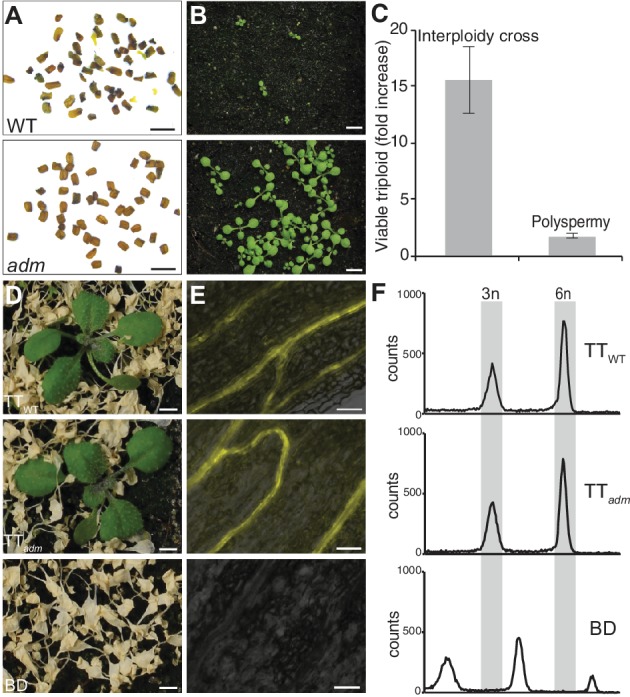
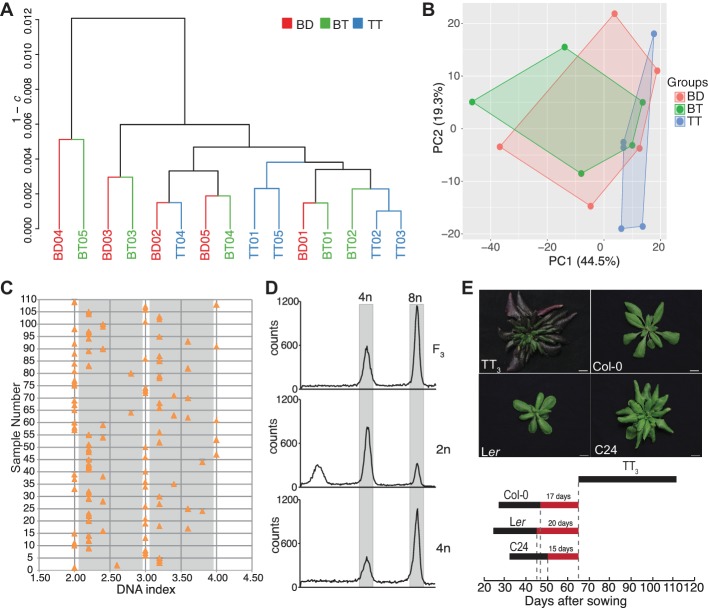
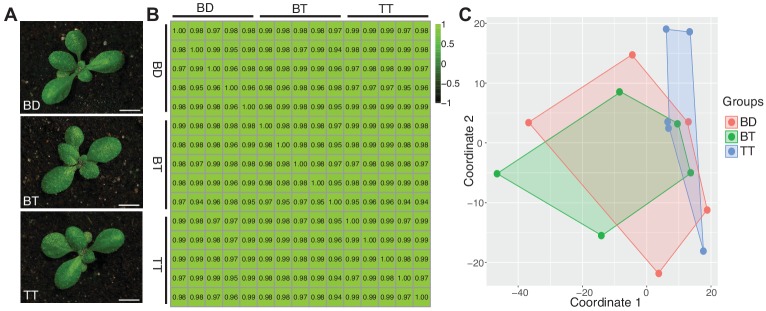
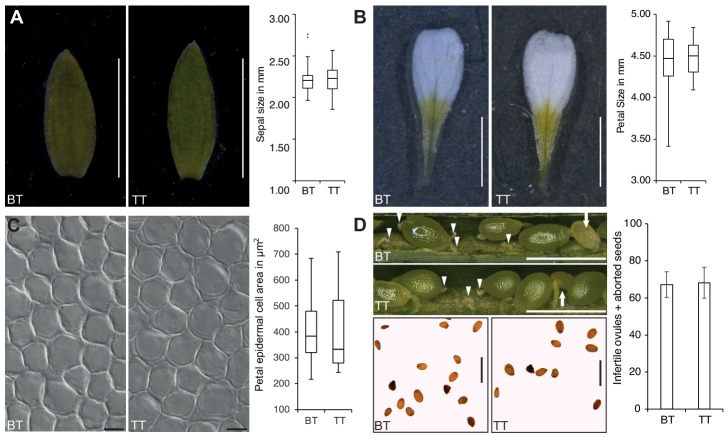
Polyploidization, the increase in genome copies, is considered a major driving force for speciation. We have recently provided the first direct in planta evidence for polyspermy induced polyploidization. Capitalizing on a novel sco1-based polyspermy assay, we here show that polyspermy can selectively polyploidize the egg cell, while rendering the genome size of the ploidy-sensitive central cell unaffected. This unprecedented result indicates that polyspermy can bypass the triploid block, which is an established postzygotic polyploidization barrier. In fact, we here show that most polyspermy-derived seeds are insensitive to the triploid block suppressor admetos. The robustness of polyspermy-derived plants is evidenced by the first transcript profiling of triparental plants and our observation that these idiosyncratic organisms segregate tetraploid offspring within a single generation. Polyspermy-derived triparental plants are thus comparable to triploids recovered from interploidy crosses. Our results expand current polyploidization concepts and have important implications for plant breeding.

Keywords: A. thaliana; developmental biology; egg cell; plant biology; plant reproduction; polyploidization; polyspermy; triploid block.

Plain language summary

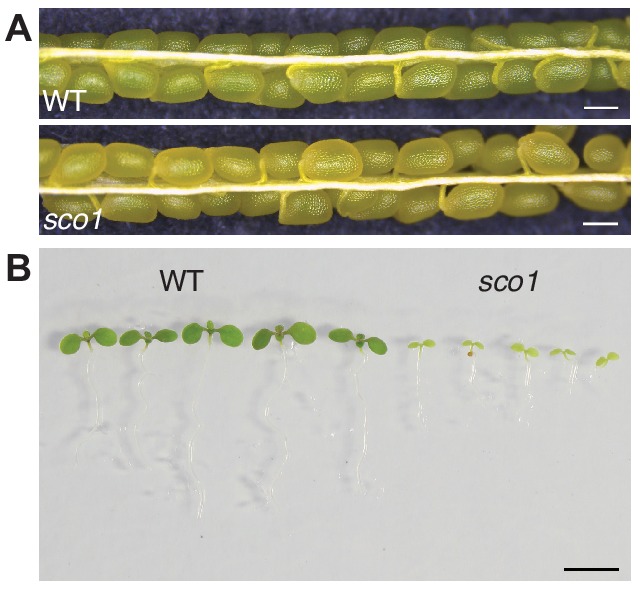
Ever since Darwin published his most famous book on the theory of evolution, scientists have sought to identify the mechanisms that drive the formation of new species. This is especially true for plant biologists who have long been fascinated by the extraordinary diversity of flowering plants.Many species of flowering plant first evolved after a dramatic increase in the DNA content of an individual plant, a process termed polyploidization. Most explanations for polyploidization involve a pollen grain making sperm that mistakenly contain two sets of chromosomes rather than one. Yet, it is difficult to reconcile this explanation with an important aspect of plant reproduction – the so-called “triploid block”.Fertilization in flowering plants is more complicated than in animals. While one sperm fertilizes the egg cell to make the plant embryo, a second sperm from the same pollen grain must fertilize another cell to form the endosperm, the tissue that will nourish the embryo as it develops. This means that sperm with twice the normal number of chromosomes would affect the DNA content of both the embryo and the endosperm. Yet, an endosperm that receives extra paternal DNA typically halts the development of the seed via a process known as the triploid block, meaning it was not clear how often this process would actually result in a polyploid plant.In 2017, researchers reported that plants can, on rare occasions, generate polyploid offspring via a different route: the fertilization of one egg with two sperm rather than one. Now, Mao et al. – who include several researchers involved in the 2017 study – show that this process, termed “polyspermy”, can introduce extra copies of DNA into just the egg cell, meaning it can bypass the triploid block of the endosperm.The experiments involved a model plant called Arabidopsis, and a screen of over 55,000 seeds identified about a dozen with embryos that had three parents, one mother and two fathers. Notably, most of these three-parent embryos developed in seeds that contained endosperm with the regular number of chromosomes and hence escaped the triploid block.These new results show that polyspermy provides plants with a means to essentially sneak extra copies of DNA ‘behind the back’ of the DNA-sensitive endosperm and into the next generation. They also give new insight in how polyploidization may have shaped the evolution of flowering plants and have important implications for agriculture where the breeding of new “hybrid” crops has often been limited by incompatibilities in the endosperm.


Conflict of interest statement

YM, AG, TN, PV, TB, DT, DV, IG No competing interests declared, RG The authors declare that they have filed a patent based on this work (EP3485020 A1, CN109790546, US2019159417 A1).

Figures

Figure 1.
Figure 1.. Establishment of a detection assay for polyspermy-derived embryos.
(A) Illustration of HIPODSCO1. The assay is based on the UAS-GAL4 two-component system whereby a synthetic transcription factor mGAL4 expressed under the control of the ubiquitous RPS5a promoter activates the tdTOMATO-tagged SCO1 gene. These two components were combined with the sco1 mutant to generate pollen donor 1 and 2 (PD1 and PD2), respectively. (B) Pollen of PD1 and PD2 (blue, yellow) are applied to the stigma of a sco1 gynoecium (green). Gamete fusion involving two sperm from two different pollen donors leads to transactivation of the SCO1 gene resulting in dark green seeds and fluorescence of tdTOMATO in the embryo, while monospermy-derived seeds remain pale green with no fluorescence. (C) Silique and seed analysis of sco1 mutants containing only pRPS5a::mGAL4-VP16, (upper panel), only pUAS::SCO1-tdTOMATO (middle panel), and both pRPS5a::mGAL4-VP16 and pUAS::SCO1-tdTOMATO (lower panel). Scale bars, 500 μm and 100 μm in left and right panel, respectively.
Figure 1—figure supplement 1.
Figure 1—figure supplement 1.. sco1 exhibited yellowish seeds and cotyledons compared to wild-type.
(A) Seeds of wild-type (upper) and sco1 T-DNA insertion mutant (lower) in silique 7 DAP. (B) 6-day-old seedlings of wild-type (left) and sco1 mutant (right).
Figure 2.
Figure 2.. HIPODSCO1 identifies developing seeds harboring polyspermy-derived embryos.
(A and B) Bright- and fluorescence light images of seeds from different crosses seven days after pollination (DAP). Upper panel (HIPODSCO1): sco1 × pRPS5a::mGAL4-VP16/+ sco1 (PD1) × pUAS::SCO1-tdTOMATO/+ sco1 (PD2); middle panel: pUAS::SCO1-tdTOMATO/+ sco1 × pRPS5a::mGAL4-VP16/+ sco1; lower panel: sco1 × sco1. Asterisk indicates polyspermy-induced complementation of a sco1 seed. (C and D) DAPI-stained chromosome spreads of embryo (EM) (C) and endosperm (EN) (D) resulting from different crosses. Left panel: HIPODSCO1-rescued embryo segregating from cross between sco1 × pRPS5a::mGAL4-VP16/+ sco1 (PD1) × pUAS::SCO1-tdTOMATO/+ sco1 (PD2); middle panel: pUAS::SCO1-tdTOMATO/+ sco1 × pRPS5a::mGAL4-VP16/+ sco1; right panel: sco1 × wild type (4n). (E and F) Chromosome counting through centromere-targeted CENH3-GFP of embryo (E) and endosperm (F) resulting from different crosses. Left panel: rescued embryo segregating from cross between sco1 × pRPS5a::mGAL4-VP16/+ p35S::CENH3-GFP sco1 (PD1 with CENH3-GFP) × pUAS::SCO1-tdTOMATO/+ sco1 (PD2); middle panel: pUAS::SCO1-tdTOMATO/+ sco1 × pRPS5a::mGAL4-VP16/+ p35S::CENH3-GFP sco1 ; right panel: wild type (4n) × pRPS5a::mGAL4-VP16/+ p35S::CENH3-GFP sco1 . The numbers in parenthesis indicate the average counted chromosomes from all analyzed cells, from left to right, (C) n = 11, 11, 9, (D) n = 20, 6, 9, (E), n = 82, 57, 78, (F), n = 12, 26, 6. Scale bars, 200 μm (A), 100 μm (B), 1 μm (C–E).
Figure 2—figure supplement 1.
Figure 2—figure supplement 1.. Identification and characterization of rescued green seeds and one underdeveloped seed recovered from HIPODSCO1.
(A) Silique segregating a green seed from 7 DAP HIPODSCO1 (upper) and corresponding tdTOMATO signal (lower). The last three siliques from HIPODSCO1 with p35S::CENH3-GFP in PD1. Scale bars, 200 μm (upper), 100 μm (lower). (B and C). Chromosome spread of the embryo (B) and endosperm (C) isolated from green seeds recovered from HIPODSCO1. The number in the left corner labels the visible chromosome numbers in one cell. The pictures in the lower row in (B) and (C) were captured with a Leica DMI6000b epifluorescence inverted microscope (100 × objective) with manually increased brightness and contrast. Scale bar, 5 μm. (D) Silique (upper left) segregating one single abnormal polyspermy-derived seed (asterisk) recovered from HIPODSCO1, the respective tdTOMATO fluorescence analysis (lower left), and DAPI stained chromosome spreads of embryo and endosperm (right panel) from the asterisk- labeled seed Scale bars, 200 μm (upper left), 100 μm (lower left), 5 μm (right panel). The number in the left corner labels the visible chromosome numbers in one cell.
Figure 3.
Figure 3.. Polyspermy-induced polyploidization is partially insensitive of adm-mediated triploid block repression.
(A and B) Mature seed (A) and corresponding 9 day old seedling (B) from one silique of wild-type pollinated with diploid wild-type pollen and diploid adm-1 pollen. (C) Effect of the triploid block repressor adm on interploidy cross- recovered triploids (2n × 4n) and polyspermy- derived triploids. Shown is the ratio of triploid plants recovered from two crosses involving either adm or wild-type pollen donors (adm/WT). The data are means ± SEM (n = 3 experiments). (D) Herbicide-treated offspring of triparental triploid (TT) plants recovered from HIPOD with (TTWT) or without (TTadm) ADMETOS segregating pollen donors. Lower panel, herbicide-sensitive offspring of biparental diploid wild type (BD). (E and F) YFP fluorescence (E) and flow-cytometric analysis (F) of TTWT, TTadm and BD plants corresponding to the categories shown in (D). Scale bars, 1 mm (A), 5 mm (B, D), 50 μm (E).
Figure 4.
Figure 4.. Characterization of triparental triploid plants.
(A) Dendrogram from hierarchical clustering of the 3 × 5 biological replicates of biparental diploid (BD), biparental triploid (BT), and triparental triploid (TT) recovered from polyspermy plant samples. The 15 × 15 matrix of Spearman’s correlation coefficients c was computed from the fifteen regularized log transformed expression profiles. The dendrogram was computed by average linkage clustering (UPGMA) of the 15 × 15 dissimilarity matrix with elements 1 – c. (B) Two-dimensional principle component analysis (PCA) of the fifteen 21,450-dimensional regularized log transformed expression profiles. The points represent the biological replicates, while the shapes resulting from connecting biological replicates from the same genotype highlight the similarity between the transcriptome profiles. (C) Distribution of ploidy level in the aneuploidy swarms produced by a triparental triploid plant. 2.0 in DNA index represents near diploids, 3.0, near triploids, and 4.0, near tetraploids. The gray areas indicate the intermediate ploidies. Each orange triangle represents an F2 plant derived from a triparental triploid. (D) Flow cytometric analysis of tetraploid progeny plants in F3 generation. 2n and 4n represent diploid and tetraploid controls. (E) Analysis of flowering time window of triparental triploid plants recovered from a three accession cross (TT3), Col-0, Ler and C24 during bolting stage. Scale bar, 1 cm. The black bold line represents the flowering period of different accessions. The three red bold lines bordered by the gray dashed lines label the day gaps between flowering termination of the parents and flowering initiation in the TT3.
Figure 4—figure supplement 1.
Figure 4—figure supplement 1.. Transcriptome analysis of plants from different origin and ploidy.
(A) RNA was isolated from biparental diploids (BD), biparental triploids (BT) and triparental triploids (TT) 18 DAS. Scale bar, 5 mm. (B and C) Pairwise Spearman’s correlation coefficients (B) and two-dimensional multidimensional scaling (MDS) analysis (C) of the fifteen 21,450-dimensional regularized log transformed mRNA expression profiles. The points represent the single biological replicates, while the shapes resulting from connecting biological replicates from the same genotype highlight the similarity between the transcriptome profiles.
Figure 4—figure supplement 2.
Figure 4—figure supplement 2.. Polyspermy-induced triploid plants are similar to triploid plants originating from a regular monospermic fertilization mode.
(A) Sepal size comparison of biparental triploids (BT; n = 56) and triparental triploids (TT; n = 107). The brightness in (A) was equally increased by using Adobe Photoshop CC. (B) Petal size of BT (n = 121) and TT (n = 104). (C) Petal epidermal cell area of BT (n = 112) and TT (n = 93). (D) Silique analysis of BT (n = 19) and TT (n = 39). Siliques are showing dark green seeds, sterile ovules (white arrowhead) and abnormal seeds (white arrow) (upper panel). Seed morphology of BT and TT plants (lower panel). Box plots show median, quartiles, maximum and minimum. Scale bars, 2 mm (A, B), 10 µm (C), 1 mm (D). TT data was already published before (Nakel et al., 2017).
Figure 4—figure supplement 3.
Figure 4—figure supplement 3.. Ploidy assessment of offspring derived from triparental triploids.
(A) Euploid peak distribution was assessed by measuring a mixture of extracted nuclei from 2n and 3n plants that gives rise to five prominent peaks representing 2n, 3n, 4n, 6n, and 8n (upper panel). Leaf samples were taken from triparental offspring (F2) and mixed with 2n Col-0 as internal standard. Aneuploid samples exhibited additional peaks that were grouped into two distinct categories; i) aneuploid 2n-3n which exhibit additional peaks in the green region (middle panel) and ii) aneuploid 3n-4n which exhibit additional peaks in the yellow region (lower panel). (B) Near-tetraploid plant samples derived from triparental offspring (F2) were identified by changes in peak height. 2n Col-0 control plant exhibits a small 8n peak (lower panel). 2n Col-0 mixed with 4n Col-0 control samples exhibit a pronounced 8n peak (upper panel) comparable to 2n Col-0 mixed with near-tetraploid samples (middle panel).
Figure 4—figure supplement 4.
Figure 4—figure supplement 4.. Flowering initiation and termination comparison.
(A) Flowering time comparison among plants from different ploidy and hybrids among the three accessions. The 2n hybrid of Col-0 × Ler, Ler × C24, and Col-0 × C24 were produced by crossing the respective diploid parents. The 3n hybrid of Col-0 × Ler and Col-0 × C24 were recovered from the cross of 2n Col-0 with 4n male Ler and C24. 3n Col-0 was acquired by crossing 2n with 4n Col-0 plants. All the data are means ± SD, from left to right, n = 13, 13, 12, 19, 15, 9, 4, 8, 14, 3. (B) Triparental triploid plant recovered from three accession cross (TT3), Col-0, Ler and C24 at flowering end stage corresponding to 44 DAS for Col-0, Ler and C24, and 102 DAS for TT3. The number in parenthesis indicates the average DAS of flowering termination for each genotype. All the data are means ± SEM, (n = 3 independent experiments for Col-0, Ler, and C24, n = 2 for TT3). Scale bar, 10 cm.

Comment in

  • Shaping the genome of plants.
    Chaudhary A, Tofanelli R, Schneitz K. Chaudhary A, et al. Elife. 2020 Feb 6;9:e54874. doi: 10.7554/eLife.54874. Elife. 2020. PMID: 32027306 Free PMC article.

References

    1. Armstrong SJ, Franklin FC, Jones GH. Nucleolus-associated telomere clustering and pairing precede meiotic chromosome Synapsis in Arabidopsis thaliana. Journal of Cell Science. 2001;114:4207. - PubMed
    1. Bolger AM, Lohse M, Usadel B. Trimmomatic: a flexible trimmer for illumina sequence data. Bioinformatics. 2014;30:2114–2120. doi: 10.1093/bioinformatics/btu170. - DOI - PMC - PubMed
    1. Clough SJ, Bent AF. Floral dip: a simplified method for Agrobacterium-mediated transformation of Arabidopsis thaliana. The Plant Journal. 1998;16:735–743. doi: 10.1046/j.1365-313x.1998.00343.x. - DOI - PubMed
    1. Coate JE, Doyle JJ. Variation in transcriptome size: are we getting the message? Chromosoma. 2015;124:27–43. doi: 10.1007/s00412-014-0496-3. - DOI - PubMed
    1. Comai L. The advantages and disadvantages of being polyploid. Nature Reviews Genetics. 2005;6:836–846. doi: 10.1038/nrg1711. - DOI - PubMed

Publication types

Associated data