. 2020 May 1;130(5):2712-2726.
doi: 10.1172/JCI134402.

Epigenetic driver mutations in ARID1A shape cancer immune phenotype and immunotherapy

Affiliations

Epigenetic driver mutations in ARID1A shape cancer immune phenotype and immunotherapy

Jing Li et al. J Clin Invest. .

Abstract

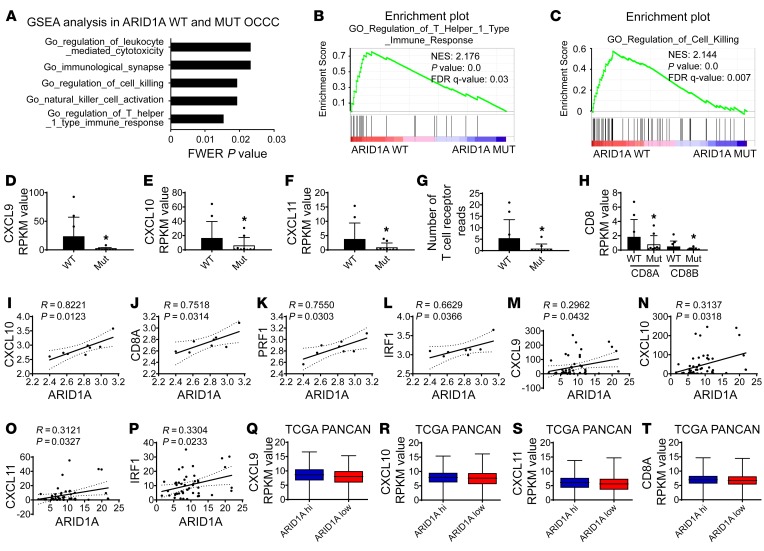
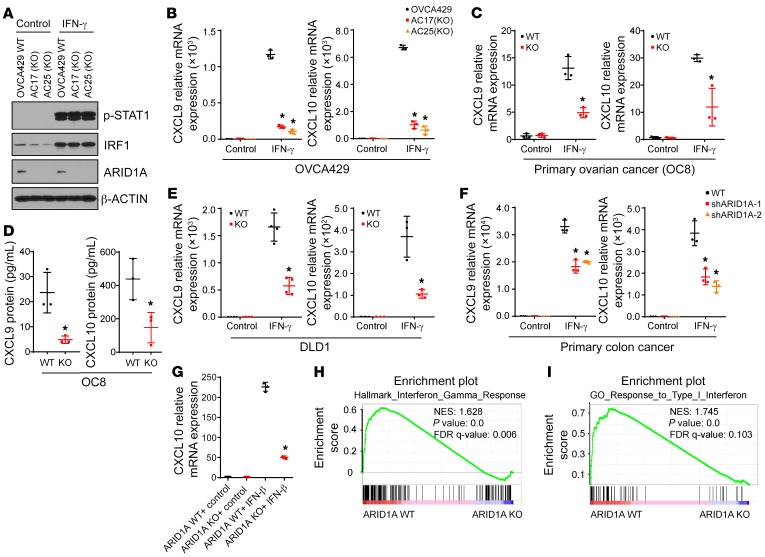
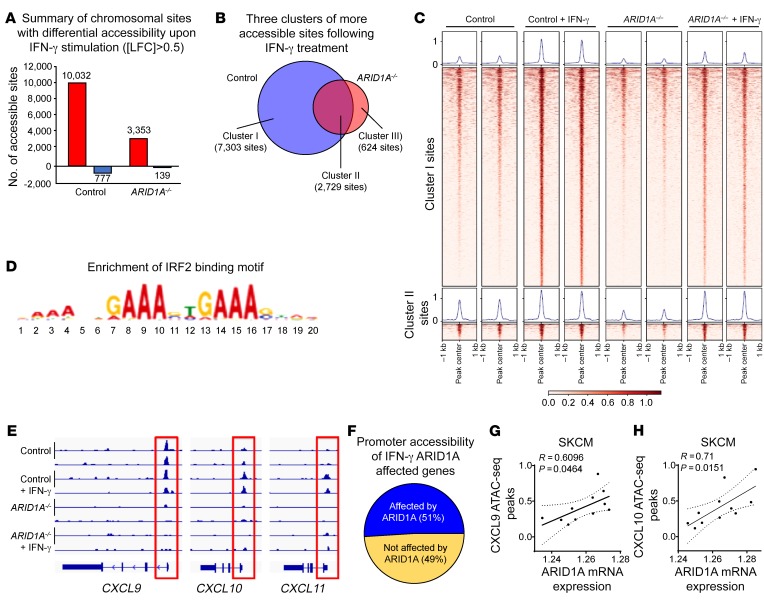
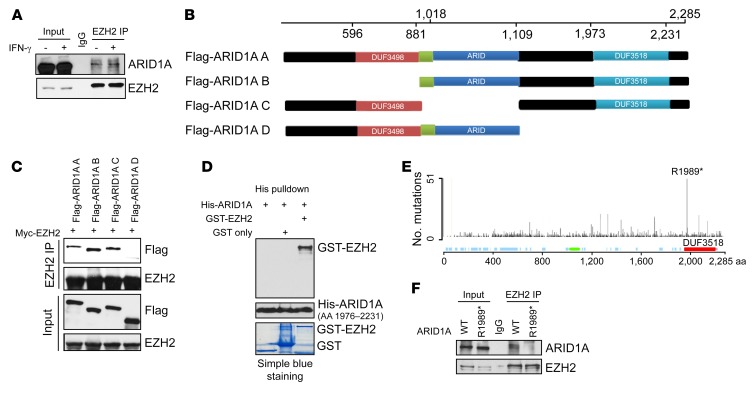
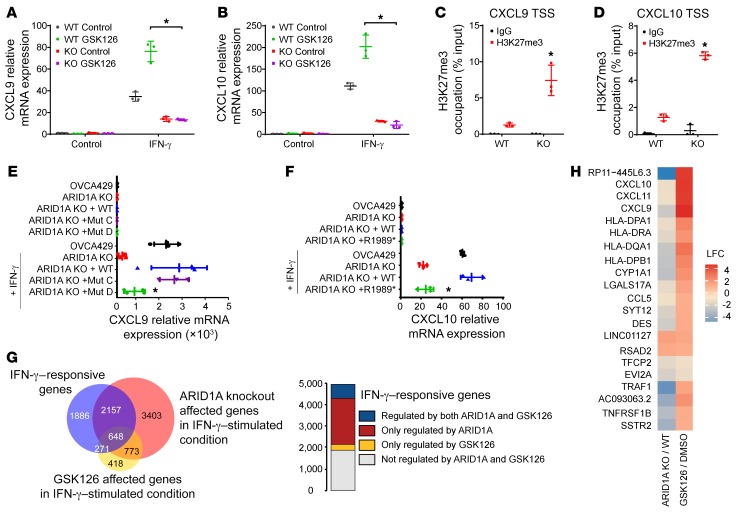
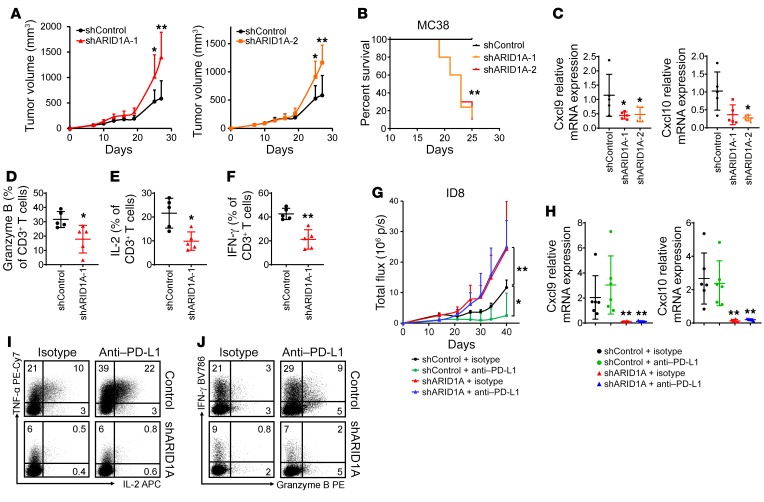
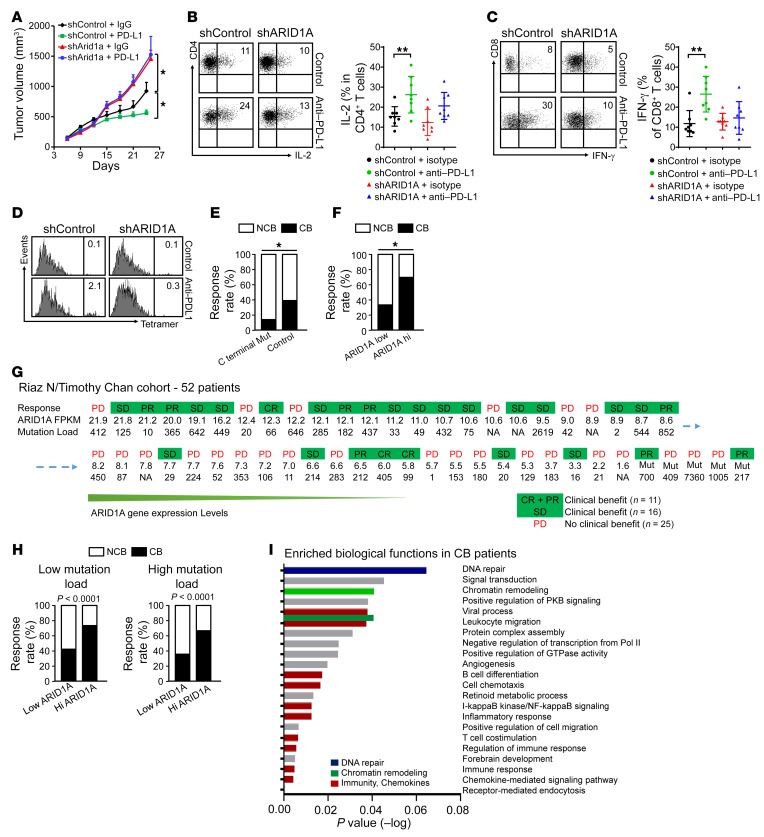
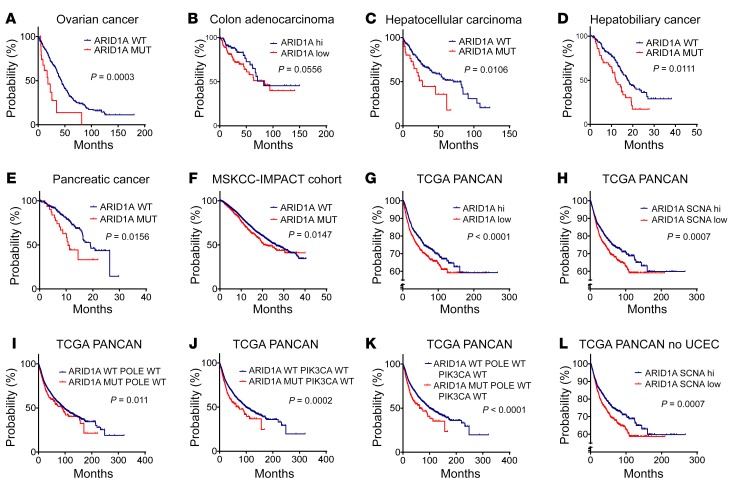
Whether mutations in cancer driver genes directly affect cancer immune phenotype and T cell immunity remains a standing question. ARID1A is a core member of the polymorphic BRG/BRM-associated factor chromatin remodeling complex. ARID1A mutations occur in human cancers and drive cancer development. Here, we studied the molecular, cellular, and clinical impact of ARID1A aberrations on cancer immunity. We demonstrated that ARID1A aberrations resulted in limited chromatin accessibility to IFN-responsive genes, impaired IFN gene expression, anemic T cell tumor infiltration, poor tumor immunity, and shortened host survival in many human cancer histologies and in murine cancer models. Impaired IFN signaling was associated with poor immunotherapy response. Mechanistically, ARID1A interacted with EZH2 via its carboxyl terminal and antagonized EZH2-mediated IFN responsiveness. Thus, the interaction between ARID1A and EZH2 defines cancer IFN responsiveness and immune evasion. Our work indicates that cancer epigenetic driver mutations can shape cancer immune phenotype and immunotherapy.

Keywords: Cancer immunotherapy; Immunology; T cells.


Conflict of interest statement

Conflict of interest: WZ has served as a scientific advisor for Cstone, Oncopia, and Hengenix.

Figures

Figure 1
Figure 1. ARID1A gene status correlates with cancer immune signature.
(AH) Relationship between ARID1A mutations and immune signature genes. RNA-Seq was conducted in patients with OCCC. Nine patients with ARID1A mutations, 9 patients with WT ARID1A. (A) Top 5 GSEA pathways of transcriptome between WT and mutated ARID1A cancers are shown. (B) Th1-type immune response GSEA pathway is enriched in WT ARID1A OCCC patients, Q = 0.025529487. (C) Cytotoxic gene signatures were enriched in WT ARID1A OCCC patients, Q = 0.007425. (DH) CXCL9 (D), CXCL10 (E), CXCL11 (F), TCR (G), and CD8 (H) RPKM values of represented transcripts are shown. *P < 0.05. (IL) ARID1A gene expression levels correlated with CXCL10 (I), CD8A (J), PRF1 (K), IRF1 (L) in 8 OCCC patients from Wu et al. study (30). (MP) ARID1A gene expression levels correlated with CXCL9 (M), CXCL10 (N), CXCL11 (O), and IRF1 (P) gene expression levels in 47 WT ARID1A metastatic melanoma patients. (QT) CXCL9 (Q), CXCL10 (R), CXCL11 (S), CD8A (T) gene expression levels were higher in ARID1A high group, compared with ARID1A low group in TCGA pan-cancer (PANCAN) data set: 3838 patients in ARID1A high group, 3839 patients in ARID1A low group. For box-and-whisker plots in QT, the center line denotes the median value (50th percentile); the box contains the 25th to 75th percentiles of the data set. The whiskers mark the maximum and minimum values, *P < 0.001.
Figure 2
Figure 2. ARID1A mutations impair IFN signaling pathways in tumor.
(A) Effects of ARID1A knockout on STAT1 activation and IRF1 induction. Two ARID1A-knockout OCCC clones (AC17 and AC25) were generated from the parental cell line OVCA429. Cells were treated with IFN-γ for 24 hours. Relevant proteins were detected by Western blotting. One of 3 repeats is shown (uncut gels are in the online supplemental material). (BF) Effect of ARID1A on IFN-γ–induced CXCL9 and CXCL10 expression in different types of human cancers (primer sequence is in Supplemental Table 8). Human ovarian clear cell cancer cell lines (B), primary serous ovarian cancer cells (OC8) (C and D), colon cancer cell line DLD-1 (E), and primary colon cancer cells (F) were treated with IFN-γ for indicated hours. Chemokine expression was quantified by real-time PCR (B, C, E, and F) or ELISA (D). (Mean ± SD, n = 3–4, *P < 0.05). (G) Effect of ARID1A on IFN-γ–induced CXCL10 expression. WT and knockout ARID1A ovarian clear cell cancer cells were treated with IFN-γ for 8 hours. CXCL10 expression was quantified by real-time PCR. (Mean ± SD, n = 3, *P < 0.05). (H and I) Effect of ARID1A on type II (H) and type I (I) IFN gene signatures; WT and knockout ARID1A ovarian clear cell cancer cells were subjected to RNA-Seq. Based on the RNA-Seq data, GSEA was performed. *P = 0.00 (H and I) FDR Q value = 0.0065 (H), FDR Q value = 0.1 (I).
Figure 3
Figure 3. ARID1A regulates IFN-γ–signaling gene chromatin accessibility.
(A and B) Genome-wide analysis (A) and Venn diagram (B) showing differentially accessible chromatin sites (|LFC| > 0.5) after IFN-γ stimulation in ARID1A-proficient (WT) and ARID1A-deficient (KO) OVCA-429 cells. (C) Chromatin accessibility heatmaps of ARID1A-proficient (WT) and ARID1A-deficient (KO) OVCA-429 cells. The heatmaps demonstrated the chromatin sites in cluster I (top) and cluster III (bottom). Aggregated peak intensity within 1 kb center of chromatin regions with differential accessibility is shown. (D) IRF2-binding motif was among the most significantly enriched motifs in clusters I, II, and III. (E) Examples of IFN-γ–responsive sites with less accessibilities in ARID1A-deficient (KO) OVCA-429 cells. The graph shows accessible sites near CXCL9, CXCL10, and CXCL11. (F) Pie chart illustrating accessibility changes of chromosomal sites adjacent to promoters (within 5 kb) of IFN-γ–responsive and ARID1A-affected genes. Blue: Promoters with differentially accessible sites following ARID1A loss. Yellow: Promoters without significant changed sites following ARID1A loss. (G and H) Correlation between ARID1A expression and average chromatin accessibility peaks near CXCL9 gene (221 peaks) (G) and CXCL10 (H) (219 peaks). Each dot represents an individual donor. ARID1A gene expression is log transformed. Eleven patients with WT skin cutaneous melanoma. P = 0.0464 (G), P = 0.0151 (H).
Figure 4
Figure 4. ARID1A biochemically interacts with EZH2.
(A) Interaction between ARID1A and EZH2 in primary high-grade serous ovarian cancer cells (OC8). Endogenous EZH2 was immunoprecipitated with anti-EZH2 and ARID1A was probed with Western blot. One of 3 is shown. (B) Schematic representation of the full-length ARID1A (ARID1A A) and multiple ARID1A mutants (ARID1A B, C, D). The full-length ARID1A and mutants were used for co-interaction analyses. (C) Interaction between ARID1A and EZH2. Myc-EZH2 and Flag-ARID1A full-length and mutants were ectopically expressed in HEK293T cells, followed by EZH2 immunoprecipitations and immunoblotting with Flag and EZH2 antibodies. Inputs are shown in bottom panels. One of 3 is shown. (D) In vitro binding of ARID1A to EZH2. Recombinant His-ARID1A C-terminal DUF 3518 domain partial protein (AA1976-2231) was incubated with GST-EZH2 recombinant protein, followed by His tag pulldown and immunoblotting with GST antibody. Inputs are shown in bottom panels. One of 3 is shown. (E) R1989* hotspot mutation of ARID1A in all types of cancer. Image was adopted from Cosmic website (https://cancer.sanger.ac.uk/cosmic), and double-checked in Cbioportal. (F) Interaction between ARID1A R1989* mutant and EZH2. HEK293T cells were transfected with WT Flag-ARID1A and R1989* mutant expressing plasmids, followed by EZH2 immunoprecipitation and immunoblotting with ARID1A and EZH2 antibodies. One of 3 is shown.
Figure 5
Figure 5. ARID1A functionally interacts with EZH2.
(A and B) Effect of ARID1A on EZH2-mediated Th1-type chemokine repression in ovarian cancer cells. ARID1A WT or knockout OC8 cells were pretreated with GSK126, following IFN-γ treatment for 8 hours. CXCL9 (A) and CXCL10 (B) expression were quantified by real-time PCR. Mean ± SD, n = 3 with repeats, *P = 0.0032 (A), *P = 0.0014 (B), Student’s 2-tailed t tests. (C and D) Effect of ARID1A on H3K27me3-mediated Th1-type chemokine repression in ovarian cancer cells. ARID1A WT or knockout OC8 cells were treated with IFN-γ for 6 hours. H3K27me3 ChIP was performed. H3K27me3 levels on the promoters of CXCL9 and CXCL10 were normalized to the input. Mean ± SD, n = 3–4, *P = 0.00155 (C), *P = 0.00003 (D), Student’s 2-tailed t tests. (E) Effect of ARID1A C-terminal truncation on CXCL9 gene expression in ovarian cancer cells. ARID1A-knockout OVCA429 cells were transfected with full-length ARID1A, ARID1A mutant C, and ARID1A mutant D (ARID1A C-terminal truncation) (see Figure 4B). CXCL9 expression was quantified by real-time PCR. (n = 3, *P = 0.0017, Student’s 2-tailed t tests). (F) Effect of ARID1A R1989* mutation on CXCL10 gene expression in ovarian cancer cells. ARID1A-knockout OVCA429 cells were transfected with WT ARID1A or ARID1A R1989* mutants and stimulated with IFN-γ for 12 hours. CXCL10 expression was quantified by real-time PCR. (n = 3, *P = 0.028, Student’s t tests). (G) Venn diagram depicting overlap between genes significantly regulated following IFN-γ stimulation (blue), ARID1A knockout (red), or GSK126 treatment (yellow) in OVCA-429 cells. Stacked bar plot depicting the distribution of ARID1A or GSK126 regulation status of IFN-γ–responsive genes. (H) Log2 fold change (LFC) of top IFN-γ–responsive genes that are significantly regulated following ARID1A knockout or GSK126 treatment, n = 2.
Figure 6
Figure 6. ARID1A regulates spontaneous tumor immunity in vivo.
(A and B) Effects of ARID1A on MC38 tumor growth and mouse survival in C57BL/6 mice. Mice were inoculated with MC38 expressing shARID1As and control vectors (the same control vectors for shARID1A-1 and shARID1A-2). Tumor volume (A) and mouse survival (B) were monitored. Mean ± SD, n = 7–8, Mann-Whitney U test (A). *P < 0.05; **P < 0.01. Kaplan-Meier analysis (B). (C) Effect of ARID1A on MC38 tumor chemokine expression. CXCL9 and CXCL10 transcripts were quantified by real-time PCR in shARID1A- and vector-expressing MC38 tumors in vivo. Mean ± SD, n = 5, Mann-Whitney U test; CXCL9: *P = 0.0317; CXCL10: *P = 0.0159. (DF) Effect of ARID1A on MC38 tumor–infiltrating T cell function. Tumor-infiltrating granzyme B+ (D), IL-2+ (E), and IFN-γ+ (F) T cells were analyzed on day 17. Gated on CD45+CD3+ T cells. Mean ± SD, n = 5, Mann-Whitney U test, *P < 0.05, **P < 0.01. (G) Effect of ARID1A on ID8 ovarian cancer growth in C57BL/6 mice. Mice were inoculated with luciferase-ID8 expressing shARID1A and control vectors. Tumor volume was monitored. Mean ± SD, n = 5–6, Mann-Whitney U test, *P < 0.05; **P < 0.01. (H) Effect of ARID1A on ID8 tumor chemokine expression. CXCL9 and CXCL10 transcripts were quantified by real-time PCR in shARID1A- and vector-expressing ID8 tumors in vivo. Mean ± SD, n = 5–6, Mann-Whitney U test, **P < 0.01. (I and J) Effect of ARID1A in ID8 tumor-infiltrating T cell function. Tumor-infiltrating TNF-α+ and IL-2+ CD4+ (I) and IFN-γ+ and granzyme B+ CD8+ (J) T cells were analyzed. n = 5–6.
Figure 7
Figure 7. ARID1A gene status affects checkpoint therapy.
(AD) Effect of ARID1A on anti–PD-L1 therapy in MC38-bearing mice. Mice bearing shARID1A and vector MC38 tumors were treated with anti–PD-L1 or isotype. (A) Tumor volume was monitored. (BD) Tumor IL-2+CD4+ (B), IFN-γ+CD8+ (C), and Adpgk-specific CD8+ (D) T cells were analyzed on day 25. One of 6 experiments. Mean ± SD, Mann-Whitney U test. (E) Effect of ARID1A mutations on immunotherapeutic efficacy in metastatic melanoma patients with (n = 14) or without (n = 268) ARID1A C-terminal mutations. Response rate is shown in patients with clinical benefits (CB, n = 109), including complete response (CR), partial response (PR), and stable disease (SD), and progressive patients (PD) (nonclinical benefits, NCB, n = 173). One-sided χ2 test, P = 0.0326. (F and G) Effect of ARID1A levels on immunotherapeutic efficacy in 52 metastatic melanoma patients with 47 WT and 5 mutated ARID1A. (F) Response rate is shown in patients with low (n = 26) and high (n = 26) ARID1A expression. ARID1A-mutated patients were placed in the ARID1A low group. Two-sided χ2 test, P = 0.0125. (G) Response status with corresponding specific ARID1A fragments per kilobase of transcript per million mapped reads is shown. (H) Effect of tumor mutation load (TMB) on immunotherapeutic efficacy. WT ARID1A melanoma patients were divided into high-TMB (n = 29) and low-TMB (n = 22) groups. Response rate was analyzed in patients with high and low TMB. In high-TMB group, 14 and 15 patients expressed, respectively, low and high ARID1A. In low-TMB group, 11 and 11 patients expressed, respectively, low and high ARID1A. Cutoff value: 100 mutations (31). Two-sided χ2 test, P < 0.0001. (I) Effect of anti–PD-1 on biological pathways in melanoma patients. Differential gene expression between CB and NCB groups was entered for DAVID pathway analysis (65). *P < 0.05; **P < 0.01.
Figure 8
Figure 8. ARID1A gene status affects clinical outcome.
(A) Overall survival (OS) of WT (n = 401) and mutated (n = 20) ARID1A ovarian cancer patients in TCGA and MSKCC-IMPACT. Log-rank test, P = 0.0003. (B) OS of WT patients, ARID1A mRNA high (n = 119) and low (n = 119) colon adenocarcinoma patients in TCGA. P = 0.0556. (C) OS of WT (n = 341) and mutated (n = 31) ARID1A hepatocellular carcinoma patients. P = 0.0106. (D) OS of WT (n = 190) and mutated (n = 49) ARID1A hepatobiliary cancer patients. P = 0.0111. (E) OS of WT (n = 328) and mutated (n = 38) ARID1A pancreatic cancer patients. P = 0.0156. (F) OS of WT (n = 6913) and mutated (n = 661) ARID1A patients in MSKCC-IMPACT. P = 0.0147. (G) Disease-free survival (DFS) of high (n = 2098) and low (n = 2098) tumor ARID1A transcripts in MSKCC-IMPACT. P < 0.0001. (H) DFS of high (n = 2034) and low (n = 2034) tumor WT ARID1A somatic copy numbers in patients in TCGA PANCAN. P = 0.0007. (I) OS of WT (n = 7979) and mutated (n = 644) ARID1A patients in TCGA PANCAN. Patients with POLE mutations were excluded. P = 0.011. (J) OS of WT (n = 6897) and mutated (n = 457) ARID1A patients in TCGA PANCAN. Patients with PIK3CA mutations were excluded. P = 0.0002. (K) OS of WT (n = 6745) and mutated (n = 401) ARID1A patients in TCGA PANCAN. Patients with PIK3CA or POLE mutations were excluded. P < 0.0001. (L) DFS of high (n = 1957) and low (n = 1958) WT ARID1A somatic copy numbers in TCGA PANCAN patients. UCEC were excluded. P = 0.0007.

References

    1. Zhang L, et al. Intratumoral T cells, recurrence, and survival in epithelial ovarian cancer. N Engl J Med. 2003;348(3):203–213. doi: 10.1056/NEJMoa020177. - DOI - PubMed
    1. Galon J, et al. Type, density, and location of immune cells within human colorectal tumors predict clinical outcome. Science. 2006;313(5795):1960–1964. doi: 10.1126/science.1129139. - DOI - PubMed
    1. Kryczek I, et al. Phenotype, distribution, generation, and functional and clinical relevance of Th17 cells in the human tumor environments. Blood. 2009;114(6):1141–1149. doi: 10.1182/blood-2009-03-208249. - DOI - PMC - PubMed
    1. Shin DS, et al. Primary resistance to PD-1 blockade mediated by JAK1/2 mutations. Cancer Discov. 2017;7(2):188–201. doi: 10.1158/2159-8290.CD-16-1223. - DOI - PMC - PubMed
    1. Zou W, Wolchok JD, Chen L. PD-L1 (B7-H1) and PD-1 pathway blockade for cancer therapy: mechanisms, response biomarkers, and combinations. Sci Transl Med. 2016;8(328):328rv4. doi: 10.1126/scitranslmed.aad7118. - DOI - PMC - PubMed

Publication types

MeSH terms