

FibroScan-AST (FAST) score for the non-invasive identification of patients with non-alcoholic steatohepatitis with significant activity and fibrosis: a prospective derivation and global validation study
- PMID: 32027858
- PMCID: PMC7066580
- DOI: 10.1016/S2468-1253(19)30383-8
FibroScan-AST (FAST) score for the non-invasive identification of patients with non-alcoholic steatohepatitis with significant activity and fibrosis: a prospective derivation and global validation study
Erratum in
-
Correction to Lancet Gastroenterol Hepatol 2020; 5: 362-73.Lancet Gastroenterol Hepatol. 2020 Apr;5(4):e3. doi: 10.1016/S2468-1253(20)30055-8. Lancet Gastroenterol Hepatol. 2020. PMID: 32171085 Free PMC article. No abstract available.
Abstract
Background: The burden of non-alcoholic fatty liver disease (NAFLD) is increasing globally, and a major priority is to identify patients with non-alcoholic steatohepatitis (NASH) who are at greater risk of progression to cirrhosis, and who will be candidates for clinical trials and emerging new pharmacotherapies. We aimed to develop a score to identify patients with NASH, elevated NAFLD activity score (NAS≥4), and advanced fibrosis (stage 2 or higher [F≥2]).
Methods: This prospective study included a derivation cohort before validation in multiple international cohorts. The derivation cohort was a cross-sectional, multicentre study of patients aged 18 years or older, scheduled to have a liver biopsy for suspicion of NAFLD at seven tertiary care liver centres in England. This was a prespecified secondary outcome of a study for which the primary endpoints have already been reported. Liver stiffness measurement (LSM) by vibration-controlled transient elastography and controlled attenuation parameter (CAP) measured by FibroScan device were combined with aspartate aminotransferase (AST), alanine aminotransferase (ALT), or AST:ALT ratio. To identify those patients with NASH, an elevated NAS, and significant fibrosis, the best fitting multivariable logistic regression model was identified and internally validated using boot-strapping. Score calibration and discrimination performance were determined in both the derivation dataset in England, and seven independent international (France, USA, China, Malaysia, Turkey) histologically confirmed cohorts of patients with NAFLD (external validation cohorts). This study is registered with ClinicalTrials.gov, number NCT01985009.
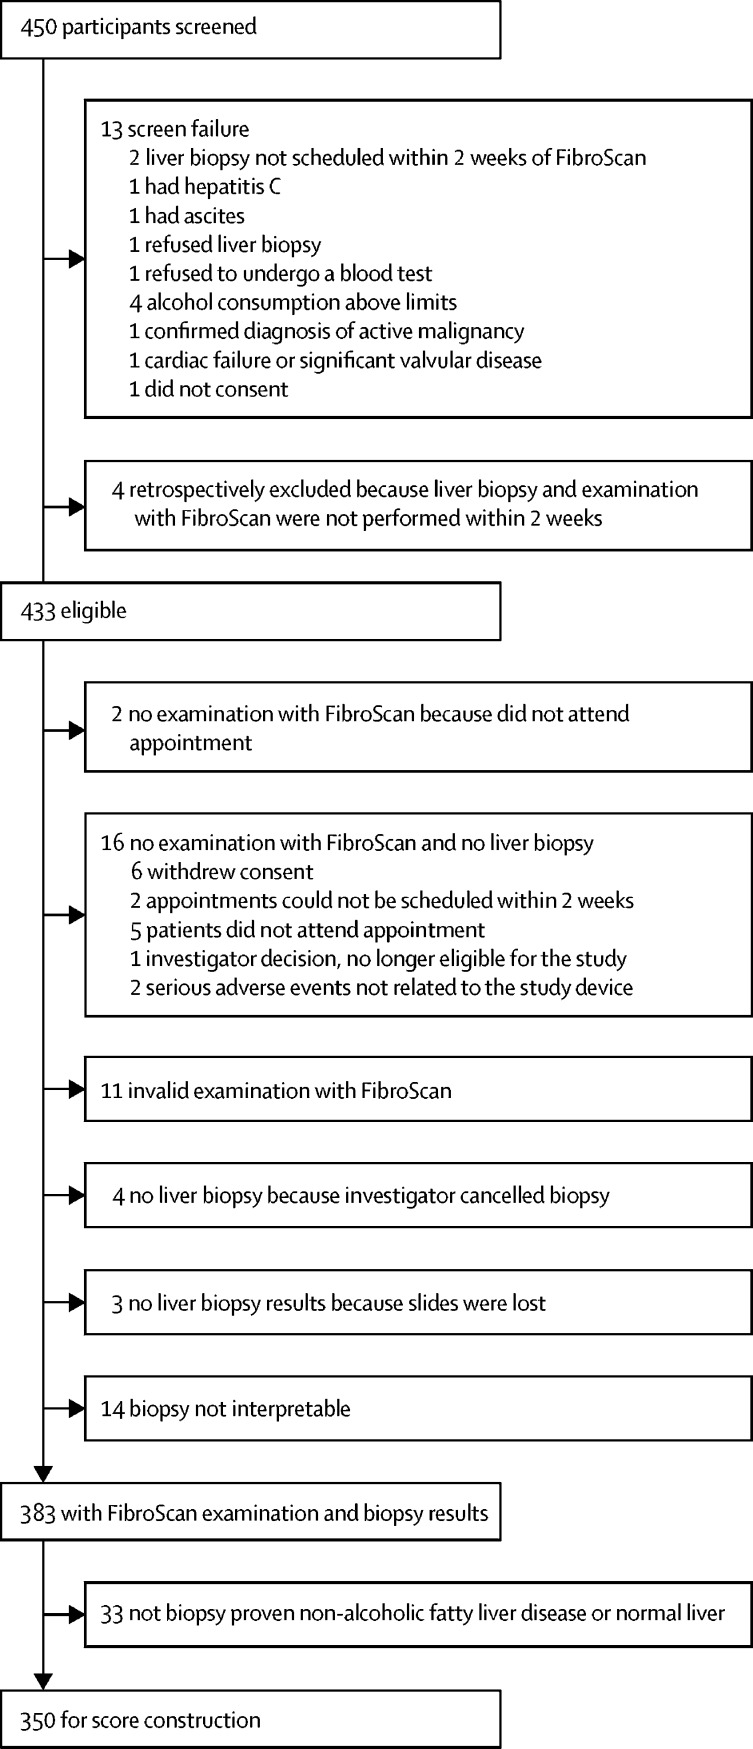
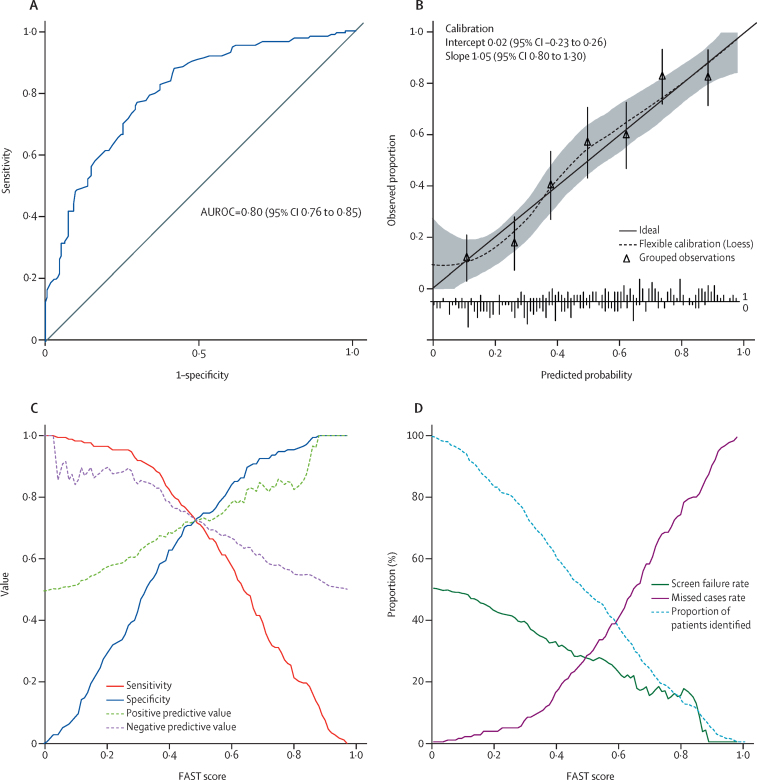
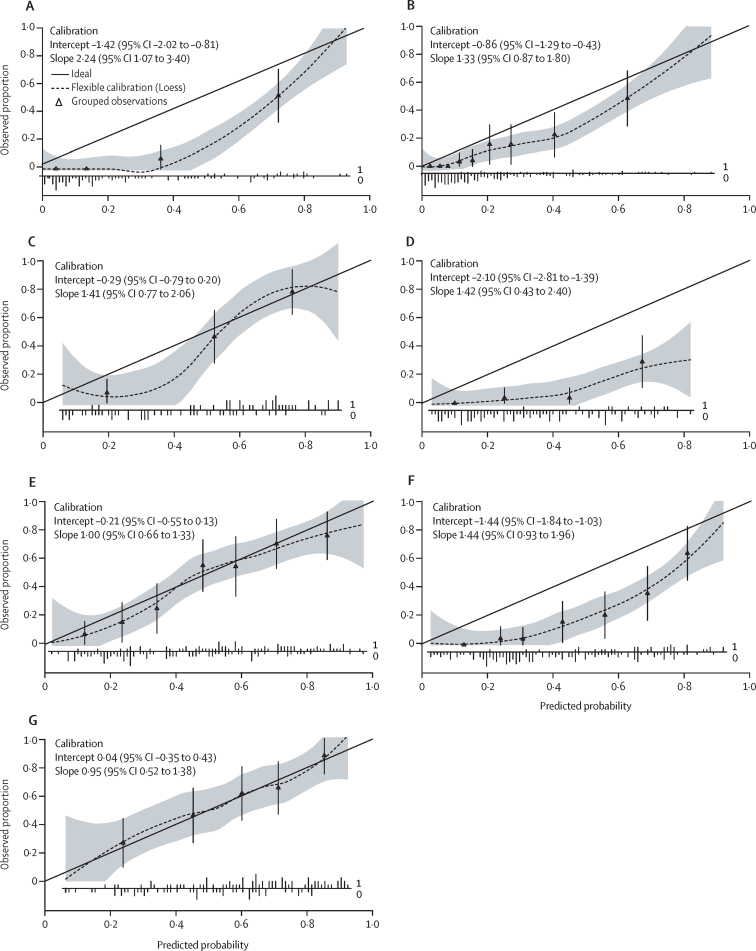
Findings: Between March 20, 2014, and Jan 17, 2017, 350 patients with suspected NAFLD attending liver clinics in England were prospectively enrolled in the derivation cohort. The most predictive model combined LSM, CAP, and AST, and was designated FAST (FibroScan-AST). Performance was satisfactory in the derivation dataset (C-statistic 0·80, 95% CI 0·76-0·85) and was well calibrated. In external validation cohorts, calibration of the score was satisfactory and discrimination was good across the full range of validation cohorts (C-statistic range 0·74-0·95, 0·85; 95% CI 0·83-0·87 in the pooled external validation patients' cohort; n=1026). Cutoff was 0·35 for sensitivity of 0·90 or greater and 0·67 for specificity of 0·90 or greater in the derivation cohort, leading to a positive predictive value (PPV) of 0·83 (84/101) and a negative predictive value (NPV) of 0·85 (93/110). In the external validation cohorts, PPV ranged from 0·33 to 0·81 and NPV from 0·73 to 1·0.
Interpretation: The FAST score provides an efficient way to non-invasively identify patients at risk of progressive NASH for clinical trials or treatments when they become available, and thereby reduce unnecessary liver biopsy in patients unlikely to have significant disease.
Funding: Echosens and UK National Institute for Health Research.
Copyright © 2020 The Author(s). Published by Elsevier Ltd. This is an Open Access article under the CC BY 4.0 license. Published by Elsevier Ltd.. All rights reserved.
Figures
Comment in
-
Driving Nonalcoholic Steatohepatitis Forward Using the FibroScan Aspartate Aminotransferase Score, But Obey the Traffic Lights.Hepatology. 2020 Dec;72(6):2228-2230. doi: 10.1002/hep.31498. Epub 2020 Dec 3. Hepatology. 2020. PMID: 32757393 No abstract available.
References
-
- Younossi Z, Anstee QM, Marietti M. Global burden of NAFLD and NASH: trends, predictions, risk factors and prevention. Nat Rev Gastroenterol Hepatol. 2017;15:11–20. - PubMed
-
- Charlton MR, Burns JM, Pedersen RA, Watt KD, Heimbach JK, Dierkhising RA. Frequency and outcomes of liver transplantation for nonalcoholic steatohepatitis in the United States. Gastroenterology. 2011;141:1249–1253. - PubMed
-
- Tsochatzis EA, Newsome PN. Non-alcoholic fatty liver disease and the interface between primary and secondary care. Lancet Gastroenterol Hepatol. 2018;3:509–517. - PubMed
-
- Sanyal AJ. Past, present and future perspectives in nonalcoholic fatty liver disease. Nat Rev Gastroenterol Hepatol. 2019;16:377–386. - PubMed
Publication types
MeSH terms
Substances
Associated data
LinkOut - more resources
Full Text Sources
Other Literature Sources
Medical
Miscellaneous
