

Ventilation and laboratory confirmed acute respiratory infection (ARI) rates in college residence halls in College Park, Maryland
- PMID: 32028176
- PMCID: PMC7112667
- DOI: 10.1016/j.envint.2020.105537
Ventilation and laboratory confirmed acute respiratory infection (ARI) rates in college residence halls in College Park, Maryland
Abstract
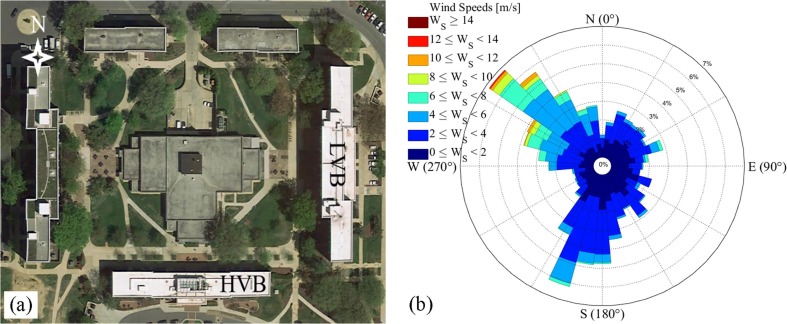
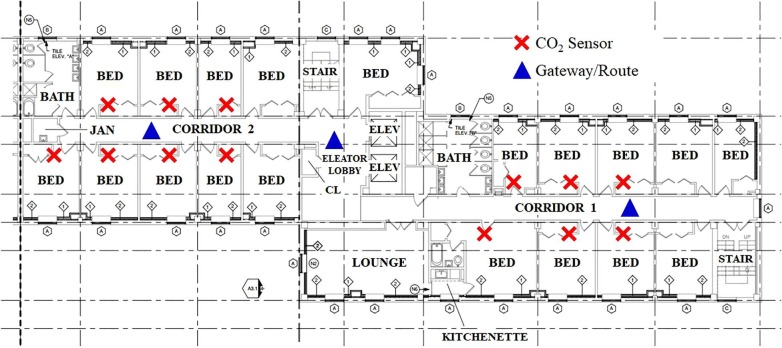
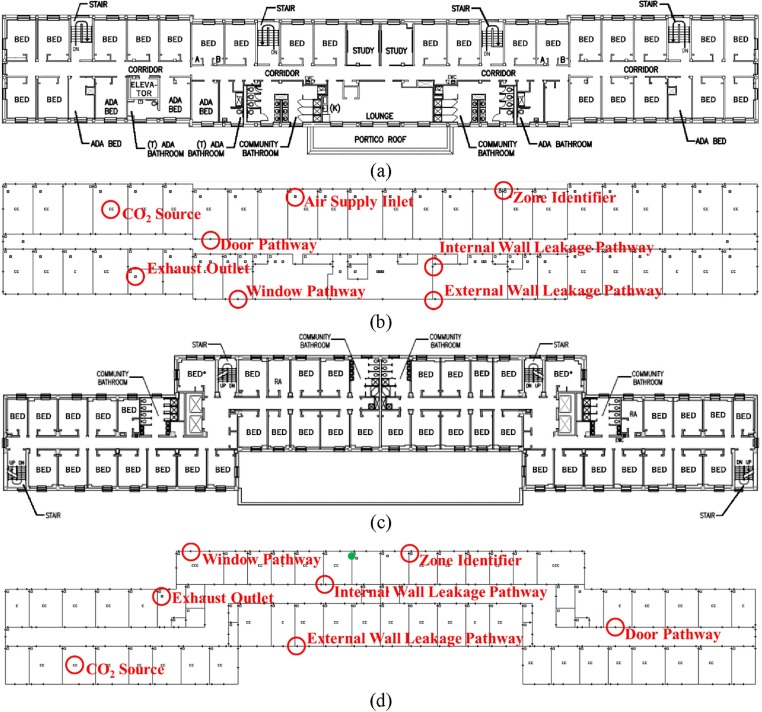
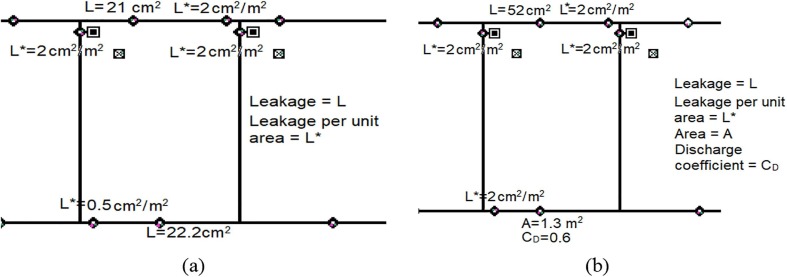
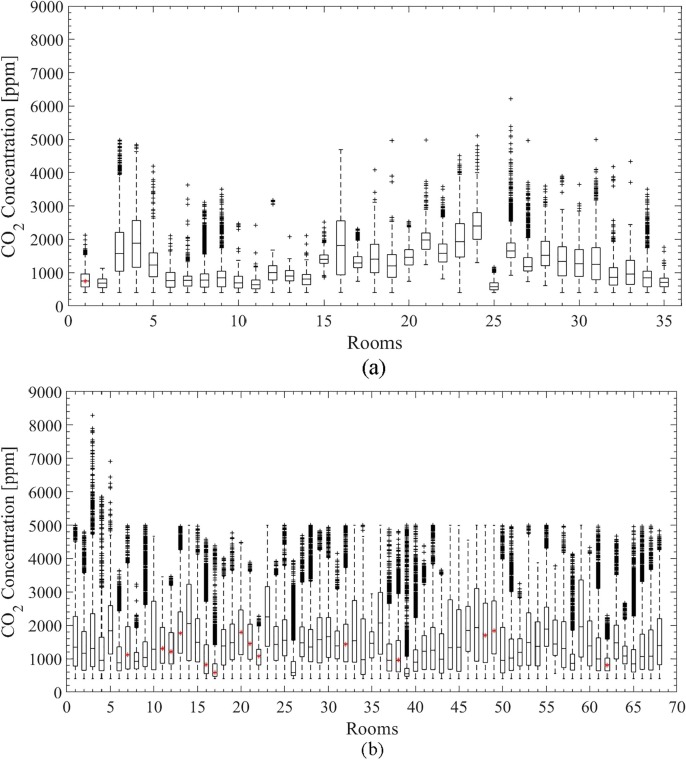
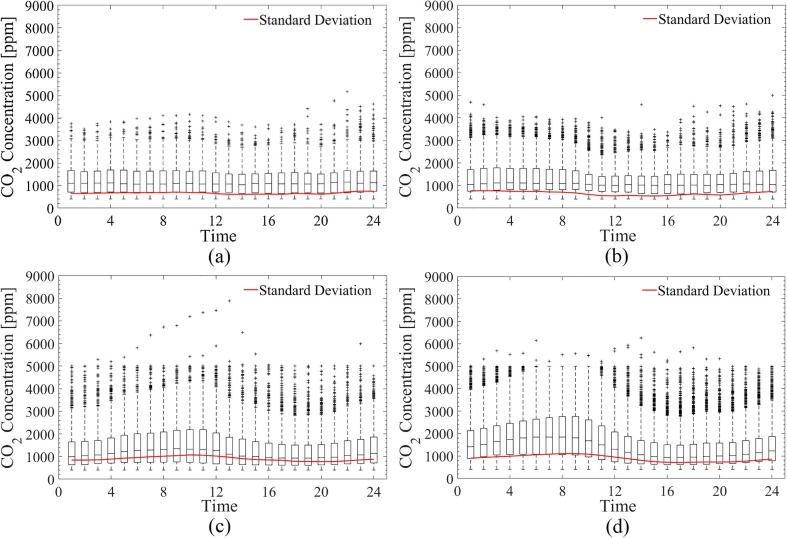
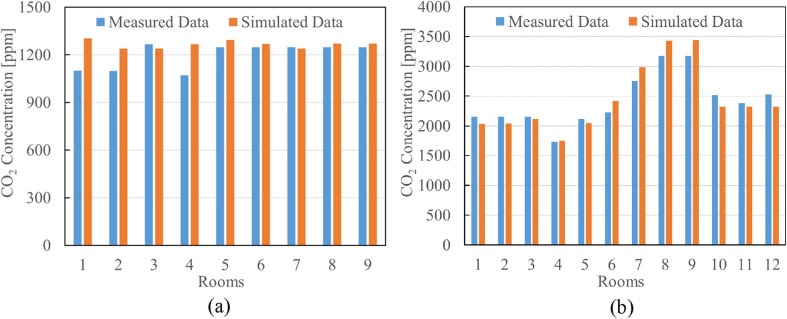
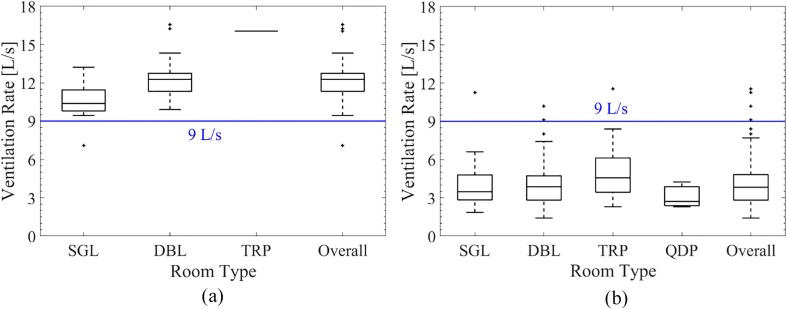
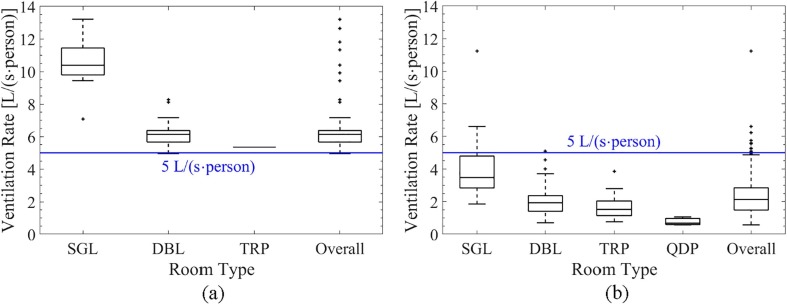
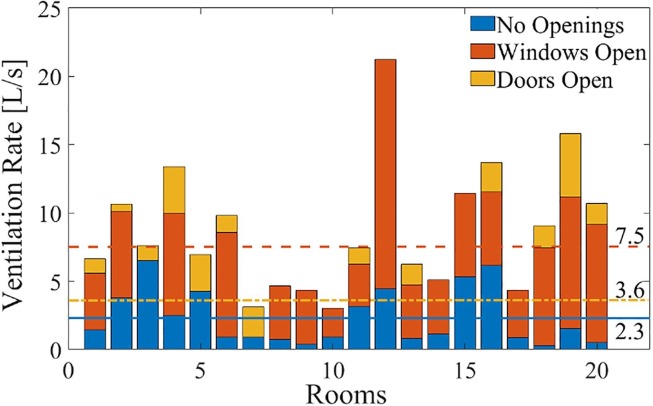
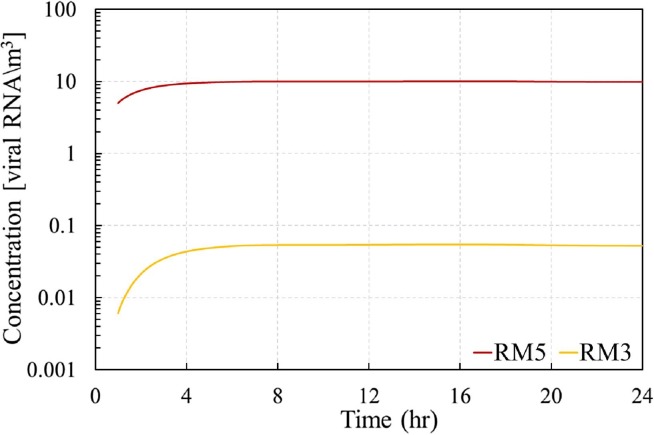
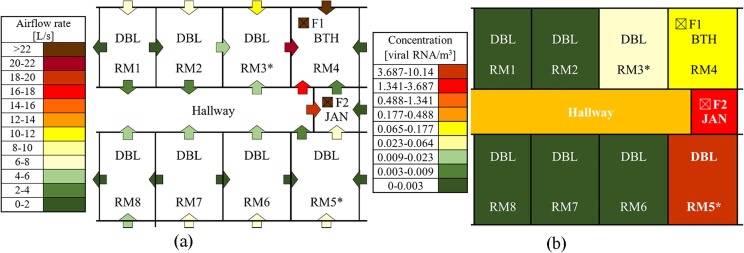
Strategies to protect building occupants from the risk of acute respiratory infection (ARI) need to consider ventilation for its ability to dilute and remove indoor bioaerosols. Prior studies have described an association of increased self-reported colds and influenza-like symptoms with low ventilation but have not combined rigorous characterization of ventilation with assessment of laboratory confirmed infections. We report a study designed to fill this gap. We followed laboratory confirmed ARI rates and measured CO2 concentrations for four months during the winter-spring of 2018 in two campus residence halls: (1) a high ventilation building (HVB) with a dedicated outdoor air system that supplies 100% of outside air to each dormitory room, and (2) a low ventilation building (LVB) that relies on infiltration as ventilation. We enrolled 11 volunteers for a total of 522 person-days in the HVB and 109 volunteers for 6069 person-days in the LVB, and tested upper-respiratory swabs from symptomatic cases and their close contacts for the presence of 44 pathogens using a molecular assay. We observed one ARI case in the HVB (0.70/person-year) and 47 in the LVB (2.83/person-year). Simultaneously, 154 CO2 sensors distributed primarily in the dormitory rooms collected 668,390 useful data points from over 1 million recorded data points. Average and standard deviation of CO2 concentrations were 1230 ppm and 408 ppm in the HVB, and 1492 ppm and 837 ppm in the LVB, respectively. Importantly, this study developed and calibrated multi-zone models for the HVB with 229 zones and 983 airflow paths, and for the LVB with 529 zones and 1836 airflow paths by using a subset of CO2 data for model calibration. The models were used to calculate ventilation rates in the two buildings and potential for viral aerosol migration between rooms in the LVB. With doors and windows closed, the average ventilation rate was 12 L/s in the HVB dormitory rooms and 4 L/s in the LVB dormitory rooms. As a result, residents had on average 6.6 L/(s person) of outside air in the HVB and 2.3 L/(s person) in the LVB. LVB rooms located at the leeward side of the building had smaller average ventilation rates, as well as a somewhat higher ARI incidence rate and average CO2 concentrations when compared to those values in the rooms located at the windward side of the building. Average ventilation rates in twenty LVB dormitory rooms increased from 2.3 L/s to 7.5 L/s by opening windows, 3.6 L/s by opening doors, and 8.8 L/s by opening both windows and doors. Therefore, opening both windows and doors in the LVB dormitory rooms can increase ventilation rates to the levels comparable to those in the HVB. But it can also have a negative effect on thermal comfort due to low outdoor temperatures. Simulation results identified an aerobiologic pathway from a room occupied by an index case of influenza A to a room occupied by a possible secondary case.
Keywords: Acute Respiratory Infection (ARI); Airborne infection control; College dormitory rooms; Infectious bioaerosols; Multi-zone model; Ventilation rate.
Copyright © 2020 The Authors. Published by Elsevier Ltd.. All rights reserved.
Conflict of interest statement
Declaration of Competing Interest The authors declare that they have no known competing financial interests or personal relationships that could have appeared to influence the work reported in this paper.
Figures
References
-
- ASHRAE, 2002. ASHRAE Guideline 14-2002: Measurement of energy and demand savings. American Society of Heating, Refrigerating and Air-Conditioning Engineers, Atlanta.
-
- Ayompe L.M., Duffy A., McCormack J., Conlon M. Validated TRNSYS model for forced circulation solar water heating systems with flat plate and heat pipe evacuated tube collectors. Appl. Therm. Eng. 2011;31:1536–1542.
-
- Bueno de Mesquita P.J., Heidarinejad M., Addo K., Dalgo, D., Mattise N., Srebric J., Milton D.K., 2018. Estimating exposure to infectious influenza aerosols in roommates of influenza cases during the 2012-2013 season on the University of Maryland campus. In: Indoor Air 2018. Philadelphia, PA, USA, July 22–27.
Publication types
MeSH terms
LinkOut - more resources
Full Text Sources
Other Literature Sources
Medical
Research Materials
Miscellaneous
