. 2020 Mar;579(7800):598-602.
doi: 10.1038/s41586-020-2013-6. Epub 2020 Feb 6.

HPF1 completes the PARP active site for DNA damage-induced ADP-ribosylation

Affiliations

HPF1 completes the PARP active site for DNA damage-induced ADP-ribosylation

Marcin J Suskiewicz et al. Nature. 2020 Mar.

Abstract

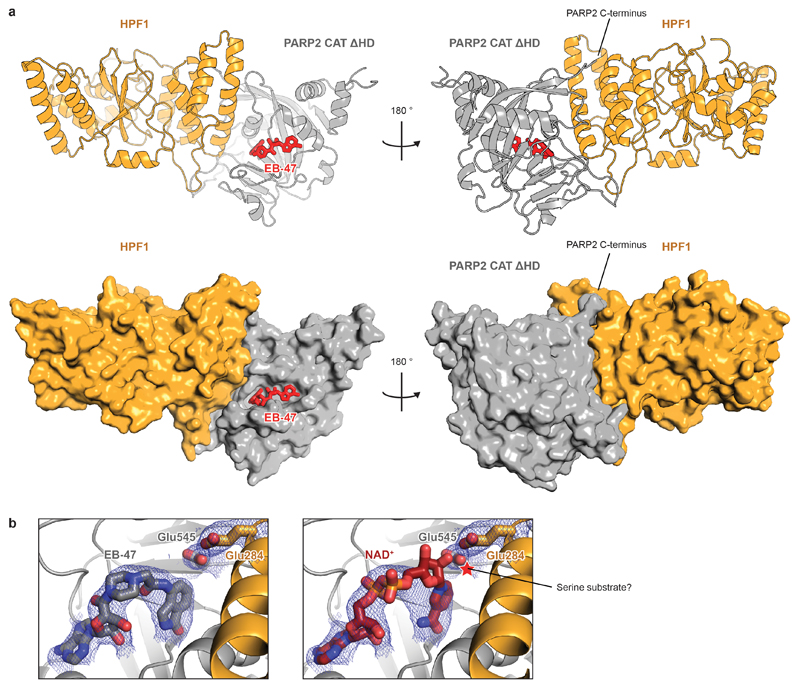
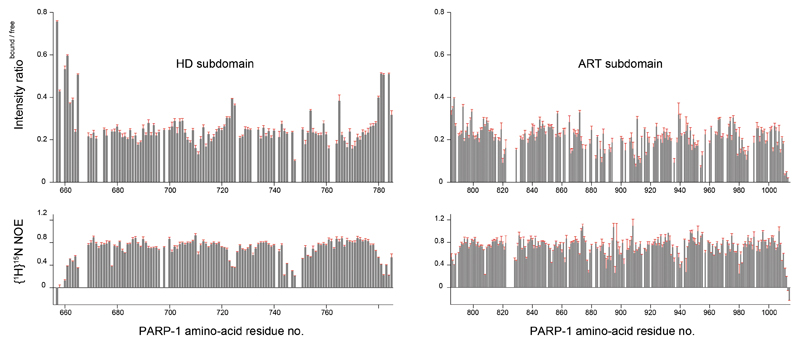
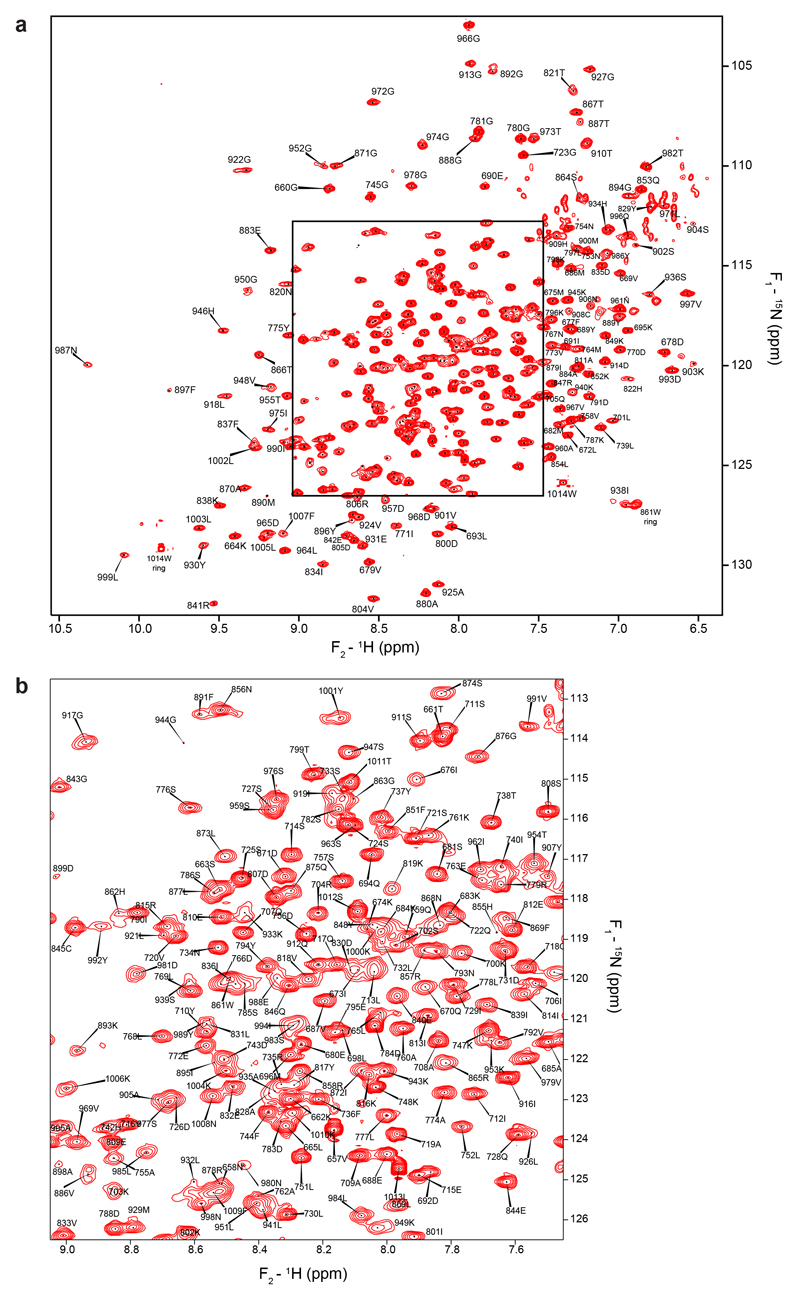
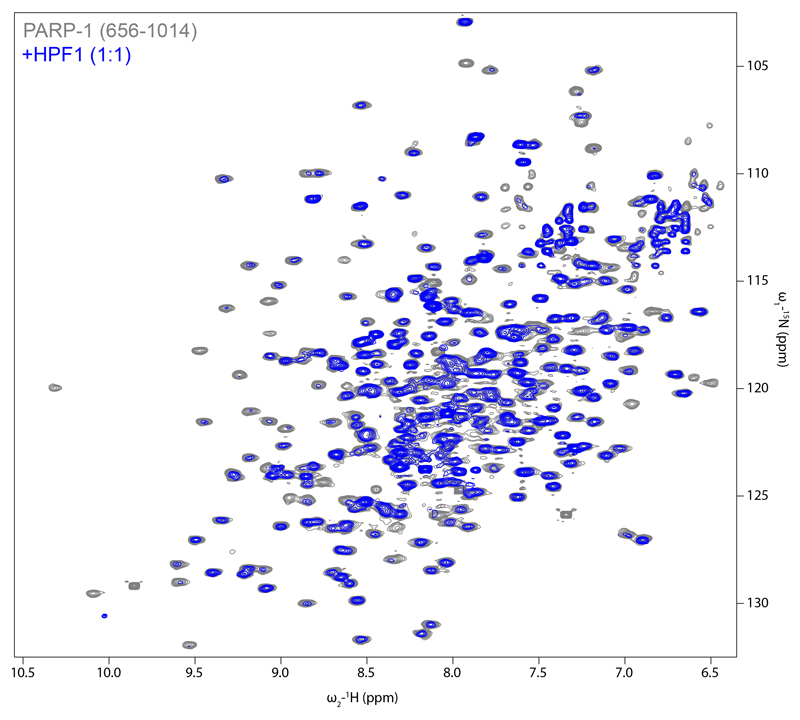
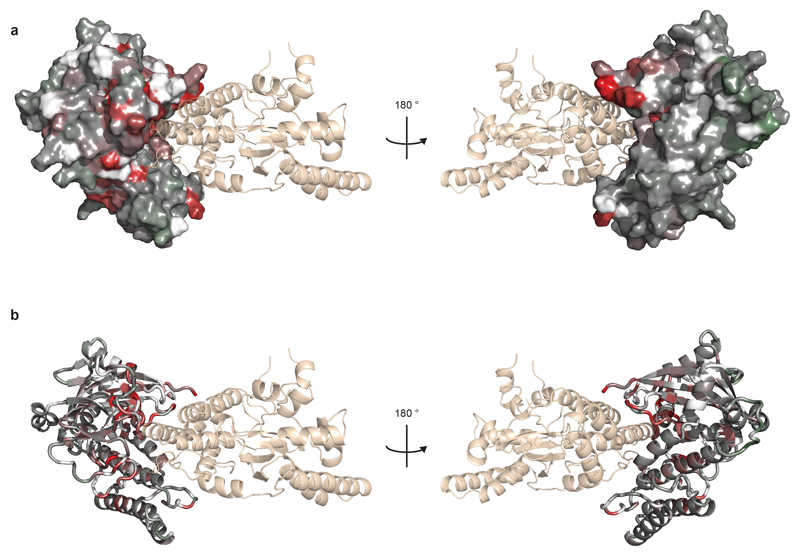
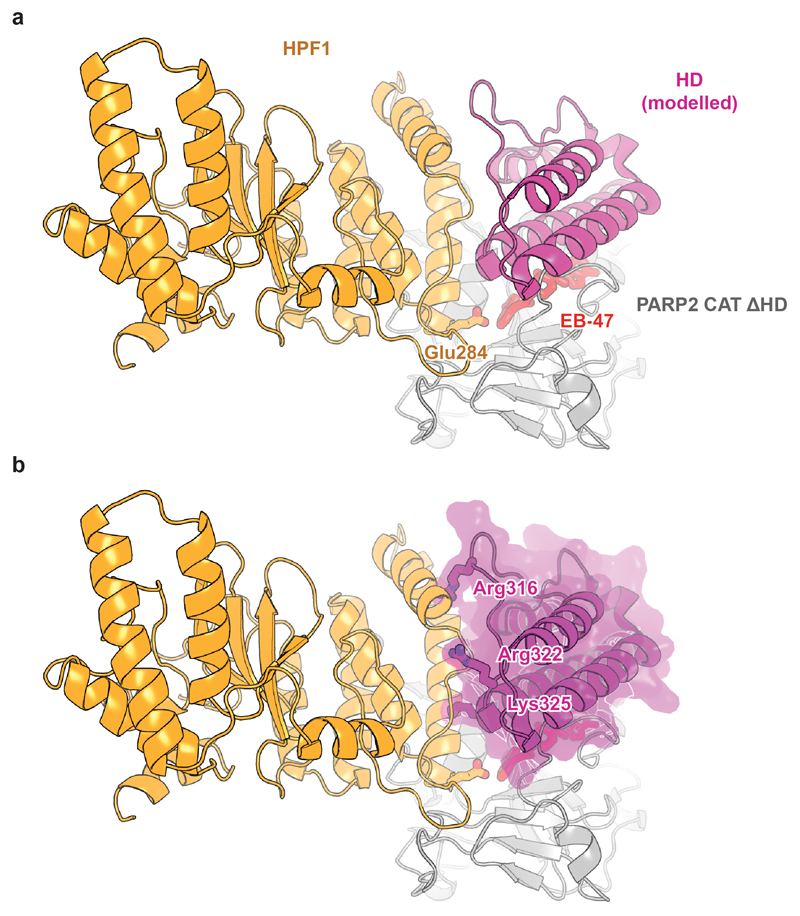
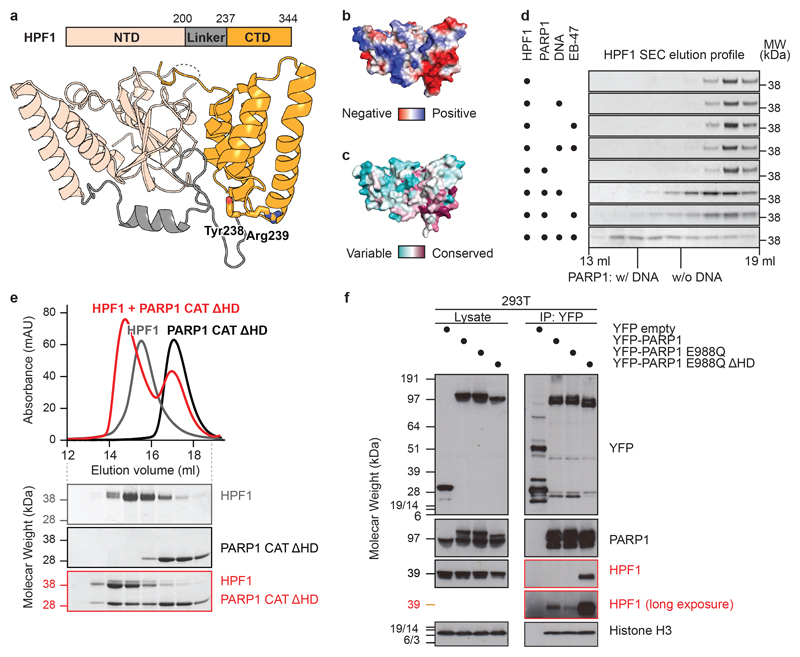
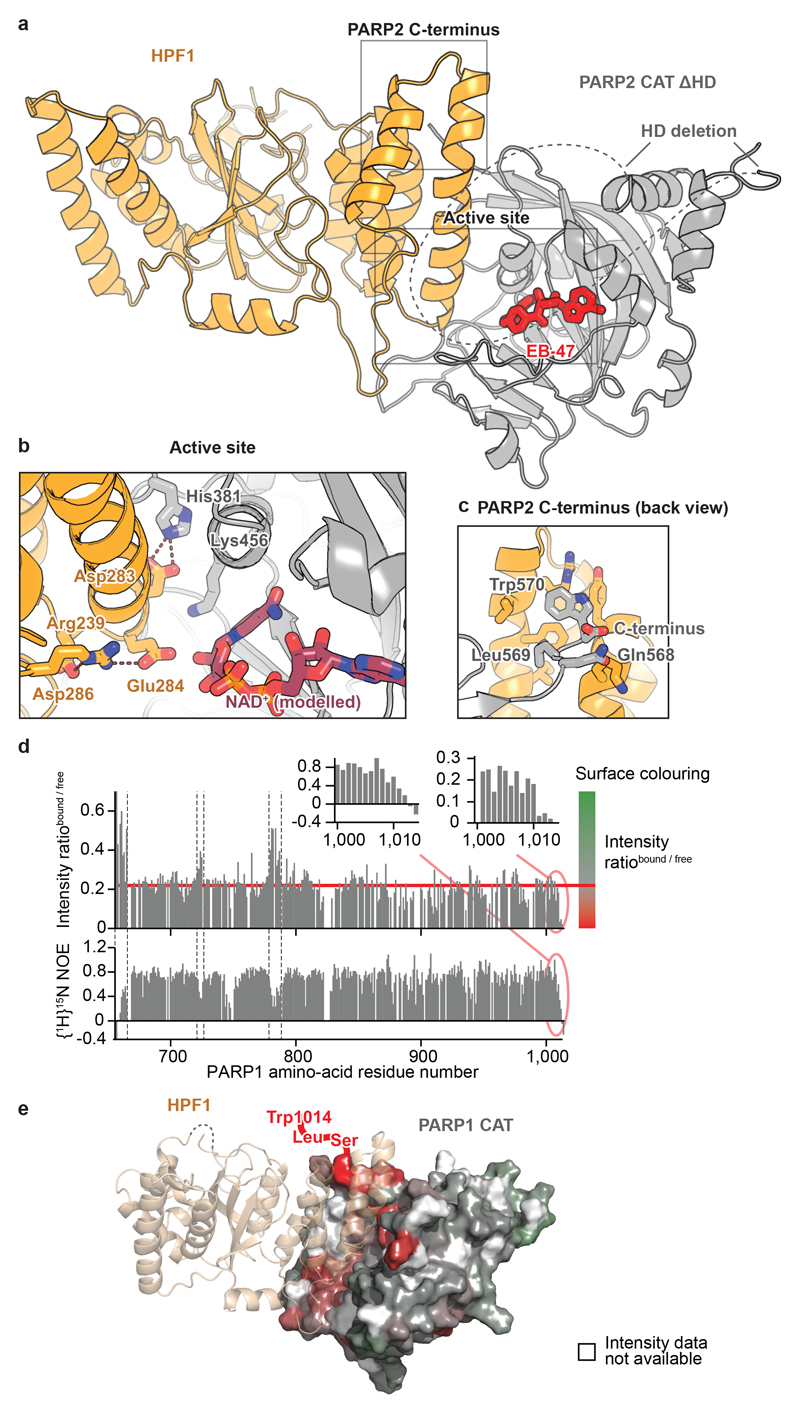
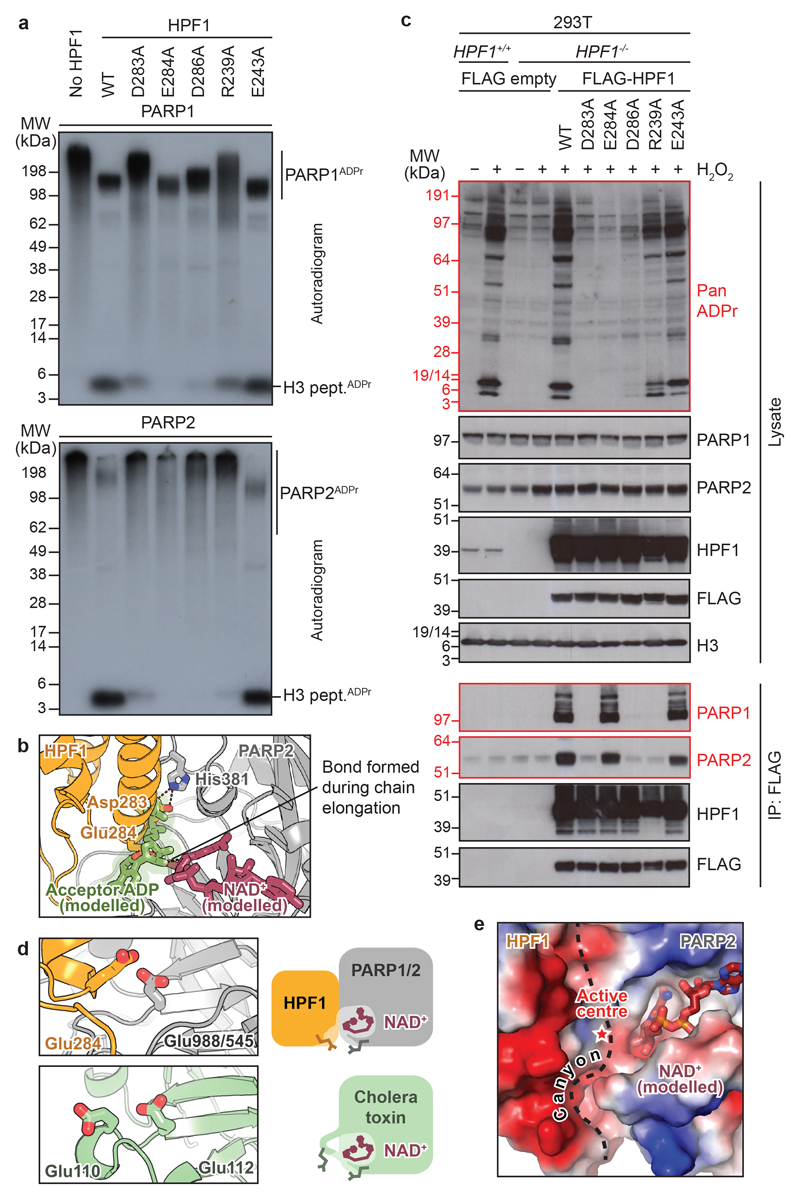
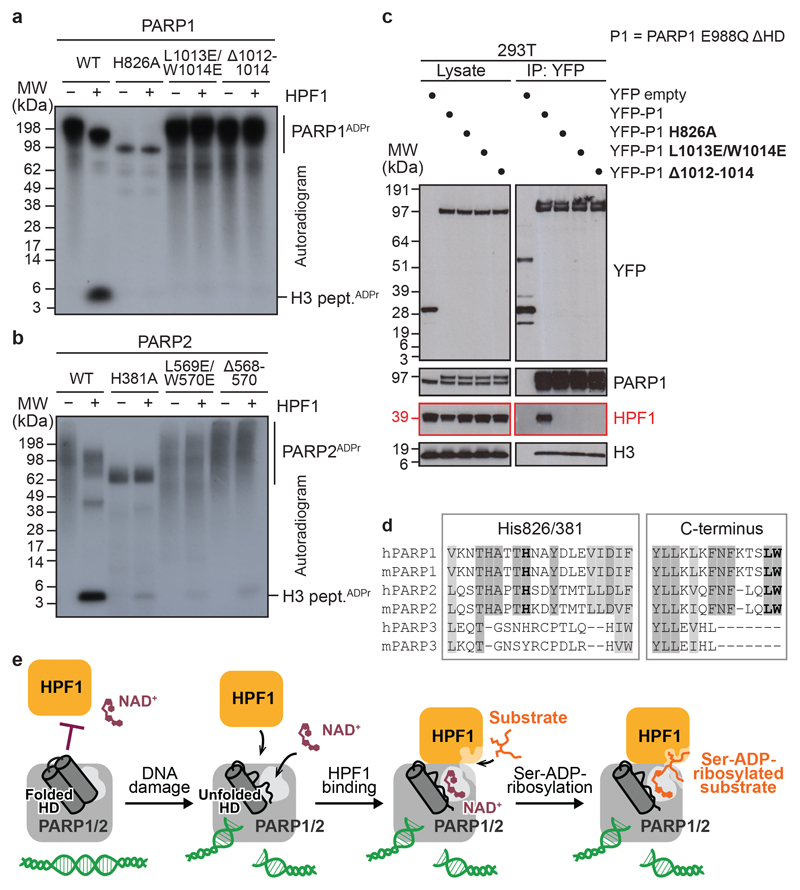
The anti-cancer drug target poly(ADP-ribose) polymerase 1 (PARP1) and its close homologue, PARP2, are early responders to DNA damage in human cells1,2. After binding to genomic lesions, these enzymes use NAD+ to modify numerous proteins with mono- and poly(ADP-ribose) signals that are important for the subsequent decompaction of chromatin and the recruitment of repair factors3,4. These post-translational modifications are predominantly serine-linked and require the accessory factor HPF1, which is specific for the DNA damage response and switches the amino acid specificity of PARP1 and PARP2 from aspartate or glutamate to serine residues5-10. Here we report a co-structure of HPF1 bound to the catalytic domain of PARP2 that, in combination with NMR and biochemical data, reveals a composite active site formed by residues from HPF1 and PARP1 or PARP2 . The assembly of this catalytic centre is essential for the addition of ADP-ribose moieties after DNA damage in human cells. In response to DNA damage and occupancy of the NAD+-binding site, the interaction of HPF1 with PARP1 or PARP2 is enhanced by allosteric networks that operate within the PARP proteins, providing an additional level of regulation in the induction of the DNA damage response. As HPF1 forms a joint active site with PARP1 or PARP2, our data implicate HPF1 as an important determinant of the response to clinical PARP inhibitors.


Conflict of interest statement

Conflict of interest

The authors declare no conflicts of interest.

Figures

Extended Data Figure 1
Extended Data Figure 1. Structures of HPF1 from Nematostella vectensis and Homo sapiens.
Ribbon diagrams of HPF1 structures coloured according to domain organisation. All three structures are shown in corresponding orientations based on a structural alignment. For Nematostella vectensis HPF1, which crystallised with two molecules in the asymmetric unit, both molecules are shown.
Extended Data Figure 2
Extended Data Figure 2. Analytical size-exclusion chromatography analysis of HPF1-PARP1 interaction.
Uncropped SDS-PAGE gels with fractions from analytical size-exclusion chromatography. HPF1 was analysed in the presence or absence of PARP1 and either alone or with a short DNA duplex and/or the NAD+ analogue EB-47. Images from Fig. 1d are identical with areas marked with grey rectangles. Note the changed elution profile of PARP1 itself in the presence of DNA and EB-47, especially the shift in the peak centre on addition of DNA, possibly reflecting PARP1 oligomerisation.
Extended Data Figure 3
Extended Data Figure 3. Analytical size-exclusion chromatography of HPF1-PARP1 CAT interaction.
a, Uncropped gels with fractions from analytical size-exclusion chromatography shown in Fig. 1e. b, Analytical size-exclusion chromatography analysis of PARP1 CAT binding to HPF1. PARP1 CAT was used with its lipoyl tag (see Materials and Methods) uncleaved to allow it to be distinguished from HPF1, which has approximately the same molecular weight and elution profile as PARP1 CAT (data not shown). For uncropped gels, see the HPF1 gel in a and two gels in c. c, Uncropped gels for the analysis shown in b. Contaminants of HPF1 are marked with *
Extended Data Figure 4
Extended Data Figure 4. Structure of the HPF1-PARP2 CAT ΔHD complex.
a, Ribbon diagrams and surface representations of the HPF1-PARP2 CAT ΔHD complex. The bound NAD+ analogue, EB-47, is shown as sticks. b, Structural diagrams of the HPF1-PARP2 active site with the catalytic residues Glu284 (HPF1) and Glu545 (PARP2, equivalent to Glu988 in PARP1) and bound/modelled ligands shown as sticks and feature-enhanced modified σ-weighted electron density 2FoFc map (FEM) contoured at 1σ. Left, the original EB-47-bound structure. Right, the same view with NAD+ modelled in place of EB-47 by alignment with Protein Data Bank (PDB) ID 6BHV (electron density belongs to EB-47). Glu284 side-chain carboxylate group of HPF1 is located 4.5-6 Å away from the C1" of the modelled NAD+. A tentative location of a serine substrate between NAD+ and Glu284 is indicated.
Extended Data Figure 5
Extended Data Figure 5. Backbone amide signal intensity ratios for PARP1 CAT +/- HPF1.
Expansions of the histograms shown in Fig. 2d, showing backbone amide signal intensity ratios derived from 15N-1H-TROSY spectra of 15N-labelled PARP1656-1014 measured +/- HPF1 (top) and steady-state {1H}15N NOE values for free 15N-labelled PARP1656-1014 (bottom), plotted as a function of PARP1 amino-acid sequence for the HD subdomain (left) and the ART subdomain (i.e. the CAT domain without the HD) (right). Error estimates (in red) were calculated by taking the r. m. s. noise intensity in each spectrum as the measurement error, with the error in intensity ratios propagated according to the standard formula σA/B = (A/B)[(σA/A)2 + (σB/B)2]1/2.
Extended Data Figure 6
Extended Data Figure 6. Backbone amide NH signal assignments for PARP1 CAT.
a, [15N,1H] TROSY spectrum of 15N-labelled human PARP-1656-1014 recorded at 800 MHz and 25°C, showing backbone amide NH signal assignments. Protein concentration was 400 μM in 50 mM [2H11] Tris pH 7.0, 50 mM NaCl and 2 mM [2H10] DTT in 95:5 H2O/2H2O. b, Expansion of the most crowded region of the spectrum shown in a.
Extended Data Figure 7
Extended Data Figure 7. [15N,1H] TROSY spectra of PARP1 CAT +/- HPF1.
[15N,1H] TROSY spectra of human PARP1656-1014 in the absence (grey) or presence (blue) of human full-length HPF1 at a 1:1 ratio, recorded at 800 MHz and 25 °C. Protein concentrations were 150 μM, samples contained 50 mM [2H11] Tris pH 7.0, 50 mM NaCl and 2 mM [2H10] DTT in 95:5 H2O/2H2O. The spectra were acquired, processed and contoured identically.
Extended Data Figure 8
Extended Data Figure 8. Model of the HPF1-PARP1 CAT interaction
Additional views of the model of the HPF1-PARP1 CAT interaction shown in Fig. 2e. The complex is shown in the same orientations with PARP1 in surface (a) and ribbon (b) representation. Colouring of PARP1 CAT is according to the scale defined in Fig. 2e. HPF1 is coloured beige (“wheat”) and shown in semi-transparent ribbon representation.
Extended Data Figure 9
Extended Data Figure 9. Structure of the HPF1-PARP2 CAT ΔHD complex with modelled HD subdomain.
Ribbon diagrams of the HPF1-PARP2 CAT ΔHD complex with the PARP2 HD modelled in based on a structural alignment between the PARP2 CAT ΔHD fragment and a previous PARP2 CAT structure that includes the HD (PDB: 4zzx). Glu284 and EB-47 are shown in stick representation for orientation. The HD is shown in ribbon representation (a) and as a semi-transparent space-filling model (b). In b, examples of prominent side-chains that might clash with HPF1 if this HD positioning were maintained are labelled and shown in stick representation.
Fig 1
Fig 1. HPF1 structure and regulation of the HPF1-PARP1 interaction
a, Domain organisation and crystal structure of human HPF1 (for statistics, see Extended Data Table 1). Additional views and Nematostella vectensis HPF1 structure appear in Extended Data Fig. 1. b and c, Surface electrostatic potential and amino-acid residue conservation mapped onto HPF1 surface. d, SDS-PAGE analysis of analytical SEC fractions of HPF1 +/− indicated factors (for uncropped gels, see Extended Data Fig. 2). The centres of the PARP1 peaks +/− DNA are indicated. e, Analytical SEC of the HPF1-PARP1 CAT ΔHD interaction (for uncropped gels, see Extended Data Fig. 3a). f, PARP1 co-immunoprecipitation (IP) from 293T cells treated with olaparib and H2O2. Experiments in d-f were performed independently three times with similar results.
Fig 2
Fig 2. Crystal and solution structural analysis of the HPF1-PARP1/2 interaction
a, Structure of the human HPF1-PARP2 CAT ΔHD complex (for statistics, see Extended Table 1). Additional representations appear in Extended Data Fig. 4a. b, Active site of the HPF1-PARP2 complex. NAD+ was modelled by alignment with Protein Data Bank (PDB) ID 6BHV. An additional view with electron density appears in Extended Data Fig. 4b. c, PARP2 C-terminus bound to HPF1. d, Backbone amide signal intensity ratios from 15N-1H-TROSY spectra of 15N-labelled PARP1 CAT +/− HPF1 (top) and steady-state {1H}15N NOE values for free 15N-labelled PARP1 CAT (bottom). An intensity ratio of approx. 0.22 (horizontal red line) is interpreted as that resulting from slower overall molecular tumbling of the complex. Values < 0.22 indicate HPF1 binding, while values > 0.22 correspond to flexible regions (shown between dashed lines in the main plot). On the right, colour ramps used in e are defined. Expansions including error bars appear in Extended Data Fig. 5, and TROSY spectra used for assignments and binding analysis in Extended Data Fig. 6 and 7, respectively. e, Model of the HPF1-PARP1 CAT interaction obtained by superposing the ART subdomain of PARP1 from Protein Data Bank (PDB) ID 4DQY with that of PARP2 in the HPF1-PARP2 CAT ΔHD structure. The PARP1 surface is coloured by intensity ratio values as defined in d. Residues for which no unique intensity ratio could be measured (prolines and those whose amide signal is missing or overlapped for free PARP1 CAT) are in white. PARP1 C-terminus, which is absent in most structures, is shown schematically. Additional views appear in Extended Data Fig. 8.
Fig 3
Fig 3. DNA damage-induced ADP-ribosylation depends on functional HPF1
a, Radioactive ADP-ribosylation assay of PARP1 and PARP2 +/− HPF1 (WT or mutant). b, Active site of the HPF1-PARP2 complex with modelled-in acceptor ADP fragment, positioned by alignment with PDB:1A26. c, HPF1 complementation and co-immunoprecipitation (IP) in 293T cells +/− H2O2. The “Pan ADPr” reagent recognises both mono and poly(ADP-ribose). d, Structural alignment of the HPF1-PARP2 CAT ΔHD complex (top) and cholera toxin subunit A1 (PDB:1XTC; bottom). e, Surface electrostatics mapped onto the HPF1-PARP2 CAT ΔHD complex surface. The interface between HPF1 and PARP2 is indicated with a dashed line. Experiments in a and c were performed independently three times with similar results.
Fig 4
Fig 4. HPF1-interacting PARP1/2 residues and model of DNA damage-induced ADP-ribosylation
a, b, Radioactive ADP-ribosylation assay of PARP1 or PARP2 mutants +/− HPF1. c, PARP1 co-immunoprecipitation (IP) from 293T cells treated with olaparib and H2O2. d, Fragments of a multiple-sequence alignment of human (h) and mouse (m) PARP1, PARP2, and PARP3. Invariant (dark grey) and highly conserved (light grey) residues across at least four of the analysed proteins are highlighted. His826/381 (human PARP1/2 numbering) and the extreme C-terminal Leu-Trp motif are shown in bold. e, Proposed model of HPF1-PARP1/2-dependent ADP-ribosylation upon DNA damage. The inhibition of HPF1 and NAD+ binding to PARP1/2 is relieved upon PARP1/2 binding to DNA breaks, leading to the formation of a composite HPF1-PARP active site capable of recruiting and modifying KS (shown) or other serine-based substrate motifs. Experiments in a-c were performed independently three times with similar results.

Comment in

References

    1. Gupte R, Liu Z, Kraus WL. PARPs and ADP-ribosylation: recent advances linking molecular functions to biological outcomes. Genes & development. 2017;31:101–126. doi: 10.1101/gad.291518.116. - DOI - PMC - PubMed
    1. Pascal JM. The comings and goings of PARP-1 in response to DNA damage. DNA repair. 2018;71:177–182. doi: 10.1016/j.dnarep.2018.08.022. - DOI - PMC - PubMed
    1. Martin-Hernandez K, Rodriguez-Vargas JM, Schreiber V, Dantzer F. Expanding functions of ADP-ribosylation in the maintenance of genome integrity. Seminars in cell & developmental biology. 2017;63:92–101. doi: 10.1016/j.semcdb.2016.09.009. - DOI - PubMed
    1. Liu C, Vyas A, Kassab MA, Singh AK, Yu X. The role of poly ADP-ribosylation in the first wave of DNA damage response. Nucleic acids research. 2017;45:8129–8141. doi: 10.1093/nar/gkx565. - DOI - PMC - PubMed
    1. Gibbs-Seymour I, Fontana P, Rack JGM, Ahel I. HPF1/C4orf27 Is a PARP-1-Interacting Protein that Regulates PARP-1 ADP-Ribosylation Activity. Molecular cell. 2016;62:432–442. doi: 10.1016/j.molcel.2016.03.008. - DOI - PMC - PubMed

MeSH terms