. 2020 Mar 2;219(3):e201905144.
doi: 10.1083/jcb.201905144.

Aurora B kinase is recruited to multiple discrete kinetochore and centromere regions in human cells

Affiliations

Aurora B kinase is recruited to multiple discrete kinetochore and centromere regions in human cells

Amanda J Broad et al. J Cell Biol. .

Abstract

Aurora B kinase has a critical role in regulating attachments between kinetochores and spindle microtubules during mitosis. Early in mitosis, kinase activity at kinetochores is high to promote attachment turnover, and in later mitosis, activity decreases to ensure attachment stabilization. Aurora B localizes prominently to inner centromeres, and a population of the kinase is also detected at kinetochores. How Aurora B is recruited to and evicted from these regions to regulate kinetochore-microtubule attachments remains unclear. Here, we identified and investigated discrete populations of Aurora B at the centromere/kinetochore region. An inner centromere pool is recruited by Haspin phosphorylation of histone H3, and a kinetochore-proximal outer centromere pool is recruited by Bub1 phosphorylation of histone H2A. Finally, a third pool resides ~20 nm outside of the inner kinetochore protein CENP-C in early mitosis and does not require either the Bub1/pH2A/Sgo1 or Haspin/pH3 pathway for localization or activity. Our results suggest that distinct molecular pathways are responsible for Aurora B recruitment to centromeres and kinetochores.


Figures

Figure 1.
Figure 1.
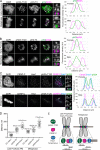
pH3-T3 and pH2A-T120 occupy discrete locations within the centromere region in mitosis. (A and B) Immunofluorescence images of early prometaphase and metaphase HeLa (A) and U2OS (B) cells stained with antibodies to phosphorylated histone H3-T3 (pH3) and phosphorylated histone H2A-T120 (pH2A). Arrows point to the kinetochore pairs shown in the insets. Linescans through the centromere/kinetochore region are shown to the right of each panel. (C) Immunofluorescence images of late prophase and metaphase HeLa cells stained with antibodies to CENP-C, the N terminus of Hec1 (antibody 9G3), and pH2A-T120. Arrows point to the kinetochore pairs shown in the insets. Linescans through the centromere/kinetochore region are shown to the right of each panel. (D) Plots of the mean distance between the indicated centromere or kinetochore proteins. Each point on the graph represents a distance measurement from a pair of sister chromatids. n values are listed in Table 1. Measurements on the left were obtained from late prophase or early prometaphase (PM) HeLa cells; measurements on the right were obtained from metaphase cells. Distance is in nanometers. Error bars represent SD. (E) Summary of distance measurements from experiments in C and D. Scale bars, 10 µm (whole cells) and 1 µm (insets). Whole cell images shown are maximum intensity projections of z-stacks containing 64 planes, and inset images shown are projections from 2 to 4 planes. AU, arbitrary units.
Figure 2.
Figure 2.
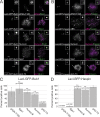
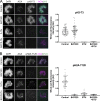
pH3-T3 and pH2A-T120 are each capable of recruiting Aurora B kinase and the CPC. (A and B) Immunofluorescence images of U2OS cells expressing LacI-GFP-Bub1 (A) or LacI-BFP-Haspin (B). Cells were immunostained for the indicated centromere/kinetochore proteins or phospho-specific epitopes. Arrows point to the LacO array with indicated LacI-fused protein shown in the insets. Cells were synchronized in G2 using RO-3306 and washed out of drug 30 min before fixation to enrich for early mitotic cells. (C and D) Quantification of experiments in A and B. The average fluorescence intensity of each antibody was measured at the LacO array in cells expressing either LacI-BFP or LacI-GFP (not fused to a test protein), and average values were measured and used to calculate thresholds. Fluorescence intensities of each antibody were then measured in cells expressing LacI-BFP-Haspin or LacI-GFP-Bub1, and cells were scored as positive if intensity values were higher than the calculated thresholds. For each experiment, ≥20 cells were quantified from n ≥ 3 experiments. Error bars represent SD. Significance values were calculated from a one-way ordinary ANOVA test. Shown are significance values between experiments for each test antibody and either pH2A-T120 (C) or pH3-T3 (D). Scale bars, 10 µm (whole cells) and 1 µm (insets). n.s., not significant.
Figure S1.
Figure S1.
Sgo1 recruits the CPC to an ectopic chromosome locus in human cells. (A) Immunofluorescence images of U2OS cells expressing LacI-GFP-Sgo1. Cells were immunostained for the indicated proteins or phospho-histone epitopes and analyzed for positive recruitment based on a threshold intensity determined from U2OS cells expressing LacI-GFP. (B) Quantification of the recruitment of indicated proteins or phospho-epitopes in LacI-GFP-Sgo1–expressing cells. (C) Quantification of pH2A-T120 recruitment in Bub1 or Sgo1-LacI–expressing cells. For all conditions, cells were synchronized in G2 using RO-3306 and washed out of drug 30 min before fixation to enrich for mitotic cells. (D) Immunofluorescence images of U2OS cells expressing LacI-GFP-Bub1. Top row: control; bottom row: Sgo1 siRNA. (E) Quantification of percent Sgo1-positive cells (left) and percent Aurora B–positive cells (right) in control and Sgo1 siRNA-treated cells. For each condition shown, ≥20 cells were quantified from at least two independent experiments. Error bars represent SD. For B, significance values were calculated using a one-way ordinary ANOVA test. Shown are significance values between experiments for each test antibody and pH2A-T120. For C, the significance value was calculated using an unpaired nonparametric Student’s t test. Scale bars, 10 µm.
Figure 3.
Figure 3.
The Bub1/pH2A-T120/Sgo1 pathway contributes to the accumulation of centromere-associated Aurora B but not localization or activity of kinetochore-associated Aurora B. (A, C, E, and G) Immunofluorescence images of HeLa cells depleted of Sgo1 and stained for either Aurora B (ABK), active phosphorylated ABK (pABK-T232), phosphorylated Hec1-S44 (pHec1-S44), or Sgo1. (B, D, F, and H) Quantification of centromere or kinetochore fluorescence intensities of Aurora B, pABK-T232, pHec1-S44, and Sgo1. For all conditions, at least 120 kinetochores from 10 cells were measured from a total of three independent experiments. Fluorescence intensities for Sgo1 depletion were normalized to those calculated from control cells. (I, K, and M) HeLa Flp-In TREx cells were induced to express GFP-Sgo1-WT, GFP-Sgo1-K492A, or GFP-Sgo1-T346A fusion proteins (Liu et al., 2013) and immunostained for ABK, pABK-T232, or pHec1-S44. (J, L, and N) Quantification of centromere (ABK) or kinetochore (pABK-T232, pHec1-S44) normalized fluorescence intensities. For ABK quantification, 120 centromeres were measured from 15 cells from three independent experiments. For pABK-T232 and pHec1-S44, at least 200 kinetochores were measured from at least 15 cells from three independent experiments. Fluorescence intensities for test conditions were normalized to those calculated from control cells. Error bars represent SD. For B, D, F, and H, significance values were calculated from unpaired nonparametric Student's t tests. For J, L, and N, significance values were calculated from a one-way ordinary ANOVA test, and shown are significance values between experiments using cells overexpressing WT or mutant Sgo1 constructs compared with control, untreated cells. AU, arbitrary units; ACA, anti-centromere antibody. Scale bars, 10 µm.
Figure S2.
Figure S2.
Depletion of Bub1 protein results in reduction of both centromere and kinetochore-associated Aurora B in human cells. (A, D, G, and I) Immunofluorescence images of HeLa cells depleted of Bub1 and immunostained for the indicated antibodies. (B, C, E, F, H, and J) Quantification of kinetochore or centromere fluorescence intensities of indicated antibodies. Error bars indicate SD. For all conditions, at least 120 kinetochores from 10 cells were measured from a total of three independent experiments. Error bars represent SD. Significance values were calculated using unpaired nonparametric Student's t tests. Scale bars, 10 µm. AU, arbitrary units.
Figure 4.
Figure 4.
Bub1 kinase activity is not required for localization or activity of Aurora B at kinetochores. (AF) Immunofluorescence images of control HeLa cells or HeLa cells treated with either 10 μM Bub1 kinase inhibitor BAY320 or 20 μM Aurora B kinase inhibitor ZM447439. Cells were fixed and stained with the indicated antibodies. To the right of each immunofluorescence panel is the quantification of centromere or kinetochore fluorescence intensity. Fluorescence intensities for test conditions were normalized to those calculated from control cells. n values for each experiment follow. ABK: Control (n = 153 centromeres; 15 cells; three experiments); BAY320 (n = 226 centromeres; 13 cells; four experiments); ZM447439 (n = 222 centromeres; 11 cells; three experiments). pINCENP: Control (n = 349 centromeres; 15 cells; three experiments); BAY320 (n = 245 centromeres; 10 cells; three experiments); ZM447439 (n = 179 centromeres; 10 cells; three experiments). pABK-T232: Control (n = 621 kinetochores; 42 cells; four experiments); BAY320 (n = 350 kinetochores; 24 cells; four experiments); ZM447439 (n = 219 kinetochores; 6 cells; three experiments). pHec1-S44: Control (n = 384 kinetochores; 16 cells; three experiments); BAY320 (n = 272 kinetochores; 15 cells; three experiments); ZM447439 (n = 224 kinetochores; 11 cells; three experiments). pKnl1-S24: Control (n = 363 kinetochores; 16 cells; three experiments); BAY320 (n = 348 kinetochores; 17 cells; three experiments); ZM447439 (n = 281 kinetochores; 14 cells; three experiments). pDsn1-S109: Control (n = 400 kinetochores; 18 cells; three experiments); BAY320 (n = 368 kinetochores; 17 cells; three experiments); ZM447439 (n = 209 kinetochores; 10 cells; two experiments). (G) Quantification of time (in min) to anaphase onset after washout of monastrol. HeLa cells were treated with 150 μM monastrol for 2 h. Cells were washed out into control media, or media containing either 10 μM BAY320 or 20 μM ZM447439. The time from initiation of washout to anaphase onset was scored. For each condition, at least 200 cells were quantified from three experiments. (H) Quantification of chromosome segregation errors in cells treated with 150 μM monastrol for 2 h, and washed out into control media, or media containing either 10 μM BAY320 or 20 μM ZM447439. Errors in chromosome segregation were quantified from anaphase cells. For A-F, significance values were calculated from unpaired nonparametric Student’s t tests. For G and H, significance values were calculated from one-way ordinary ANOVA tests. AU, arbitrary units; Cont, control; BAY, BAY320; ZM, ZM447439. Scale bars, 10 µm.
Figure S3.
Figure S3.
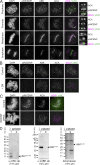
Characterization of pINCENP-S893,894 antibody. (A) Immunofluorescence images of HeLa cells in various stages of mitosis stained with pINCENP-S893, S894, Aurora B, and ACA. Arrows point to the kinetochore pairs shown in the insets on the right. (B) Immunofluorescence images of a control HeLa cell and a HeLa cell treated with 10 μM ZM447439. (C) Immunofluorescence images of a control cell and HeLa cell treated with INCENP siRNA. (D) A complex of Aurora B (amino acids 60–361) and INCENP (amino acids 1–68 and 834–900) was incubated with or without lambda protein phosphatase (pptase), and reactions were terminated with the addition of SDS-PAGE sample buffer. Images show Western blots of reactions probed with pINCENP-S893, S894 (left) and pABK-T232 (middle) antibodies (ab). A Coomassie-stained gel is shown to the right. Molecular weight (MW) markers are indicated. Scale bars, 10 µm (whole cells) and 1 µm (insets). Whole cell images shown are maximum intensity projections of z-stacks containing 64 planes, and inset images shown are projections from 2 to 4 planes.
Figure S4.
Figure S4.
Specificity of Bub1 and Haspin kinase inhibitors. (A) Immunofluorescence images of control HeLa cells and cells treated with 10 μM BAY320, 10 μM 5-ITu, or both kinase inhibitors for 30 min and then immunostained for pH3-T3. Quantification of whole cell fluorescence intensity for each condition is shown to the right. Fluorescence intensities for test conditions were normalized to those calculated from control cells. For all conditions, at least 16 cells from three independent experiments were measured. Error bars indicate SD. (B) Immunofluorescence images of control HeLa cells and cells treated with 10 μM BAY320, 10 μM 5-ITu, or both kinase inhibitors for 30 min and then immunostained for pH2A-T120. Quantification of whole cell fluorescence intensity for each condition is shown to the right. Fluorescence intensities for test conditions were normalized to those calculated from control cells. For all conditions, at least 14 cells from three independent experiments were measured. Error bars indicate SD. Significance values were calculated using a one-way ordinary ANOVA test. Shown are significance values between each experiment and control cells. Scale bars, 10 µm. AU, arbitrary units.
Figure S5.
Figure S5.
5-ITu treatment prevents accumulation and activity of Aurora B at centromeres, but not kinetochores. (AF) Immunofluorescence images of control HeLa cells or HeLa cells treated with either 10 μM 5-ITu or 10 μM 5-ITu plus 10 μM BAY320 for 30 min. Cells were fixed and stained with the indicated antibodies. To the right of each immunofluorescence panel is the quantification of fluorescence intensities. Fluorescence intensities for test conditions were normalized to those calculated from control cells. n values for each experiment follow. ABK: Control (n = 153 centromeres; 15 cells; four experiments); 5-ITu (n = 161 centromeres; 14 cells; three experiments); 5-ITu + BAY320 (n = 115 centromeres; 11 cells; three experiments). pINCENP: Control (n = 349 centromeres; 15 cells; three experiments); 5-ITu (n = 210 centromeres; 10 cells; three experiments); 5-ITu + BAY320 (n = 195 centromeres; 10 cells; three experiments). pABK-T232: Control (n = 621 kinetochores; 42 cells; four experiments); 5-ITu (n = 359 kinetochores; 38 cells; four experiments); 5-ITu + BAY320 (n = 279 kinetochores; 40 cells; four experiments). pHec1-S44: Control (n = 384 kinetochores; 16 cells; three experiments); 5-ITu (n = 374 kinetochores; 16 cells; three experiments); 5-ITu + BAY320 (n = 336 kinetochores; 16 cells; three experiments). pKnl1-S24: Control (n = 363 kinetochores; 16 cells; three experiments); 5-ITu (n = 337 kinetochores; 16 cells; three experiments); 5-ITu + BAY320 (n = 309 kinetochores; 18 cells; three experiments). pDsn1-S109: Control (n = 400 kinetochores; 18 cells; three experiments); 5-ITu (n = 295 kinetochores; 16 cells; three experiments); 5-ITu + BAY320 (n = 315 kinetochores; 16 cells; three experiments). Error bars represent SD. Significance values were calculated using a one-way ordinary ANOVA test. Shown are significance values between experiments for each test condition compared with control cells. Scale bars, 10 µm. AU, arbitrary units.
Figure 5.
Figure 5.
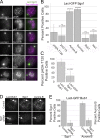
Inhibition of Haspin kinase results in relocalization of Aurora B from inner centromeres to kinetochore-proximal outer centromeres. (A) Immunofluorescence images of control and 5 μM 5-ITu-treated early prometaphase HeLa cells expressing Aurora B kinase-GFP (ABK-GFP) and stained with antibodies to CENP-C. Arrows point to the kinetochore pairs shown in the insets. Linescans through the centromere/kinetochore region are shown to the right of each panel. (B) Immunofluorescence images of control and 5 μM 5-ITu-treated early prometaphase HeLa cells expressing ABK-GFP and stained with antibodies to pABK-T232. Arrows point to the kinetochore pairs shown in the insets. Linescans through the centromere/kinetochore region are shown to the right of each panel. Scale bars, 10 µm (whole cells) and 1 µm (insets). Whole cell images shown are maximum intensity projections of z-stacks containing 64 planes, and inset images shown are projections from 2 to 4 planes. AU, arbitrary units.
Figure 6.
Figure 6.
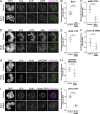
Aurora B kinase and INCENP localize to both centromeres and kinetochores in mitotic cells. (A) Immunofluorescence images of an early prometaphase control HeLa cell stained with antibodies to pABK-T232, CENP-C, and the N-terminus of Hec1 (antibody 9G3). Arrows point to the kinetochore pairs shown in the insets. A linescan through the centromere/kinetochore region is shown to the right of the panel. (B) Immunofluorescence images of an early prometaphase control HeLa cell stained with antibodies to pINCENP, CENP-C, and the N terminus of Hec1 (antibody 9G3). Numbers indicate kinetochore pairs shown in the insets, and linescans through the centromere/kinetochore region are shown to the right of each panel. pINCENP is localized to the kinetochore (pair 1), the centromere and kinetochore (pair 2), or the kinetochore-proximal outer centromere (pair 3). (C) Plots of the mean distance between the indicated proteins. Each point on the graph represents a distance measurement for a pair of sister chromatids, and the mean value is indicated. Error bars indicate SD. n values are listed in Table 1. (D) Summary of distance measurements from experiments in the study. Scale bars, 10 µm (whole cells) and 1 µm (insets). Whole cell images shown are maximum intensity projections of z-stacks containing 64 planes, and inset images shown are projections from 2 to 4 planes. Fl. intensity is fluorescence intensity; AU, arbitrary units.

References

    1. Akiyoshi B., Nelson C.R., and Biggins S.. 2013. The aurora B kinase promotes inner and outer kinetochore interactions in budding yeast. Genetics. 194:785–789. 10.1534/genetics.113.150839 - DOI - PMC - PubMed
    1. Andrews P.D., Ovechkina Y., Morrice N., Wagenbach M., Duncan K., Wordeman L., and Swedlow J.R.. 2004. Aurora B regulates MCAK at the mitotic centromere. Dev. Cell. 6:253–268. 10.1016/S1534-5807(04)00025-5 - DOI - PubMed
    1. Bakhoum S.F., Thompson S.L., Manning A.L., and Compton D.A.. 2009. Genome stability is ensured by temporal control of kinetochore-microtubule dynamics. Nat. Cell Biol. 11:27–35. 10.1038/ncb1809 - DOI - PMC - PubMed
    1. Baron A.P., von Schubert C., Cubizolles F., Siemeister G., Hitchcock M., Mengel A., Schröder J., Fernández-Montalván A., von Nussbaum F., Mumberg D., and Nigg E.A.. 2016. Probing the catalytic functions of Bub1 kinase using the small molecule inhibitors BAY-320 and BAY-524. eLife. 5:e12187 10.7554/eLife.12187 - DOI - PMC - PubMed
    1. Bekier M.E., Mazur T., Rashid M.S., and Taylor W.R.. 2015. Borealin dimerization mediates optimal CPC checkpoint function by enhancing localization to centromeres and kinetochores. Nat. Commun. 6:6775 10.1038/ncomms7775 - DOI - PMC - PubMed

Publication types

MeSH terms