. 2020 Feb 6;13(1):49.
doi: 10.1186/s13071-020-3919-4.

Arginase promotes immune evasion of Echinococcus granulosus in mice

Affiliations

Arginase promotes immune evasion of Echinococcus granulosus in mice

Shengkui Cao et al. Parasit Vectors. .

Abstract

Background: Cystic echinococcosis is a chronic disease caused by infection with the larvae of Echinococcus granulosus. The parasite's ability to establish persistent infection is partly due to its evolving immune evasion strategies. One strategy may involve the protective effect of arginase, which impedes the control of pathogens or tumors, whereas it remains largely unknown during E. granulosus infection. Here, we analyzed whether arginase was produced in peritoneal cells and assessed its role in immunosuppression in mice infected with protoscoleces of E. granulosus.

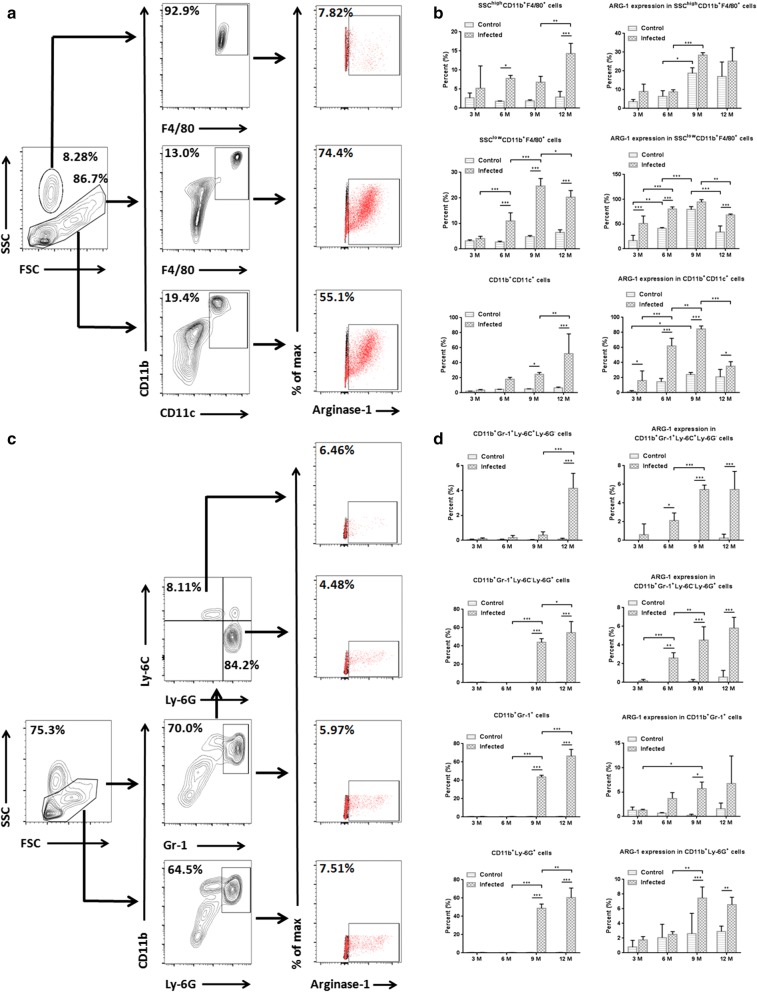
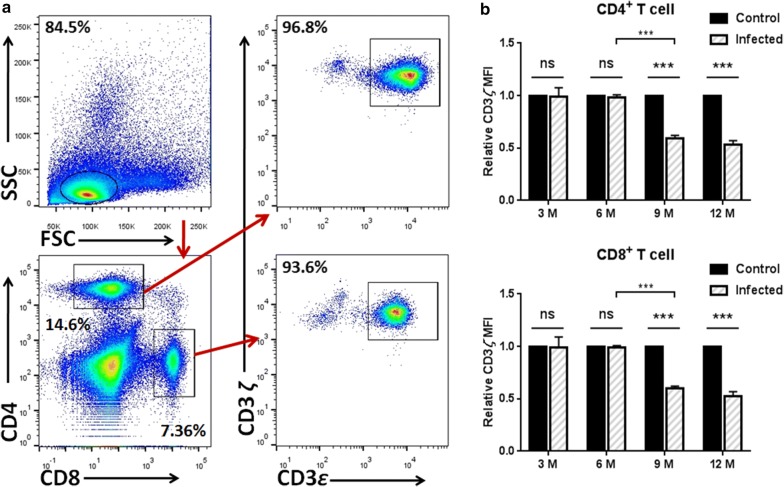
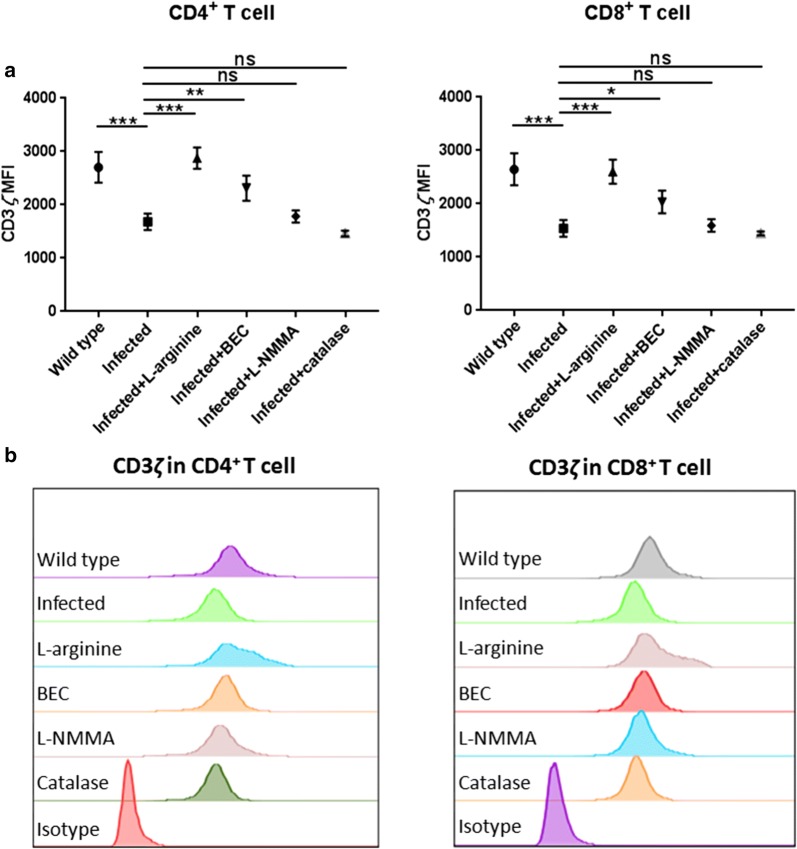
Methods: BALB/c mice injected with protoscoleces of E. granulosus were used to evaluate the expression of arginase (ARG) in mRNA and protein levels. The profiles of ARG-1 expression in peritoneal cells and CD3ζ expression in T cells from spleens were assessed at different time points (3, 6, 9 and 12 months post-infection) by flow cytometry. In vitro, peritoneal cells were co-cultured with purified T cells in a transwell system, and the levels of CD3ζ re-expression were compared by flow cytometry. Meanwhile, the changes of L-arginine and its related metabolites in serum were tested.

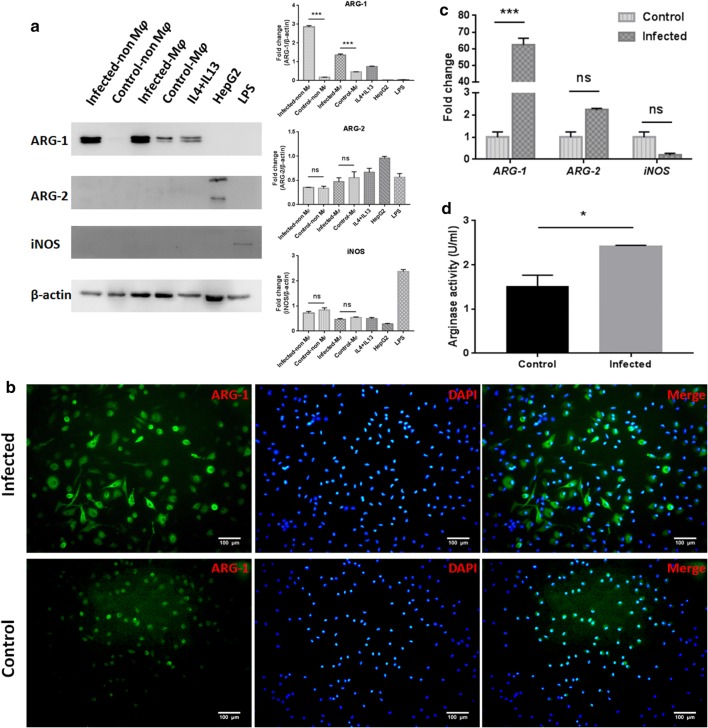
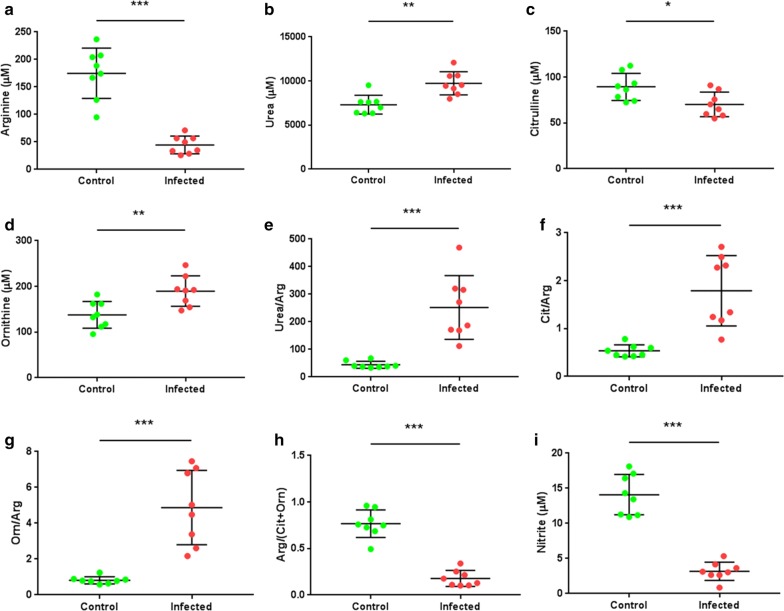
Results: Compared to the control group, the peritoneal cells from infected mice showed higher levels of ARG-1 mRNA and protein, unchanged ARG-2 and iNOS. Enhanced ARG-1 expression was present in SSClowCD11b+F4/80+, CD11b+CD11c+, CD11b+Gr-1+Ly-6C+Ly-6G-, CD11b+Gr-1+Ly-6C-Ly-6G+, CD11b+Gr-1+ and CD11b+Ly-6G+ cells. The proportion of cells and the proportion of ARG-1 expression in corresponding cells exhibited a rising trend along with the extension of infection time, except for fluctuations in SSClowCD11b+F4/80+ and CD11b+CD11c+ cells at 12 months post-infection, whereas the expression of CD3ζ chain in CD4+ and CD8+ T cells showed a descending trend. Purified T cells showed declined re-expression of CD3ζ when co-cultured with peritoneal cells from infected mice, and CD3ζ was regenerated by supplement of L-arginine or arginase inhibitor BEC, rather than NOS inhibitor L-NMMA or catalase. Meanwhile, the concentrations of L-arginine, L-citrulline and NO decreased, and those of L-ornithine and urea increased in serum post-infection.

Conclusions: Our findings demonstrated that ARG-1 expression is enhanced in multiple myeloid cells from peritoneum and promotes immune evasion of E. granulosus in mice by inhibiting the expression of T cell receptor CD3ζ chain and antagonism against iNOS.

Keywords: Arginase; Echinococcus granulosus; INOS; Immunosuppression; Peritoneum.


Conflict of interest statement

The authors declare that they have no competing interests.

Figures

Fig. 1
Fig. 1
Presence and activity of arginase in peritoneal cells (9 months post-infection). a Immunoblot of ARG-1, ARG-2 and iNOS from the lysates of macrophages and non-macrophage cells from infected and control mice (macrophages were magnetically separated from peritoneal cells and the remaining cells were labeled non-macrophage cells). The IL4 and IL13 stimulated peritoneal cells, HepG2 cells and LPS stimulated peritoneal cells served as positive controls. Graphical representations of band intensities are shown in the right panel. Protein expression was normalized to β-actin. Differences were analyzed by a one-way ANOVA. b Immunofluorescent assay of ARG-1 in whole peritoneal cells. DAPI was used to visualize nuclei. Scale-bars: 100 µm. c The levels of ARG-1, ARG-2 and iNOS mRNA expression in peritoneal cells were analyzed by RT-qPCR. Relative mRNA expression was normalized to GAPDH. The difference was analyzed by a two-way ANOVA. d 2 × 106 cell lysates in 200 µl arginase assay buffer were used to determine arginase activity. The unit of arginase activity is denoted as U/ml (one unit means the amount of enzyme that will generate 1.0 µmol of H2O2 per min at 37 °C). The difference was analyzed by a Student’s t-test. The data are the result of a representative experiment out of three independent experiments. *P < 0.05, **P < 0.01, ***P < 0.001. Abbreviations: ns, not significant
Fig. 2
Fig. 2
ARG-1 is produced in multiple peritoneal myeloid cells at different time points post-infection. a Representative flow cytometry analysis of ARG-1 expression in SSChighCD11b+F4/80+, SSClowCD11b+F4/80+ and CD11b+CD11c+ cells from one infected mouse at 6 months post-infection. b The percentages of SSChighCD11b+F4/80+ cells in total peritoneal leukocytes, SSClowCD11b+F4/80+ and CD11b+CD11c+ cells in SSC-low leukocytes, together with the percentages of ARG-1 expression in corresponding cells were determined by flow cytometry at 3, 6, 9 and 12 months post-infection. The differences were analyzed by a two-way ANOVA. c Representative flow cytometry analysis of ARG-1 expression in CD11b+Gr-1+Ly-6C+Ly-6G, CD11b+Gr-1+Ly-6CLy-6G+, CD11b+Gr-1+ and CD11b+Ly-6G+ cells from one infected mouse at 12 months post-infection. d The percentages of CD11b+Gr-1+Ly-6C+Ly-6G−n, CD11b+Gr-1+Ly-6CLy-6G+, CD11b+Gr-1+ and CD11b+Ly-6G+ cells in SSC-low leukocytes, and the percentages of ARG-1 expression in the corresponding cells were determined by flow cytometry at 3, 6, 9 and 12 months post-infection. The differences were analyzed by a two-way ANOVA. The percentages of ARG-1 expression (red) were confirmed on the basis of isotypic controls (black) in a and c. The data are the result of one representative experiment out of three independent experiments. *P < 0.05, **P < 0.01, ***P < 0.001
Fig. 3
Fig. 3
Dynamic studies of CD3ζ expression in CD4+ and CD8+ T cells in vivo. a Representative flow cytometry analysis of CD3ζ expression in CD4+ (CD3ε+CD4+) and CD8+ (CD3ε+CD8+) T cells among spleen leukocytes from one infected mouse at 6 months post-infection. b The relative MFI of CD3ζ expression in CD4+ and CD8+ T cells was quantified by flow cytometry at different time points post-infection (3, 6, 9 and 12 months). The differences were analyzed by a two-way ANOVA. The data are the result of one representative experiment out of three independent experiments. *P < 0.05, **P < 0.01, ***P < 0.001. Abbreviations: ns, not significant
Fig. 4
Fig. 4
Arginase produced by peritoneal cells from infected mice prevents the re-expression of the CD3ζ chain. Isolated murine pan T cells were stimulated with 3 μg/ml anti-CD3ε plus 500 ng/ml anti-CD28 antibodies in l-arginine-free RPMI 1640 for 24 h, and peritoneal cells from infected/control mice were cultured in RPMI 1640 containing 300 μM l-arginine separately for 24 h. Stimulated T cells were then added to the upper chamber of a co-culture transwell system containing the peritoneal cells in the bottom chamber for an additional 48 h of culture. In some experiments, the l-arginine (2 mM), BEC (90 μM), l-NMMA (500 μM) and catalase (200 U/ml) were respectively added into the cultures at 0 h. a CD3ζ re-expression in CD4+ and CD8+ T cells was tested by flow cytometry. The differences were analyzed by a one-way ANOVA. b Representative histograms of CD3ζ re-expression in activated CD4+ and CD8+ T cells co-cultured with peritoneal cells for 48 h. The data are the result of one representative experiment out of three independent experiments. *P < 0.05, **P < 0.01, ***P < 0.001. Abbreviations: ns, not significant
Fig. 5
Fig. 5
Concentrations of arginine-related metabolites in serum from mice (9 months post-infection). The concentration of arginine (a), urea (b), citrulline (c) and ornithine (d) was quantified by an ion-exchange AA analyzer. e The concentration ratio between urea and arginine (Arg). f The ratio between citrulline (Cit) and arginine. g The ratio between ornithine (Orn) and arginine. h The ratio of arginine/(citrulline + ornithine). i The total concentration of nitrite, used as a quantitative measure of NO production. The differences were analyzed by a Student’s t-test. *P < 0.05, **P < 0.01, ***P < 0.001

References

    1. Wu GY, Morris SM. Arginine metabolism: nitric oxide and beyond. Biochem J. 1998;336:1–17. doi: 10.1042/bj3360001. - DOI - PMC - PubMed
    1. Bronte V, Zanovello P. Regulation of immune responses by l-arginine metabolism. Nat Rev Immunol. 2005;5:641–654. doi: 10.1038/nri1668. - DOI - PubMed
    1. Taheri F, Ochoa JB, Faghiri Z, Culotta K, Park HJ, Lan MS, et al. l-Arginine regulates the expression of the T-cell receptor zeta chain (CD3zeta) in Jurkat cells. Clin Cancer Res. 2001;7(Suppl. 3):958–965. - PubMed
    1. Zea AH, Rodriguez PC, Culotta KS, Hernandez CP, DeSalvo J, Ochoa JB, et al. l-Arginine modulates CD3ζ expression and T cell function in activated human T lymphocytes. Cell Immunol. 2004;232:21–31. doi: 10.1016/j.cellimm.2005.01.004. - DOI - PubMed
    1. Vincendeau P, Gobert AP, Daulouede S, Moynet D, Mossalayi MD. Arginases in parasitic diseases. Trends Parasitol. 2003;19:9–12. doi: 10.1016/S1471-4922(02)00010-7. - DOI - PubMed