. 2020 Feb:32:122-135.
doi: 10.1016/j.molmet.2019.11.019. Epub 2019 Dec 13.

Itaconate modulates tricarboxylic acid and redox metabolism to mitigate reperfusion injury

Affiliations

Itaconate modulates tricarboxylic acid and redox metabolism to mitigate reperfusion injury

Thekla Cordes et al. Mol Metab. 2020 Feb.

Abstract

Objectives: Cerebral ischemia/reperfusion (IR) drives oxidative stress and injurious metabolic processes that lead to redox imbalance, inflammation, and tissue damage. However, the key mediators of reperfusion injury remain unclear, and therefore, there is considerable interest in therapeutically targeting metabolism and the cellular response to oxidative stress.

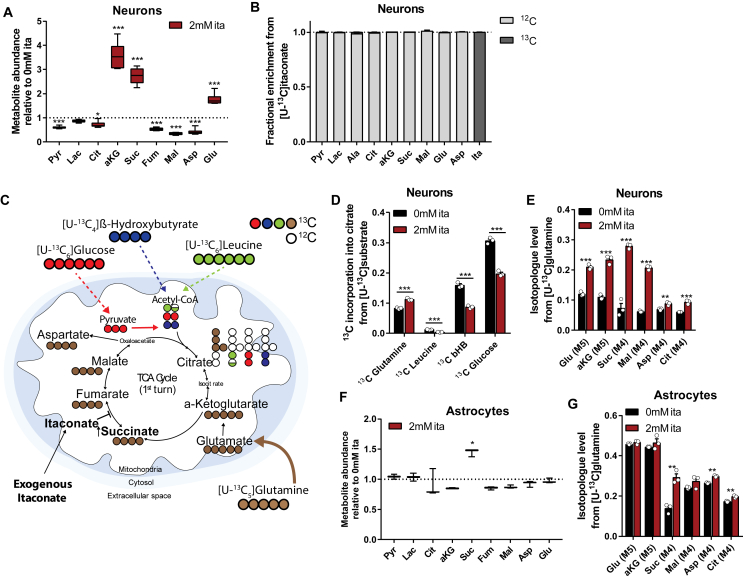
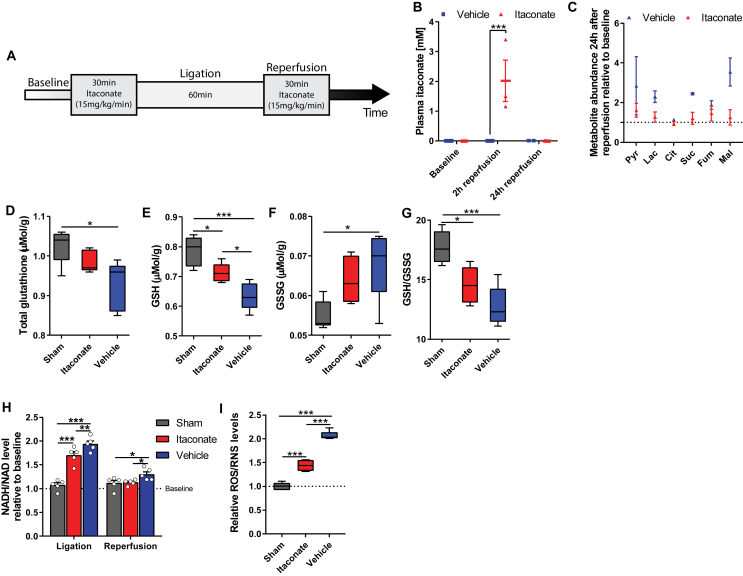
Methods: The objective of this study was to investigate the molecular, metabolic, and physiological impact of itaconate treatment to mitigate reperfusion injuries in in vitro and in vivo model systems. We conducted metabolic flux and bioenergetic studies in response to exogenous itaconate treatment in cultures of primary rat cortical neurons and astrocytes. In addition, we administered itaconate to mouse models of cerebral reperfusion injury with ischemia or traumatic brain injury followed by hemorrhagic shock resuscitation. We quantitatively characterized the metabolite levels, neurological behavior, markers of redox stress, leukocyte adhesion, arterial blood flow, and arteriolar diameter in the brains of the treated/untreated mice.

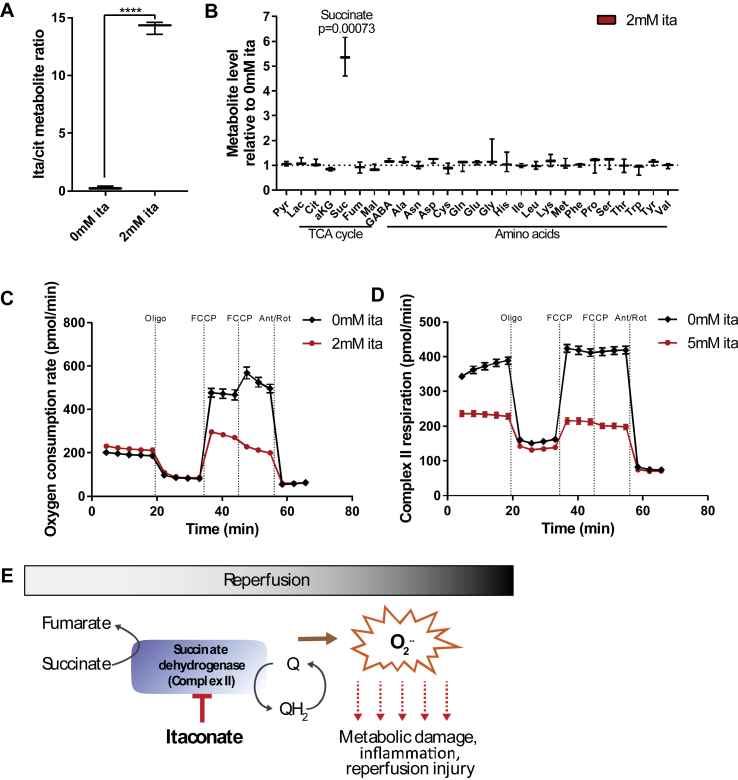
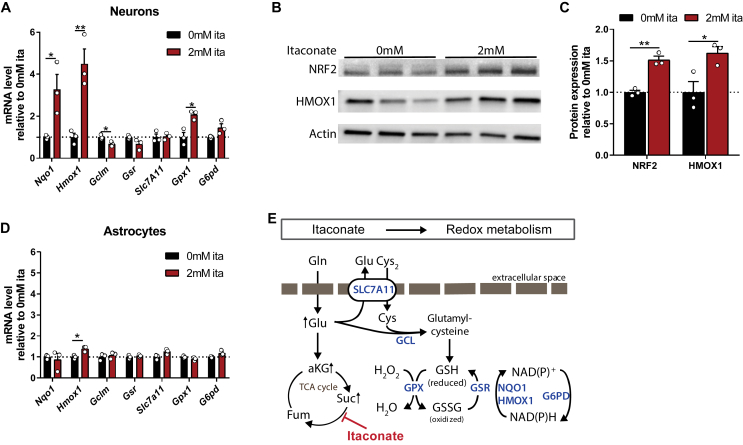
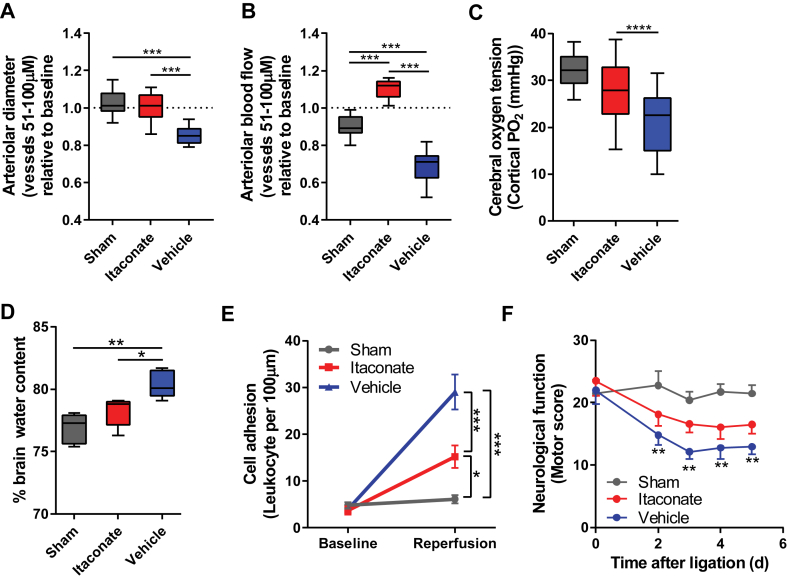
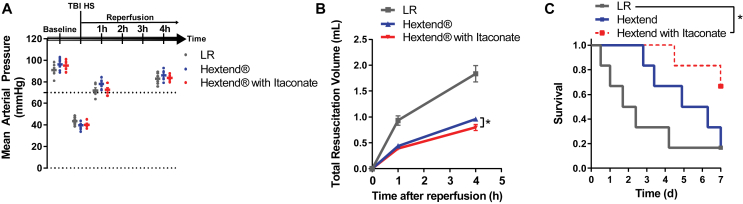
Results: We demonstrate that the "immunometabolite" itaconate slowed tricarboxylic acid (TCA) cycle metabolism and buffered redox imbalance via succinate dehydrogenase (SDH) inhibition and induction of anti-oxidative stress response in primary cultures of astrocytes and neurons. The addition of itaconate to reperfusion fluids after mouse cerebral IR injury increased glutathione levels and reduced reactive oxygen/nitrogen species (ROS/RNS) to improve neurological function. Plasma organic acids increased post-reperfusion injury, while administration of itaconate normalized these metabolites. In mouse cranial window models, itaconate significantly improved hemodynamics while reducing leukocyte adhesion. Further, itaconate supplementation increased survival in mice experiencing traumatic brain injury (TBI) and hemorrhagic shock.

Conclusions: We hypothesize that itaconate transiently inhibits SDH to gradually "awaken" mitochondrial function upon reperfusion that minimizes ROS and tissue damage. Collectively, our data indicate that itaconate acts as a mitochondrial regulator that controls redox metabolism to improve physiological outcomes associated with IR injury.

Keywords: Brain injury; Cerebral ischemia/reperfusion (IR); Itaconate; Mitochondrial metabolism; Redox stress; Succinate dehydrogenase (SDH).


Figures

Figure 1
Figure 1
Itaconate inhibited SDH activity in primary cortical neurons. A) Intracellular itaconate levels increased after exposure to 2 mM exogenous itaconate for 2 h. B) Exogenous itaconate drove succinate accumulation while the other metabolites were not affected. Cells were exposed to 2 mM of exogenous itaconate for 2 h. C) Oxygen consumption rate in primary cortical neurons exposed to 2 mM itaconate significantly decreased compared to untreated cells. D) Succinate driven respiration (complex II) in permeabilized primary cortical neurons administered 5 mM succinate and 0.5 μM rotenone. Addition of 5 mM itaconate decreased the oxygen consumption rate. E) Schematic depicting itaconate as a metabolic inhibitor for succinate dehydrogenase (SDH) regulating ROS production upon reperfusion. Data are represented as box (25th to 75th percentile with median line) and whiskers (min. to max. values) with three (A and B) or means ± s.e.m. with 6 biological replicates (C and D). All of the experiments were repeated three independent times with similar results, with the exception of C, which was performed once with 6 biological replicates. Student's t-test with ****P < 0.0001.
Figure 2
Figure 2
Itaconate impacted substrate utilization for central carbon metabolism and promoted glutamine metabolism in cultured brain cells. A) Relative intracellular metabolite abundances in primary cortical neurons exposed to exogenous itaconate for 48 h. B) Primary cortical neurons did not metabolize 13C itaconate into pyruvate or TCA cycle intermediates in a detectable amount. Cells were exposed to 2 mM [U–13C]itaconate for 48 h and fractional enrichment from 13C itaconate is depicted in dark gray. C) Schematic depicting substrate utilization for TCA cycle metabolism using [U–13C]glucose (red), [U–13C]β-hydroxybutyrate (blue), [U–13C]leucine (green), and [U–13C]glutamine (brown). Open circles depict 12C, and closed circles represent 13C. D) Itaconate decreased 13C incorporation into citrate from 13C substrates [U–13C]leucine (green), [U–13C]β-hydroxybutyrate (blue, bHb), and [U–13C]glucose (red) in primary cortical neurons, while incorporation from [U–13C]glutamine (brown) increased. E) Itaconate increased glutamine metabolism in primary cortical neurons cultured in medium containing [U–13C]glutamine. Graph depicts M4 or M5 labeling on metabolite from 13C glutamine. F) Intracellular metabolite abundances in primary astrocytes exposed to 2 mM exogenous itaconate relative to control condition without itaconate. G) Itaconate increased glutamine metabolism in primary astrocytes cultured in medium containing [U–13C]glutamine. Graph depicts M4 or M5 labeling on metabolite from 13C glutamine. Cells were cultured for 48 h in 13C medium supplemented with 0 mM or 2 mM itaconate. Data are represented as box (25th to 75th percentile with median line) and whiskers (min. to max. values) with six (A) or three (F) biological replicates, or means ± s.e.m. with three biological replicates (B, D, E, and G). All of the experiments were repeated three independent times with the exception of D. Leucine and bHb trace were performed once. Student's t-test with *P < 0.05, **P < 0.01, and ***P < 0.001.
Figure 3
Figure 3
Itaconate induced anti-oxidant cell response in primary brain cells. A) Itaconate induced expression of anti-oxidant-related genes in primary cortical neurons. B) NRF2, HMOX1, and actin protein expression in primary cortical neurons depicted as Western blotting. C) NRF2 and HMOX1 protein expression in primary cortical neurons depicted as band intensity normalized to actin (from Western blotting depicted in B). D) Expression of anti-oxidant related genes in primary astrocytes. E) Schematic overview of proteins involved in oxidative stress response. Slc7a11: cystine-glutamate transporter; Gclm: glutamate-cysteine ligase; Gsr: glutathione reductase; Gpx1: glutathione peroxidase 1; Nqo1: NAD(P)H dehydrogenase; G6pd: glucose-6-phosphate dehydrogenase; Hmox1: heme oxygenase 1. Cells were exposed to 2 mM exogenous itaconate for 48 h. Data are represented as means ± s.e.m. with three biological replicates (with two technical replicates for each gene expression study). All of the experiments were repeated two independent times with similar results. Student's t-test with *P < 0.05 and **P < 0.01.
Figure 4
Figure 4
Itaconate modulated brain redox metabolism in a cerebral ischemia-reperfusion model. A) Experimental overview of a mouse animal model of acute cerebral ischemia. Mice were infused with NaCl (vehicle, blue), or itaconate (15 mg/kg/min, red) for 30 min prior to ligation. 60 min after ligation, reperfusion was initiated and the mice were infused again for 30 min. B) Plasma itaconate levels 2 and 24 h after reperfusion. C) Plasma metabolite levels 24 h after reperfusion in vehicle compared to itaconate-treated group relative to baseline. D) Total glutathione levels in brain tissue 24 h after reperfusion. E) Reduced glutathione (GSH) levels in brain tissue 24 h after reperfusion. F) Oxidized glutathione (GSSG) levels in brain tissue 24 h after reperfusion. G) GSH (reduced)/GSSG (oxidized) glutathione levels in brain tissue 24 h after reperfusion. H) Reduction potential (NADH/NAD ratio) indicating mitochondrial oxidative phosphorylation 2 h after reperfusion relative to baseline. I) Reactive oxygen/nitrogen species (ROS/RNS) in brain tissue 2 h after reperfusion. Data are represented as box (25th to 75th percentile with median line) and whiskers (min. to max. values) (B, D-G, and I) or means ± s.e.m. (C and H). Experiments were performed with n = number of male mice aged 9 weeks. Two-way ANOVA (B with n = 2 for vehicle and n = 5 for itaconate; H, n = 5) or one-way ANOVA (D-G and I, n = 5) with *P < 0.05, **P < 0.01, and ***P < 0.001.
Figure 5
Figure 5
Itaconate improved hemodynamics and brain function after reperfusion injury. A) Cerebral arteriolar diameter 2 h after reperfusion in cranial window model. B) Cerebral arteriolar blood flow 2 h after reperfusion in cranial window model. C) Itaconate increased cerebral oxygen tension 2 h after reperfusion. D) Brain edema 24 h after reperfusion is shown as % water content in brain considering brain weights (mg) (mean ± s.e.m.) of the sham (458.6 mg ± 5.6 mg), itaconate (475.0 mg ± 6.3 mg), and vehicle (503.6 ± 8.1 mg) groups. E) Leukocyte adhesion as a parameter for inflammation significantly decreased in itaconate-infused group 2 h after reperfusion compared to control groups. F) Infusion of itaconate improved neurological scores upon reperfusion. Data are represented as box (25th to 75th percentile with median line) and whiskers (min. to max. values) (A, B, C, and D) or means ± s.e.m. (E and F). Experiments were performed with n = number of male mice aged 9 weeks. A, B, n = 6 mice with 14–16 analyzed blood vessels; C, D, F: n = 5; E, n = 4). One-way ANOVA (A–D) or two-way ANOVA (E and F), with *P < 0.05, **P < 0.01, and ***P < 0.001.
Figure 6
Figure 6
Itaconate reduced mortality from TBI with hemorrhagic shock. A) Mice were subjected to fluid percussion TBI followed by hemorrhage of 50% of the animal's blood volume. Volume resuscitation was accomplished by preserving the mean arterial pressure (MAP) above 70 mmHg for 4 h. Fluid resuscitation was accomplished using lactated Ringer's solution (LR), plasma expander Hextend, or Hextend supplemented with 15 mg/ml itaconate. B) Total resuscitation volume used to maintain the MAP above 70 mmHg 1 and 4 h after reperfusion in control groups compared to itaconate-infused group. Data are represented as means ± s.e.m., with Student's t-test *P < 0.05 4 h after reperfusion. C) Itaconate improved survival rates in a mouse model of TBI/shock (67% survival) compared to control groups with lactated Ringer's solution (LR) and plasma expander Hextend (17% survival). *P < 0.05. Experiments were performed with all groups n = 6 male mice aged 9 weeks.

References

    1. Eltzschig H.K., Eckle T. Ischemia and reperfusion-from mechanism to translation. Nature Medicine. 2011;17(11):1391–1401. - PMC - PubMed
    1. White B.C., Sullivan J.M., DeGracia D.J., O'Neil B.J., Neumar R.W., Grossman L.I. Brain ischemia and reperfusion: molecular mechanisms of neuronal injury. Journal of the Neurological Sciences. 2000;179(S 1–2):1–33. - PubMed
    1. McCord J.M. Oxygen-derived radicals: a link between reperfusion injury and inflammation. Federation Proceedings. 1987 - PubMed
    1. Chouchani E.T., Pell V.R., James A.M., Work L.M., Saeb-Parsy K., Frezza C. A unifying mechanism for mitochondrial superoxide production during ischemia-reperfusion injury. Cell Metabolism. 2016;23(2):254–263. - PubMed
    1. Chouchani E.T., Pell V.R., Gaude E., Aksentijević D., Sundier S.Y., Robb E.L. Ischaemic accumulation of succinate controls reperfusion injury through mitochondrial ROS. Nature. 2014;515(7527):431–435. - PMC - PubMed

Publication types