. 2020 Mar;30(3):347-360.
doi: 10.1101/gr.257550.119. Epub 2020 Feb 6.

Alternative polyadenylation drives oncogenic gene expression in pancreatic ductal adenocarcinoma

Affiliations

Alternative polyadenylation drives oncogenic gene expression in pancreatic ductal adenocarcinoma

Swati Venkat et al. Genome Res. 2020 Mar.

Abstract

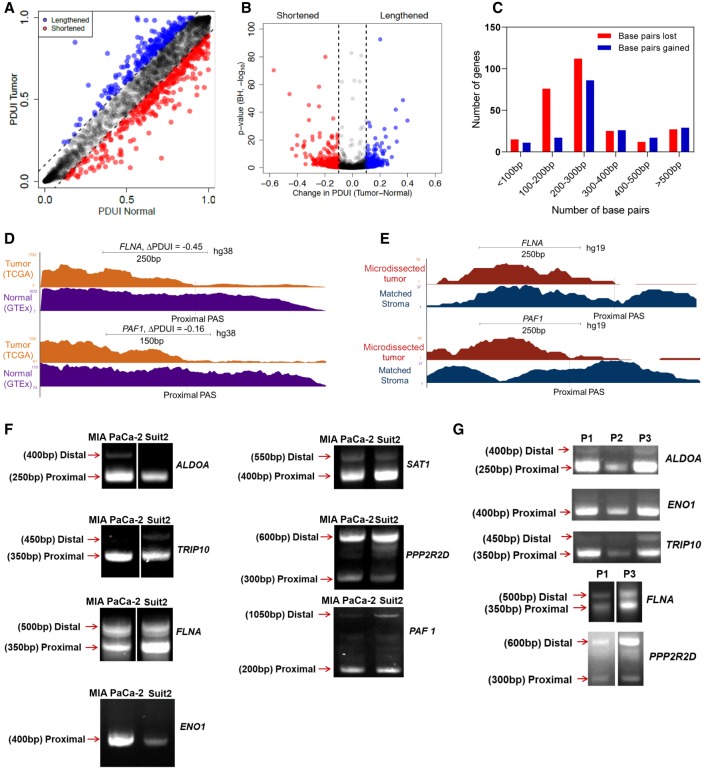
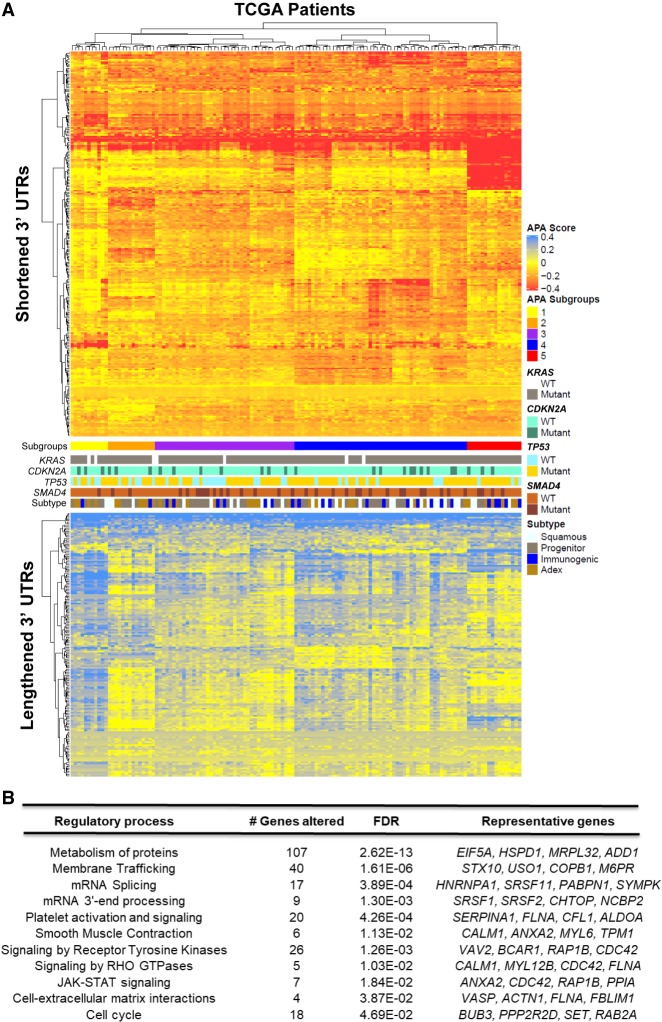
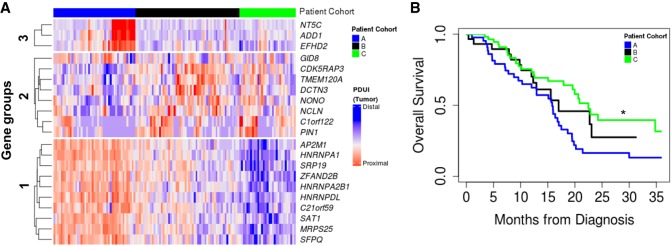
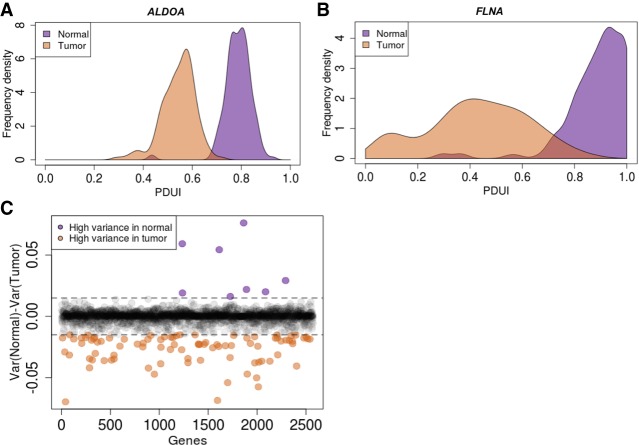
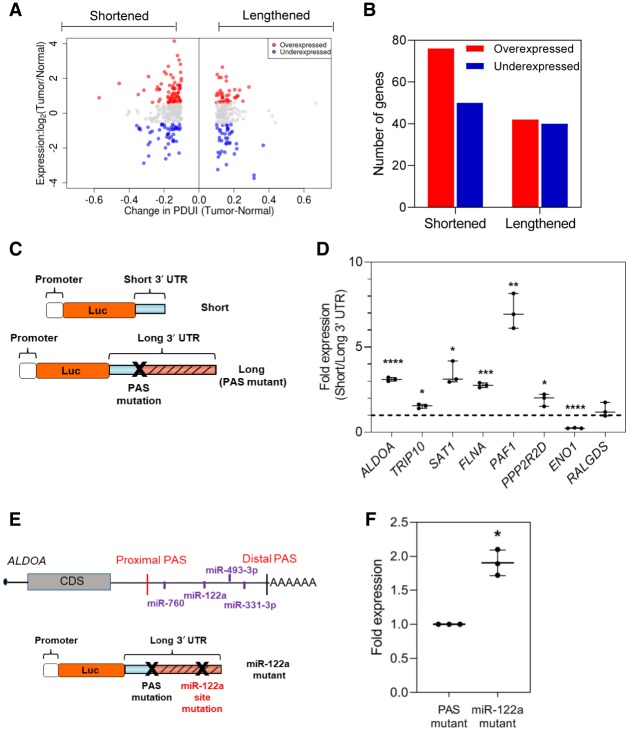
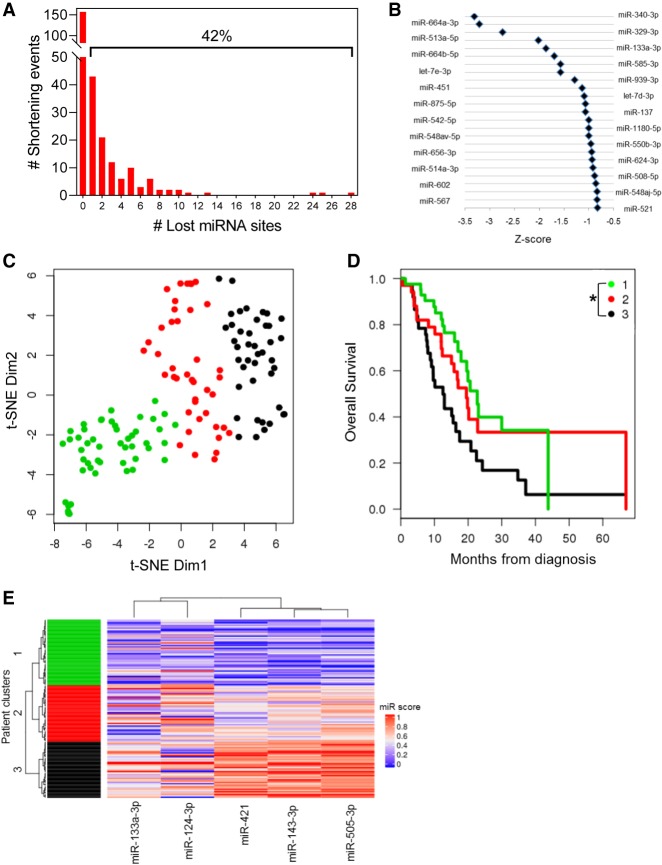
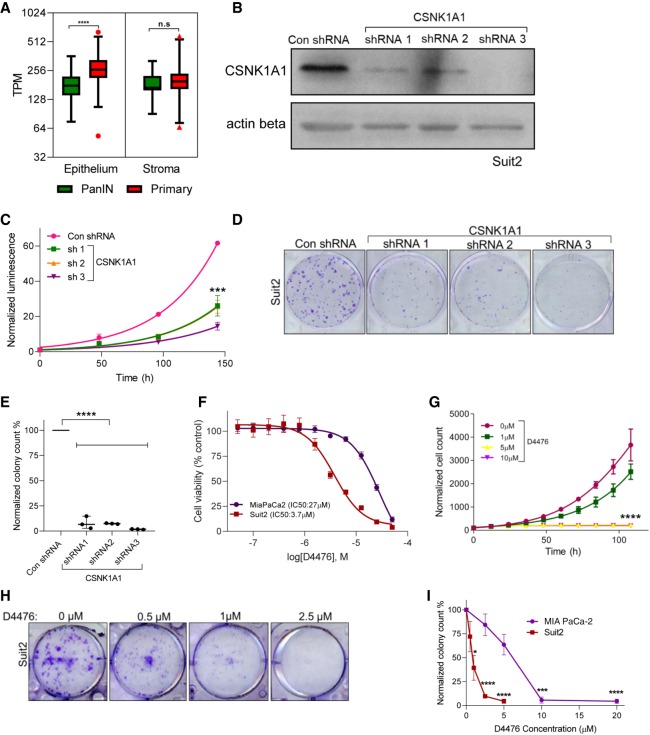
Alternative polyadenylation (APA) is a gene regulatory process that dictates mRNA 3'-UTR length, resulting in changes in mRNA stability and localization. APA is frequently disrupted in cancer and promotes tumorigenesis through altered expression of oncogenes and tumor suppressors. Pan-cancer analyses have revealed common APA events across the tumor landscape; however, little is known about tumor type-specific alterations that may uncover novel events and vulnerabilities. Here, we integrate RNA-sequencing data from the Genotype-Tissue Expression (GTEx) project and The Cancer Genome Atlas (TCGA) to comprehensively analyze APA events in 148 pancreatic ductal adenocarcinomas (PDACs). We report widespread, recurrent, and functionally relevant 3'-UTR alterations associated with gene expression changes of known and newly identified PDAC growth-promoting genes and experimentally validate the effects of these APA events on protein expression. We find enrichment for APA events in genes associated with known PDAC pathways, loss of tumor-suppressive miRNA binding sites, and increased heterogeneity in 3'-UTR forms of metabolic genes. Survival analyses reveal a subset of 3'-UTR alterations that independently characterize a poor prognostic cohort among PDAC patients. Finally, we identify and validate the casein kinase CSNK1A1 (also known as CK1alpha or CK1a) as an APA-regulated therapeutic target in PDAC. Knockdown or pharmacological inhibition of CSNK1A1 attenuates PDAC cell proliferation and clonogenic growth. Our single-cancer analysis reveals APA as an underappreciated driver of protumorigenic gene expression in PDAC via the loss of miRNA regulation.


Figures

Figure 1.
Figure 1.
Integrative analysis of RNA-seq data identifies 3′-UTR alterations associated with PDAC. (A) A plot of PDUI score of each gene in human tumor and normal samples. Dashed lines represent 0.1 cutoffs. Blue dots represent 3′-UTR-lengthened genes, and red dots represent 3′-UTR-shortened genes. (B) A volcano plot denoting 3′-UTR-shortened (red) and -lengthened (blue) gene hits (FDR < 0.01) whose |ΔPDUI| > 0.1. (C) A plot showing the number of base pairs lost/gained by 3′-UTR-altered genes. (D) UCSC Genome Browser plot depicting the 3′-UTR RNA-seq density profile of two 3′-UTR-shortened genes (FLNA and PAF1) to highlight the coverage differences between tumor (orange) and normal (purple) patient samples. (E) UCSC Genome Browser plot highlighting the 3′-UTR profile differences between FLNA and PAF1 in a microdissected data set in patient tumor (red) and stroma (blue). (F) 3′ RACE of altered PDAC-associated genes in MIA PaCa-2 and Suit2 cells (representative images, n = 3). Approximate length of the 3′-UTR form is denoted beside each band. (G) 3′ RACE of select genes in primary patient samples (P1, P2, P3).
Figure 2.
Figure 2.
3′-UTR changes are widespread among PDAC patients and enriched in PDAC pathways. (A) The heatmap shows genes (rows) undergoing 3′-UTR shortening (red) or lengthening (blue) in each patient tumor (columns) compared to median score in normal pancreas for that gene. The profile of KRAS, CDKN2A, TP53, and SMAD4 mutations as well as tumor subtype is shown in the context of distinct APA-derived patient subgroups. (B) Significantly enriched (FDR < 0.05) reactome pathways associated with 3′-UTR-altered genes.
Figure 3.
Figure 3.
APA events identify a poor prognostic cohort in PDAC patients. (A) Patients were clustered based on 3′-UTR short (red) and long forms (blue) of 3′-UTR-altered genes (clustered into gene Groups 1, 2, and 3) and segregated into patient Cohort A (blue), patient Cohort B (black), and patient Cohort C (green). (B) Kaplan–Meier survival plot for patient Cohort A (blue), patient Cohort B (black), and patient Cohort C (green): (*) P < 0.05.
Figure 4.
Figure 4.
PDAC patients show substantial heterogeneity in the extent of proximal PAS usage of metabolic genes. (A) Example of a 3′-UTR-shortened gene (ALDOA) that has a tight distribution of its proximal PAS usage in normal pancreas (purple) as well as PDAC patients (orange). (B) A 3′-UTR-shortened gene (FLNA) that has a tight distribution in normal pancreas (purple); however, the extent of proximal PAS usage varies greatly across PDAC patients (orange). (C) Plot of variance in PDUI for all genes between tumor and normal. Purple dots represent genes with high variance in normal samples, and orange dots represent genes with high variance in tumor samples. Dashed lines represent 0.015 and −0.015 cutoffs.
Figure 5.
Figure 5.
APA drives altered protein expression in PDAC. (A) Log fold change in gene expression is plotted against ΔPDUI for 3′-UTR-altered genes. Overexpressed genes (red dots) and underexpressed genes (blue dots) on the left represent 3′-UTR-shortened hits, whereas those to the right represent 3′-UTR-lengthened hits. (B) Quantification of 3′-UTR-altered genes that are overexpressed (red) or underexpressed (blue) in PDAC tumors. (C) Schematic illustrating the luciferase reporter constructs. (D) Normalized fold expression change of the luciferase reporter (short 3′ UTRs/long 3′ UTRs) for the selected list of 3′-UTR-altered genes (n = 3). The long 3′-UTR expression for each gene is normalized to 1. Each whisker plot denotes the median as the centerline and the minimum and maximum values as the whiskers: (*) P < 0.05; (**) P < 0.01; (***) P < 0.005; (****) P < 0.001. (E) Schematic showing the ALDOA 3′ UTR with positions of conserved miRNA sites as well as the miRNA mutant construct used. (F) Fold expression change of miRNA mutant construct compared to the PAS mutant in luciferase assays (n = 3). The PAS mutant expression is normalized to 1.
Figure 6.
Figure 6.
APA-mediated loss of tumor-suppressive miRNA binding sites is associated with poor patient outcome. (A) Number of genes that lose highly conserved miRNA binding sites because of 3′-UTR shortening. The percentage of genes that lose at least one miRNA binding site is indicated above the bracket. (B) Highly conserved miRNA families were plotted against their Z-score, an index of the lost binding sites in which a more negative Z-score indicates more significant binding site loss. (C) t-SNE plot depicting TCGA patient clusters in the highly conserved miRNA feature space. (D) Kaplan–Meier survival plot for the three patient clusters identified in C: (*) P < 0.05 for Cluster 1 to Cluster 3 comparison. (E) Heatmap depicting the association of miRNA binding site loss (miR score) with patient clusters.
Figure 7.
Figure 7.
CSNK1A1 is required for cell proliferation and is a putative drug target in PDAC. (A) A plot showing CSNK1A1 gene expression (in transcripts per million) in PDAC (red) as compared to PanIN lesions (green) in the epithelium and stroma from microdissected samples: (****) P < 0.001. (B) A representative blot confirming CSNK1A1 knockdown in Suit2 cells with a nontargeting control shRNA (Con shRNA) or with one of three different shRNAs targeting CSNK1A1: n = 3. ACTB (also known as actin beta) is shown as a loading control. (C) Cell proliferation of Suit2 control and CSNK1A1-knockdown cells: n = 3; (***) P < 0.005. (D) Clonogenic growth assay of control and CSNK1A1-knockdown cells: n = 3. (E) Quantification shows the number of colonies in D: n = 3; (****) P < 0.001. (F) Dose-response of MIA PaCa-2 (purple) and Suit2 (red) cell lines to the CSNK1A1 small molecule inhibitor, D4476: n = 3. (G) Cell proliferation of Suit2 cells treated with indicated doses of D4476: n = 3; (****) P < 0.001. (H) Clonogenic growth assay of Suit2 cells treated with indicated drug doses. (I) Quantification shows the number of colonies in H: (***) P < 0.005; (****) P < 0.001.

References

    1. Aran D, Camarda R, Odegaard J, Paik H, Oskotsky B, Krings G, Goga A, Sirota M, Butte AJ. 2017. Comprehensive analysis of normal adjacent to tumor transcriptomes. Nat Commun 8: 1077 10.1038/s41467-017-01027-z - DOI - PMC - PubMed
    1. Bailey P, Chang DK, Nones K, Johns AL, Patch AM, Gingras MC, Miller DK, Christ AN, Bruxner TJ, Quinn MC, et al. 2016. Genomic analyses identify molecular subtypes of pancreatic cancer. Nature 531: 47–52. 10.1038/nature16965 - DOI - PubMed
    1. Baradaran B, Shahbazi R, Khordadmehr M. 2019. Dysregulation of key microRNAs in pancreatic cancer development. Biomed Pharmacother 109: 1008–1015. 10.1016/j.biopha.2018.10.177 - DOI - PubMed
    1. Benjamini Y, Hochberg Y. 1995. Controlling the false discovery rate: a practical and powerful approach to multiple testing. J R Statist Soc B 57: 289–300. 10.1111/j.2517-6161.1995.tb02031.x - DOI
    1. Boutet SC, Cheung TH, Quach NL, Liu L, Prescott SL, Edalati A, Iori K, Rando TA. 2012. Alternative polyadenylation mediates microRNA regulation of muscle stem cell function. Cell Stem Cell 10: 327–336. 10.1016/j.stem.2012.01.017 - DOI - PMC - PubMed

Publication types

MeSH terms