. 2021 Feb 1;106(2):495-512.
doi: 10.3324/haematol.2019.234385.

Ataxia-telangiectasia mutated interacts with Parkin and induces mitophagy independent of kinase activity. Evidence from mantle cell lymphoma

Affiliations

Ataxia-telangiectasia mutated interacts with Parkin and induces mitophagy independent of kinase activity. Evidence from mantle cell lymphoma

Aloke Sarkar et al. Haematologica. .

Abstract

Ataxia telangiectasia mutated (ATM), a critical DNA damage sensor with protein kinase activity,is frequently altered in human cancers including mantle cell lymphoma (MCL). Loss of ATM protein is linked to accumulation of nonfunctional mitochondria and defective mitophagy, in both murine thymocytes and in A-T cells. However, the mechanistic role of ATM kinase in cancer cell mitophagy is unknown. Here, we provide evidence that FCCP-induced mitophagy in MCL and other cancer cell lines is dependent on ATM but independent of its kinase function. While Granta-519 MCL cells possess single copy and kinase dead ATM and are resistant to FCCP-induced mitophagy, both Jeko-1 and Mino cells are ATM proficient and induce mitophagy. Stable knockdown of ATM in Jeko-1 and Mino cells conferred resistance to mitophagy and was associated with reduced ATP production, oxygen consumption, and increased mROS. ATM interacts with the E3 ubiquitin ligase Parkin in a kinase-independent manner. Knockdown of ATM in HeLa cells resulted in proteasomal degradation of GFP-Parkin which was rescued by the proteasome inhibitor, MG132 suggesting that ATM-Parkin interaction is important for Parkin stability. Neither loss of ATM kinase activity in primary B cell lymphomas nor inhibition of ATM kinase in MCL, A-T and HeLa cell lines mitigated FCCP or CCCP-induced mitophagy suggesting that ATM kinase activity is dispensable for mitophagy. Malignant B-cell lymphomas without detectable ATM, Parkin, Pink1, and Parkin-Ub ser65 phosphorylation were resistant to mitophagy, providing the first molecular evidence of ATM's role in mitophagy in MCL and other B-cell lymphomas.


Figures

Figure 1.
Figure 1.
Mitophagy disparity in ATM-deficient and -proficient mantle cell lymphoma cell lines. (A) Representative flow cytometry (FCS) profile of mantle cell lymphoma (MCL) cell lines (5x10⁶ live cells) treated with FCCP (75 M for 3 h), stained with TMRE (PE) or Mitotracker deep red (APC) and acquired by a FACSCalibur and analyzed by FlowJo software. (B) Relative mitochondrial mass and membrane potential (m) in dimethylsulfoxide (DMSO)-treated (control) or FCCP-treated MCL cell lines (geometric mean; n=7; mean ± standard error of mean [SEM]). *P<0.05; **P<0.01; ***P<0.001 showing significant difference from DMSO controls. (C) Representative FCS profile of MitoSOX Red-stained, untreated MCL cell lines showing basal levels of mitochondrial reactive oxygen species (mROS). (D) Relative basal mROS in untreated MCL cell lines (geometric mean; n=3; *P<0.05 significant difference between Mino and Granta-519 cells). (E) Representative FCS profile of H2DCFDA-stained global ROS levels in MCL cell lines. (F) Immunoblot analysis of MCL cells lines (30 g total protein) treated with DMSO or FCCP, as in (A) or irradiation (IR) (5x10⁶ cells; 5 Gray) showing disparities in mitophagy. Separate blots were cut into pieces and probed with the indicated antibodies. Total and phosphorylated bands were merged and shown in color for specificity. Phospho-ATM, Smc-1, Kap-1 and p53 proteins represent DNA damage sensors. Decreases in Tom20 and COXIV levels reflect mitophagy and LC3 lipidation represents global autophagy. GAPDH was probed as a loading control each time. (G) FCS analysis showing IR (5 Gray)-induced ATMSer1981 and H2AXSer139 phosphorylation in MCL cell lines. One hour after IR treatment, cells were washed and stained with PE-ATMSer1981 and FITC-H2AXSer139, washed and acquired by a FACSCalibur and analyzed by FlowJo software, as in (1A). (H) Cell fractionation immunoblot analysis of MCL cell lines (30x106 cells per treatment) showing basal and FCCP (75 M for 3 h)-induced mitophagy from whole cells (20 g) and mitochondrial fractions (10 g). GAPDH was probed to distinguish whole cell and mitochondrial proteins. Nuclear contamination in the mitochondrial fraction was detected by Lamin. Separate sets of blots were probed with the indicated antibodies. Parkin, phospho-Parkin and Pink1 were probed using an electrochemoluminescence method. Total and phosphorylated bands were merged and shown in color for specificity. GAPDH was probed as a loading control each time.
Figure 2.
Figure 2.
Defective mitophagy in mantle cell lymphoma shATM cell lines. (A) Immunoblot analysis of stable lentiviral knockdown of ATM in Jeko-1 and Mino cells showing irradiation (IR)-induced defective phospho-ATMSer1981, -Kap1Ser824, -Smc1Ser966 and -p53Ser15 expression. Separate blots (20 g total protein) were cut into pieces and probed with the indicated antibodies. Total and phosphorylated bands were merged and are shown in color for specificity. GAPDH was probed as a loading control each time. (B) Representative flow cytometry (FCS) profile showing IR (as in Figure 1G)-induced ATMSer1981 and H2AXSer139 phosphorylation in control and shATM mantle cell lymphoma (MCL) cell lines. (C) Representative FCS profile of MitoSOX Red-stained cells showing basal levels of mitochondrial reactive oxygen species (mROS) in control and shATM MCL cell lines. (D) Relative geometric mean of mROS levels in basal and untreated (as in Figure 1F) MCL shATM clones (n=3; mean ± standard error of mean [SEM]; *P<0.05) showing significant difference from respective control shRNA. (E) Representative FCS profile (as in Figure 1A) showing mitochondrial mass and mitochondrial membrane potential (m) in control or shATM clones treated with dimethylsulfoxide (DMSO) or FCCP in MCL cell lines. (F) Immunoblot analysis of whole cell extracts (30 μg total protein) from Jeko-1 and Mino shATM clones treated with FCCP or DMSO. Separate blots were cut into pieces and probed with the indicated antibodies. GAPDH was probed as a loading control each time. (G) Tom20 densitometry analysis from triplicate experiments (Figure 2F) with data presented as mean ± SEM; *P<0.05, **P<0.01: significant differences from respective DMSO controls. (H) Relative geometric mean of mitochondrial mass in DMSOor FCCP-treated (as in Figure 1B) MCL control and shATM clones (n=4; mean ± SEM). ***P<0.001, ****P<0.0001: significant differences from respective DMSO controls. (I) Quantitative polymerase chain reaction analysis of mitochondrial DNA copy number in untreated shRNA control and shATM MCL clones showing mean ± SEM (=3). *P<0.05, **P<0.001, ****P<0.0001: significant differences from respective control shRNA. mtDNA: mitochondrial DNA.
Figure 3.
Figure 3.
Decreased mitochondrial respiration in shATM mantle cell lymphoma cell lines. (A) High performance liquid chromatography analysis of basal intracellular nucleotide (NTP) levels in untreated mantle cell lymphoma (MCL) control and shATM clones showing mean ± standard error of mean (SEM) (n=3). *P<0.05, **P<0.01: significant differences from respective control shRNA. (B) Graphical representation of the mitochondrial stress test assay in untreated Mino control and shATM clones (8×10⁴ live cells). Treatment with a mitochondrial ATP synthesis uncoupler, FCCP, resulted in the maximal oxygen consumption rate (OCR) by the respiratory chain. Furthermore, addition of rotenone and antimycin A (complex I and III inhibitors, respectively) prevented the transfer of electrons and thereby diminished OCR, indicating an overall reduction in mitochondria-linked aerobic respiration and ATP production in shATM cells. (C) Relative OCR in untreated MCL shATM clones showing mean ± SEM; (n=3). **P<0.01, ***P<0.001: significant differences from control shRNA. (D) Relative mitochondrial spare respiratory capacity in untreated MCL shATM clones showing mean ± SEM; (n=3). **P<0.01, ***P<0.001, ****P<0.0001: significant differences from control shRNA.
Figure 4.
Figure 4.
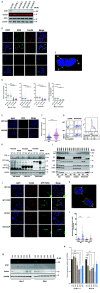
ATM is localized inside mitochondria: evidence from HeLa cells. (A) Immunoblot analysis (30 g total protein) of five different stable lentiviral shATM in HeLa cells. A single blot was cut into pieces and probed with the indicated antibodies. Actin was probed as a loading control. (B) Representative confocal z-plane image analysis (scale: 10 m) showing nuclear and extra-nuclear ATM localization in WT and Kd control (dimethylsulfoxide, DMSO) or CCCP-treated (50 M for 3 h) HeLa cells. Nuclei are stained with DAPI. (C) Arrows in the inset of Figure 4B showing the localization of ATM in the nucleus (N), cytosol (C, green dots) or mitochondria (M, co-localized with Tom20, yellow dots). A Laplacian filter was used to identify both ATM and Tom20 co-localization in the merged image. (D) There were significantly fewer cellular ATM dots in whole cells and in all cellular compartments in Kd ATM compared to WT control cells. Significantly more mitochondrial ATM (co-localized ATM-Tom20 dots) was observed in WT HeLa cells treated with CCCP. WT control (162 cells), WT-CCCP (176 cells); Kd control (112 cells) and Kd-CCCP (121 cells) were scanned. Data represent mean ± standard error of mean (n=3 from separate passages of cell lines following GFP-Parkin transfection). *P<0.05, ****P<0.0001 significant differences from respective controls, as indicated. DAPI represents nuclear staining. (E). Representative confocal z-plane image of WT and Kd HeLa cells showing mitochondrial nucleoids. Untreated cells were stained with anti-DNA (red) antibody (scale: 10 m). DAPI represents nuclear staining. (F) Significantly higher (****P<0.0001) mitochondrial nucleoids in untreated Kd compared to WT HeLa cells. WT (228 cells), and Kd (385 cells) were scanned from three separate passages of cell lines and plotted. (G) WT and Kd HeLa cells were transiently transfected with plasmids (3 g of each pcDNA control or GFP-Parkin). Representative FCS profile showing GFP expression 36 h after transfection (left panel) or merged GFP subsets (right panel). (H) Immunoblot analysis (30 g total protein) showing ATM and GFP expression from transient (48 h) and stable (3 weeks) transfection with GFP vector, GFP-LC3 or GFP-Parkin plasmids in WT and Kd HeLa cells. A single blot was cut into pieces and probed with the indicated antibodies. GAPDH was probed as a loading control. (I) Cell fractionation immunoblot analysis of WT and Kd HeLa cells showing cellular GFP distribution following transient transfection with GFP-Parkin (48 h). Cells (10x106) treated with DMSO or CCCP (50 M for 3 h) were fractionated and then 30 g total or 10 g each of nuclear, cytoplasmic, and mitochondrial proteins were loaded and probed with the indicated antibodies. Lamin and GAPDH were probed as nuclear and cytoplasmic loading controls. (J) Representative confocal z-plane image analysis (scale: 10 m) 48 h after GFP-Parkin transfection, showing GFP-Parkin co-localization with the mitochondrial marker Tom20 in WT and Kd HeLa cells treated with DMSO (Ctrl) or CCCP (50 M for 3 h). Nuclei were stained with DAPI. (K) Inset of Figure 4J, with arrows showing co-localization of GFP-Tom20 (yellow dots) inside mitochondria after WT HeLa cells had been treated with CCCP. A Laplacian filter was used to identify both GFP-Parkin and Tom20 foci revealing co-localization in the merged image. (L) CCCP treatment resulted in a greater abundance of mitochondrial GFP-Parkin-Tom20 co-localization in WT (****P<0.0001) compared to Kd (*P<0.05) HeLa cells. WT control (68 cells), WT-CCCP (200 cells); Kd control (59 cells) and Kd-CCCP (133 cells) were scanned from three separate passages of cell lines and plotted. (M) Immunoblot analysis (30 μg total protein) from mantle cell lymphoma (MCL) shATM cell lines (between passage 2-5) showing loss of endogenous Parkin (electrochemoluminescence blot). Blots were cut into pieces and probed with the indicated antibodies. GAPDH was probed as a loading control. (N) Densitometry analysis showing basal Parkin expression from three separate replicates of MCL control and shATM clones. Data represent mean ± standard error of mean (n=3 from separate passages of cell lines until passage 5), *P<0.05, **P<0.01, ****P<0.0001: significant differences from respective controls, as indicated.
Figure 5.
Figure 5.
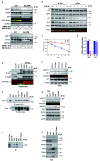
ATM interacts with Parkin and confers Parkin stability independent of kinase activity. (A) Immunoblot analysis (30 g total protein) from wildtype (WT) and knocked down (Kd) HeLa cells transiently transfected with 3 g of GFP-Parkin and then, 96 h later, treated with the proteasome inhibitor MG132 (10 M) for the indicated time points. Dimethylsulfoxide (DMSO) served as a control at 0 or 12 h. Blots were cut into pieces and probed with the indicated antibodies. ATM, GFP, Parkin and GAPDH were probed using the Licor method while Pink1 (separate blot from similar extract) was probed using an electrochemoluminescence (ECL) method with cells treated with DMSO at 0 h as the control. GAPDH was probed as a loading control in each case. (B) ATM alters the stability of Parkin protein. Immunoblot analysis of WT and Kd HeLa cells transfected with GFP-Parkin and then, 48 h later, treated with cycloheximide (10 g/mL) for the indicated times. Immunoblot analysis (30 g total protein) from WT and Kd HeLa cells were probed with the indicated antibodies. HSP90 and Mcl-1, representing long- and short halflife proteins, were probed. Merged image showing Mcl- 1 and GAPDH (as a loading control). (C) Quantification of immunoblots from triplicate experiments as in (B). Statistical analysis was performed using a two-tailed unpaired t-test. Points represent the mean ± standard error of mean (SEM). *P≤0.05; **P≤0.01. (D) Quantitative reverse transcriptase polymerase chain reaction analysis of WT and Kd HeLa cells 72 h after transfection with GFP-Parkin, as in (B), showing the lack of effect of ATM knockdown on GFP mRNA expression in either cell lines (n=3; mean ± SEM; ***P<0.001: significant difference from WT control). (E) WT and Kd HeLa cells were transiently transfected with 3 μg of GFP-Parkin and then 48 h later cell lysates (500 g) were immunoprecipitated with mouse anti- ATM antibody and probed with both GFP and Parkin antibodies. WT-GFP transfected cells were treated with CCCP to induce mitophagy (50 M for 3 h), KU60019 (10 M for 2 h) or neocarzinostatin (NCS) (40 nM for 2 h) before immunoprecipitation. Kd HeLa cells were left untreated and served as a negative control. Arrows indicate GFP or Parkin bands superimposed in a Licor image showing their specificity. Untreated WT-GFP transfected input cell extract (10 g) was loaded to show the specific GFP band. IgG mouse served as an isotype matched mouse IgG control. (F) Input controls (5%) of the immunoprecipitation (IP) analysis from (E). Immunoblot analysis showing total and ATMSer1981phosphorylation. Blots were cut into pieces and probed with the indicated antibodies. GAPDH served as a loading control. (G) Endogenous co-immunoprecipitation of the Mino MCL cell line (500 g for each treatment) either with rabbit anti-Parkin antibody and probed with mouse anti-ATM (upper lanes) or with rabbit anti-ATM antibody and probed with mouse anti- Parkin antibody (lower lanes, both ECL blots). Cells were pretreated with FCCP (50 M for 3 h), KU60019 (10 M for 1 h) or NCS (40 nM for 1 h) before IP. (H) Input controls (5%) of the IP analysis from Figure 5G. Immunoblot analysis showing FCCP-induced ATMSer1981 phosphorylation or inhibition by KU60019. NCS served as a positive control for both ATMSer1981 and Kap1Ser824 phosphorylation. Total and phosphorylated bands were merged and are shown in color for specificity. The Parkin blot was probed using ECL reagents. GAPDH was used as a loading control each time. (I) IP analysis of an endogenous ATM-Parkin interaction in total, cytoplasm, mitochondria or trypsin-digested mitochondria in untreated Mino cells (10x106 cells in each group) following cell fractionation. The Parkin-ATM interaction was detected in total, cytoplasm or in the untreated mitochondria but not in isolated mitochondria treated with trypsin. Isolated cellular fractions were immunoprecipitated with rabbit-Parkin antibody and probed with mouse ATM antibody. A 10 L input control from the total cell extract was loaded to specify the ATM band. Rabbit IgG served as a negative control. (J) Input controls (5%) of the IP analysis from (I). Immunoblot analysis showing presence of ATM in total, cytoplasm, or in undigested mitochondria but not in isolated mitochondria treated with trypsin. GAPDH and HSP90 served as positive controls for their cytoplasmic abundance. Tom20 served as an outer mitochondrial membrane translocase while TIM23 represents an inner membrane translocase in trypsin-digested mitochondria.
Figure 6.
Figure 6.
ATM kinase activity is dispensable in mitophagy in HeLa, mantle cell lymphoma cell lines and primary B-cell lymphomas. (A) Representative flow cytometry (FCS) data showing mitophagy in mantle cell lymphoma (MCL) cell lines (5x10⁶ live cells) treated with FCCP (75 M for 3 h) or the ATM kinase inhibitor, KU60019 (10 M for 1 h), either alone or in combination. Following treatments, cells were washed and stained with TMRE (PE) and Mitotracker deep red (APC) and acquired by a FACSCalibur and analyzed with FlowJo software. (B) Relative geometric mean of mitochondrial mass, as in (A), in MCL cell lines treated with FCCP, KU60019 or their combination (mean ± standard error of mean [SEM]; n=7; *P<0.05, **P<0.01: significant difference from respective dimethylsulfoxide [DMSO] or FCCP controls). (C) Representative FCS profile of mitochondrial retention in MCL cell lines treated with FCCP, KU60019 or both in combination, as in (A). (D) FCS analysis showing inhibition of ATM phosphorylation by KU60019 in MCL cell lines, as in (A). Cells treated with neocarzinostatin (NCS) (40 nM for 1 h) served as a positive control. Following treatments, cells were stained with PE-ATMSer1981 and FITC-H2AXSer139 (as in Figure 2B) and acquired by a FACSCalibur and analyzed with FlowJo software. (E) Immunoblot analysis (30 g total protein) of MCL cell lines treated with FCCP, KU60019 or their combination, as in (A), and probed with the indicated antibodies. NCS treatment served as a positive control for both ATMSer1981 and Kap1Ser824 activation. Total and phosphorylated bands were merged and are shown in color for specificity. Separate blots were cut into pieces and probed with the indicated antibodies. The levels of Parkin, phospho-UBSer65 Parkin and Pink1 protein expression were detected by electrochemoluminescence (ECL). GAPDH was probed as a loading control each time. (F) Densitometry analysis of mitophagy (Tom20 expression) in MCL cell lines treated with the indicated compounds. Assays with FCCP, KU60019 or both in combination (n=7 in Jeko-1 or n=5 in Mino cells) and NCS (n=5 in Jeko-1 and n=3 in Mino) were done. Data represent the mean ± SEM; *P<0.05, **P<0.01, ***P<0.001: significant differences from respective controls. (G) Immunoblot analysis (30 μg total protein) of WT HeLa cells treated with FCCP, KU60019 or their combination, as in (E), and probed with the indicated antibodies. NCS served as a positive control for both ATMSer1981 and Kap1Ser824 activation. Total and phosphorylated bands were merged and are shown in color for specificity. Separate blots were cut into pieces and probed with the indicated antibodies. The levels of Parkin, phospho-UBSer65 Parkin and Pink1 protein expression were detected by ECL. GAPDH was probed as a loading control each time. (H) Densitometry analysis of mitophagy (Tom20 expression) in WT HeLa cells treated with the indicated compounds, as in (F). Assays with FCCP, KU60019 or both in combination (n=6) and NCS (n=4) were performed. Data represent the mean ± SEM; *P<0.05: significant difference from the respective control. (I) Representative FCS analysis of irradiation (IR)-induced (5 Gray as in Figure 1G) ATMSer1981 and H2AXSer139 phosphorylation in B cells isolated from healthy donors (upper panel) or FCCP (75 M for 3 h)-induced mitophagy (as in Figure 1A; lower panel). (J) Representative FCS analysis showing IR and IR+ primary MCL lymphomas proficient or deficient in FCCP-induced mitophagy, respectively. (K) Line graph representation of the geometric mean of FCS analysis of mitochondrial retention in samples from four healthy donors (purified B cells in 3 cases and peripheral blood mononuclear cells in 1 case) or from 21 patients with primary MCL showing their individual IR status (IR+ n=13; IR n=8) and their response to FCCP-induced mitophagy. (L) Quantitative polymerase chain reaction (qRT-PCR) analysis (as in Figure 2I) of mitochondrial DNA (mtDNA) copy number in 20 primary MCL (IR+ n=12 and IR n=8) or control healthy donor B cells (n=3). WT DNA and Rho0-DNA served as positive and negative controls for mtDNA qRT-PCR analysis. Inset showing mean ± SEM; *P<0.05 significant difference from IR+ lymphomas. (M) Relative geometric mean of basal mitochondrial reactive oxygen species (mROS) levels (as in Figure 1D) in healthy donor B cells (n=3) or primary MCL (IR+ n=9 and IR n=5). (N) Line graph representation of the geometric mean of FCS analysis of mitochondrial membrane potential (m) following FCCP treatment of cells from four healthy donors (3 purified B cells in 3 cases and peripheral blood mononuclear cells in 1 case) and from 21 patients with primary MCL showing their IR status (IR+ n=13; IR n=8) and their response to FCCP-induced loss of m. *P<0.05, **P<0.01: significant differences from respective DMSO controls. (O) FCS analysis showing geometric means of mitochondrial mass following FCCP-induced mitophagy in cells from 21 patients with primary MCL and their respective t(11;14) status (positive n=18; negative n=3). (P) Immunoblot analysis showing FCCP-induced mitophagy in control B cells, MCL cell lines or six primary MCL cases (30 μg total protein), probed with the indicated antibodies. Corresponding IR- or FCCP-induced FCS analysis data are shown in the tables underneath. The levels of Parkin, phospho-UBSer65 Parkin and Pink1 protein expression were determined by an ECL method. Both actin and GAPDH were probed as loading controls. D: DMSO; F: FCCP; I: IR. (Q) Densitometry analysis of Parkin expression in purified B cells from healthy donors (n=3) or IR+ (n=22) and IR (n=8) lymphomas (including MCL, marginal zone lymphoma, diffuse large B-cell lymphoma and follicular lymphoma). Data represent mean ± SEM.

Similar articles

Cited by

References

    1. Brandon M, Baldi P, Wallace DC. Mitochondrial mutations in cancer. Oncogene. 2006;25(34):4647-4662. - PubMed
    1. Fulda S, Galluzzi L, Kroemer G. Targeting mitochondria for cancer therapy. Nat Rev Drug Discov. 2010;9(6):447-464. - PubMed
    1. Galluzzi L, Joza N, Tasdemir E, et al. No death without life: vital functions of apoptotic effectors. Cell Death Differ. 200815(7): 1113-1123. - PMC - PubMed
    1. Sabharwal SS, Schumacker PT. Mitochondrial ROS in cancer: initiators, amplifiers or an Achilles' heel? Nature Rev Cancer. 2014;14(11):709-721. - PMC - PubMed
    1. Vander Heiden MG, Cantley LC, et al. Understanding the Warburg effect: the metabolic requirements of cell proliferation. Science. 2009;324(5930):1029-1033. - PMC - PubMed

Publication types