. 2020 Feb 7;367(6478):643-652.
doi: 10.1126/science.aaw3242.

Mechanism of homodimeric cytokine receptor activation and dysregulation by oncogenic mutations

Affiliations

Mechanism of homodimeric cytokine receptor activation and dysregulation by oncogenic mutations

Stephan Wilmes et al. Science. .

Abstract

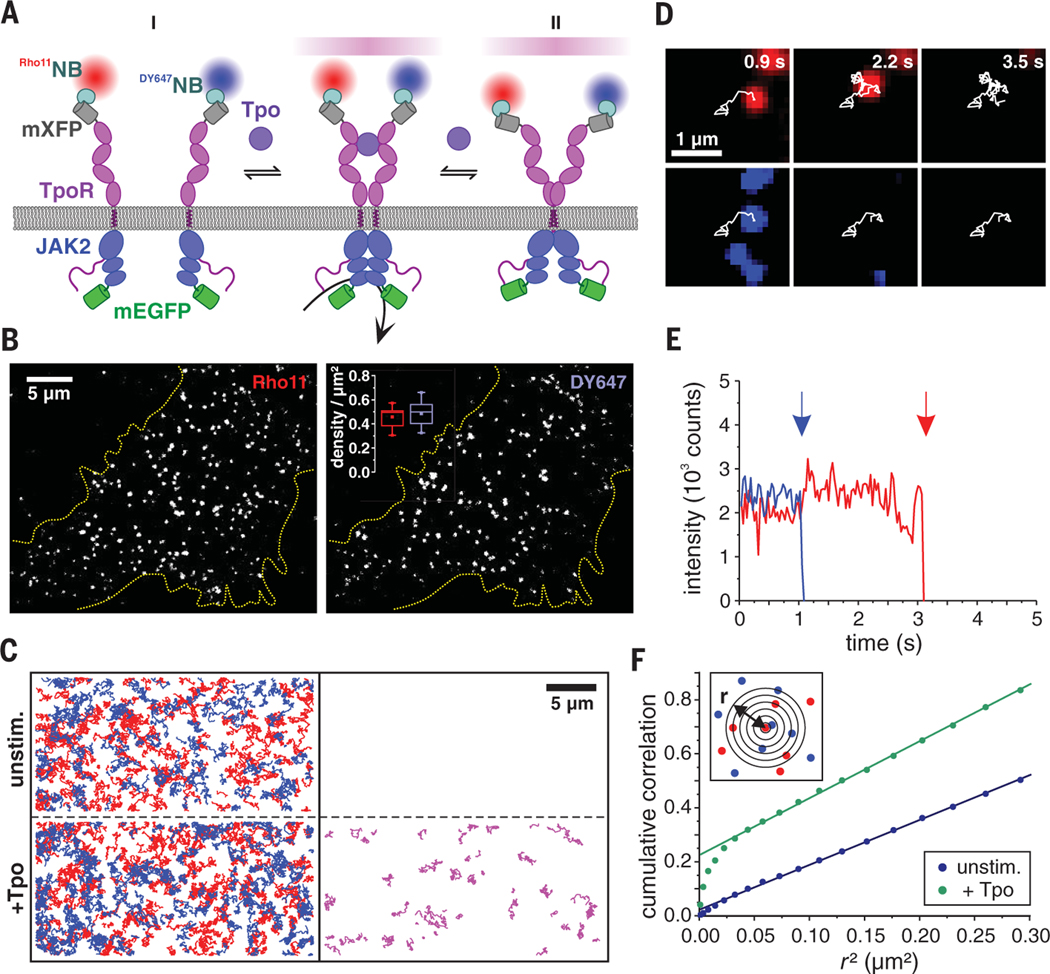
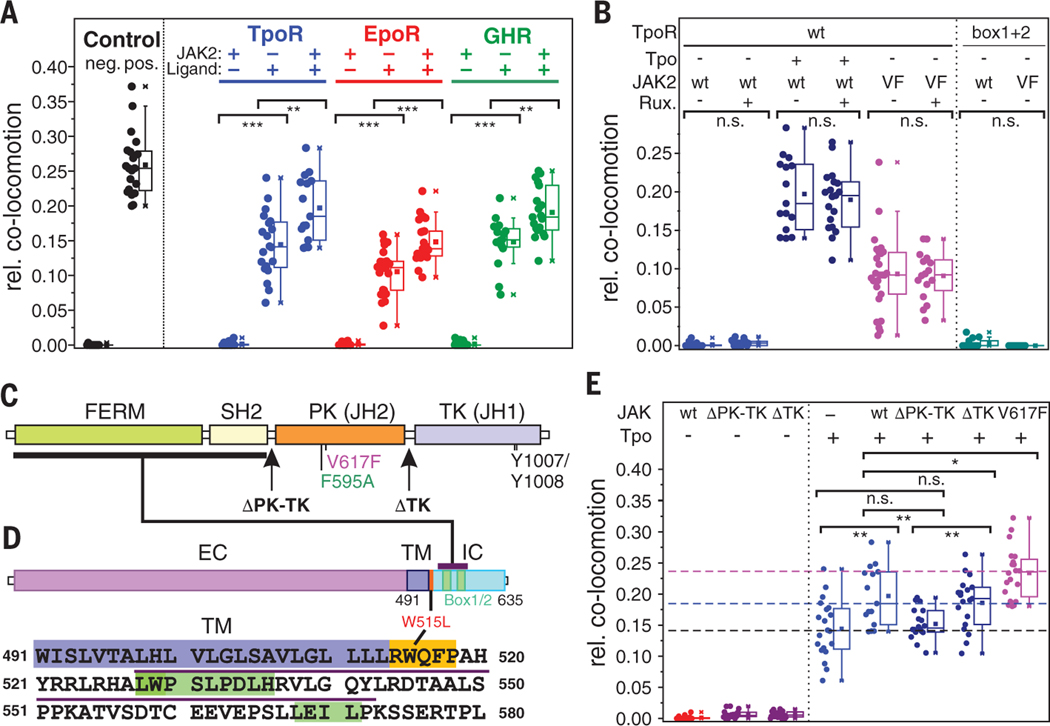
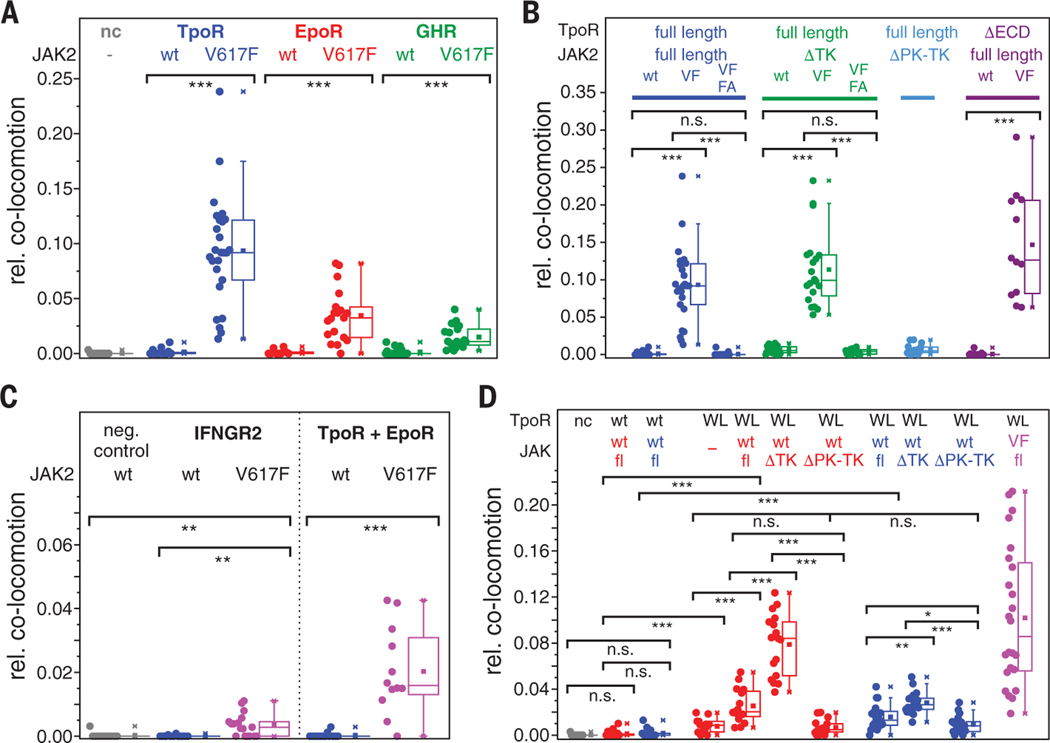
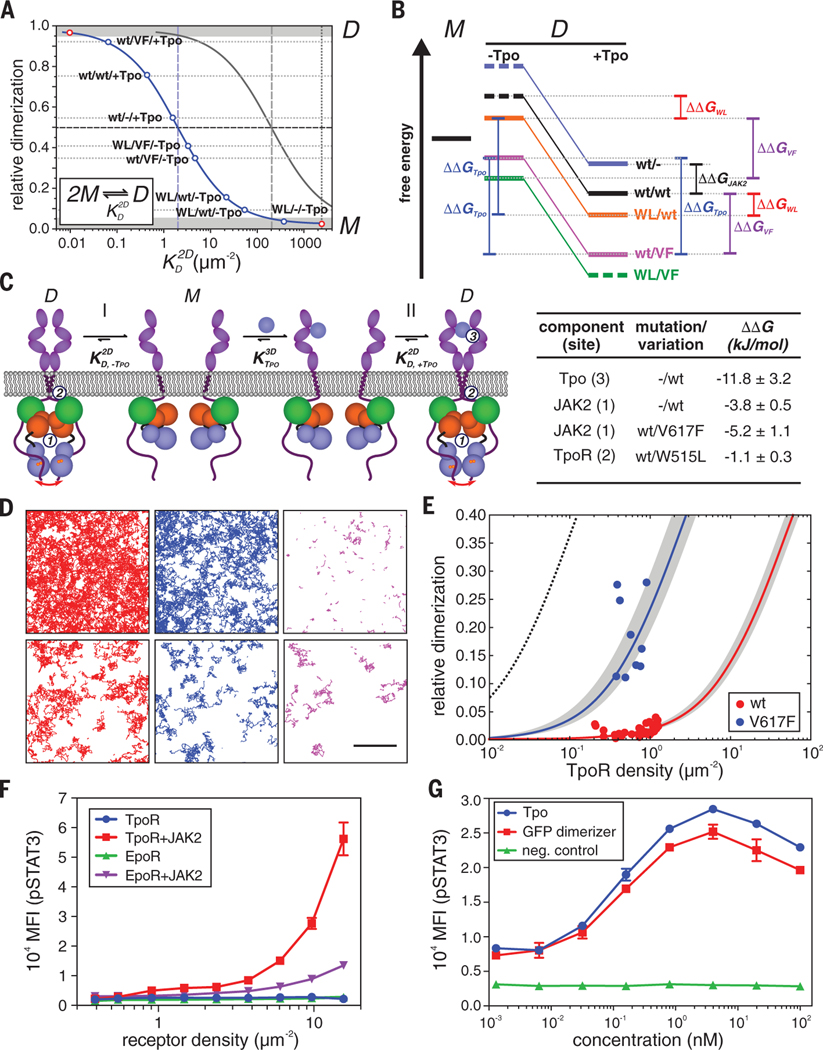
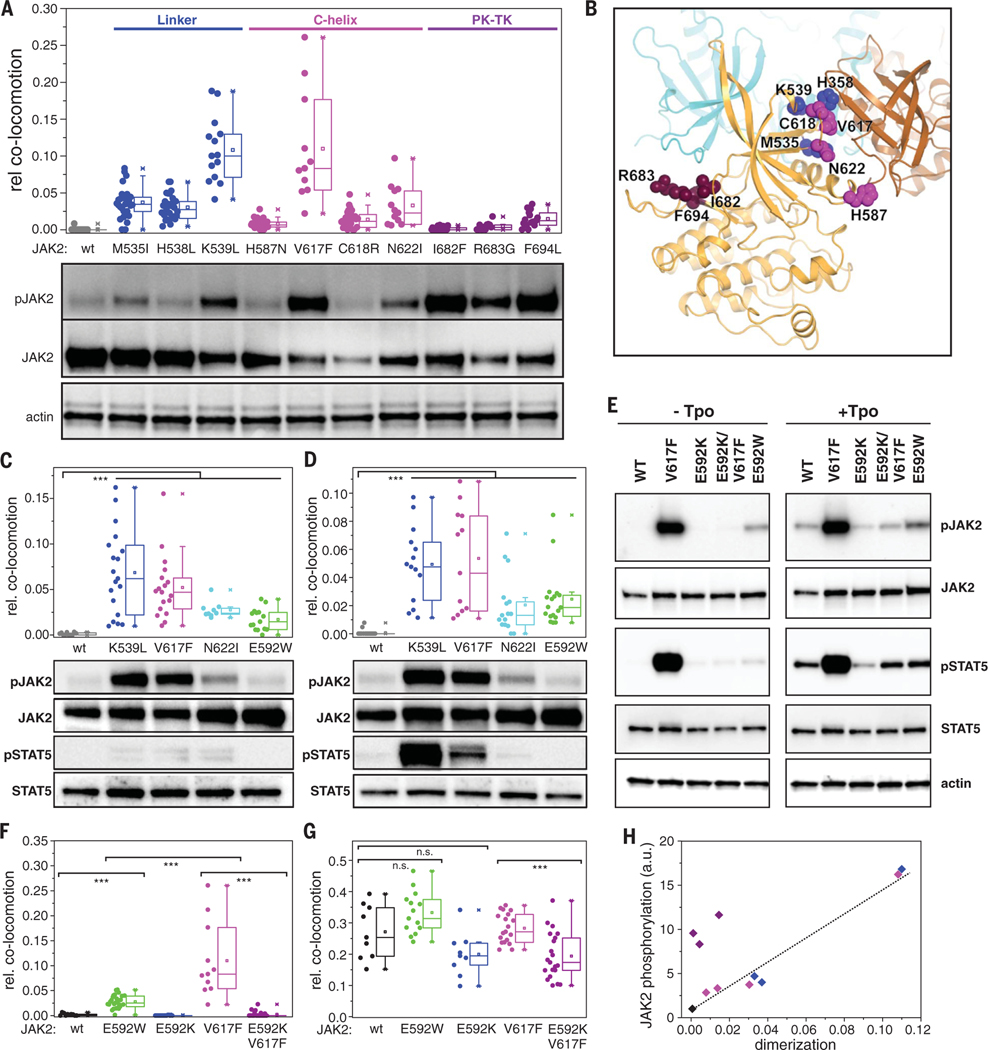
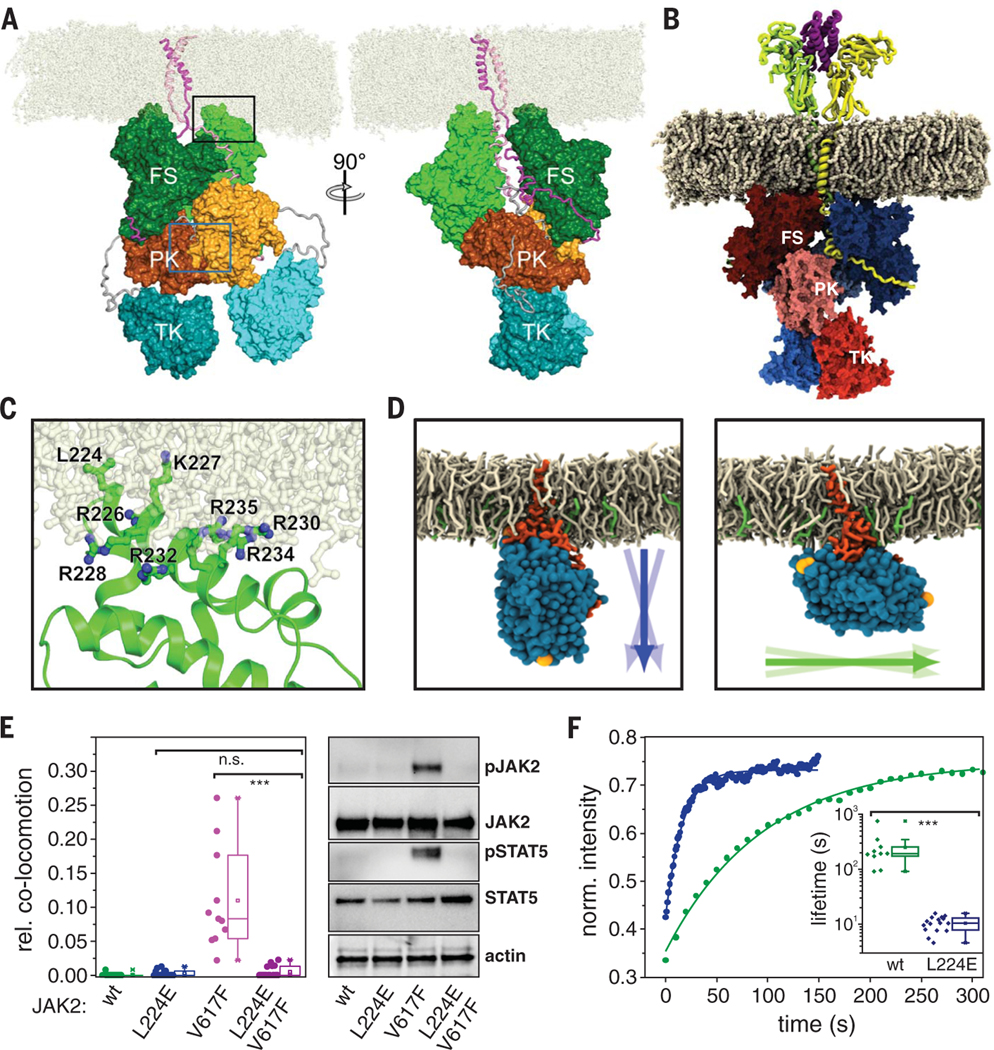
Homodimeric class I cytokine receptors are assumed to exist as preformed dimers that are activated by ligand-induced conformational changes. We quantified the dimerization of three prototypic class I cytokine receptors in the plasma membrane of living cells by single-molecule fluorescence microscopy. Spatial and spatiotemporal correlation of individual receptor subunits showed ligand-induced dimerization and revealed that the associated Janus kinase 2 (JAK2) dimerizes through its pseudokinase domain. Oncogenic receptor and hyperactive JAK2 mutants promoted ligand-independent dimerization, highlighting the formation of receptor dimers as the switch responsible for signal activation. Atomistic modeling and molecular dynamics simulations based on a detailed energetic analysis of the interactions involved in dimerization yielded a mechanistic blueprint for homodimeric class I cytokine receptor activation and its dysregulation by individual mutations.


Conflict of interest statement

Competing interests:

The authors declare no competing interests.

Figures

Fig. 1.
Fig. 1.. Receptor monomer-dimer equilibrium quantified by dual-color single-molecule imaging.
(A) Cytokine receptor activation by ligand-induced dimerization (I) versus ligand-induced conformational change of pre-formed dimers (II) schematically depicted for TpoR. Receptor subunits fused to mXFP were labeled with anti-GFP nanobodies (NB) conjugated to Rho11 (Rho11NB) and DY647 (Dy647NB) at equal concentrations. Receptor homodimers carrying both Rho11 and DY647 are identified by co-tracking analysis (stochastically only 50% of the entire dimer population). Coexpression of JAK2 wild-type and JAK2 variants fused to mEGFP ensures unambiguous detection at the single-cell level. (B) Individual mXFP-TpoR subunits in the plasma membrane of HeLa cells after labeling with Rho11NB and Dy647NB. The densities of molecules in each channel are depicted in the inset (calculated from 15 cells). In this and later figures, box plots indicate the data distribution of the second and third quartiles (box), median (line), mean (square), and 1.5× interquartile range (whiskers). (C) TpoR tracking and co-tracking analysis shown for representative cells. Left: Trajectories (150 frames, ~4.8 s) of individual Rho11-labeled (red) and DY647-labeled (blue) TpoR subunits before (top) and after (bottom) addition of Tpo. Right: Receptor dimers identified by co-locomotion analysis. (D and E) Single-step photobleaching observed for an individual TpoR dimer (red, Rho11; blue, Dy647) in the presence of Tpo (D) and intensity-time traces with bleaching events indicated by arrows (E). (F) Spatial correlation of TpoR at single-molecule level by PICCS as schematically indicated in the inset. Representative results for a cell in the absence (blue) and presence of Tpo (green), respectively, are shown.
Fig. 2.
Fig. 2.. JAK2 regulates ligand-induced dimerization of TpoR, EpoR, and GHR.
(A) Relative number of co-trajectories observed for positive and negative control proteins as well as for unstimulated TpoR, EpoR, and GHR and after stimulation with the respective ligand with and without coexpression of JAK2. (B) Comparison of dimerization levels in the absence and presence of the JAK2 inhibitor ruxolitinib (left) and dimerization levels of TpoR Box1+2 mutant (right) coexpressed with JAK2 wild-type (wt) or V617F (VF). (C) Primary structure of JAK2 comprising FERM-SH2 (FS), pseudokinase (PK), and tyrosine kinase (TK) domains. Positions of the C-terminal truncations ΔTK and ΔPK-TK as well as key residues and mutations are high-lighted. (D) Primary structure of TpoR including extracellular (EC), transmembrane (TM), and intracellular (IC) domains. The primary sequence of the TM domain (blue) followed by a functionally critical amphipathic motif (orange) and the intracellular domain (ICD) including the Box motifs (green) is shown below. The putative JAK2 binding sequence is indicated by a purple overline. Amino acid abbreviations: A, Ala; C, Cys; D, Asp; E, Glu; F, Phe; G, Gly; H, His; I, Ile; K, Lys; L, Leu; M, Met; N, Asn; P, Pro; Q, Gln; R, Arg; S, Ser; T, Thr; V, Val; W, Trp; Y, Tyr. (E) Ligand-induced dimerization of TpoR coexpressed with different JAK2 variants as identified in (C). Dashed lines mark the mean dimerization levels in the absence (black) and presence of JAK2 wt (blue) or JAK2 V617F (magenta), respectively. In (A), (B), and (E), each data point represents the analysis from one cell with a minimum of 10 cells measured for each condition. *P < 0.05, **P ≤ 0.01, ***P ≤ 0.001; n.s., not significant.
Fig. 3.
Fig. 3.. Oncogenic JAK2 and TpoR mutants drive ligand-independent receptor dimerization.
(A) Ligand-independent dimerization of TpoR, EpoR, and GHR by JAK2 V617F. Co-locomotion was quantified for TpoR, EpoR, and GHR coexpressed with either JAK2 or JAK2 V617F, compared to a negative control (nc). (B) Ligand-independent dimerization by JAK2 V617F is driven by the pseudokinase domain. Co-locomotion was analyzed for the indicated receptor and JAK2 variants. For ΔECD-TpoR, dimerization by JAK2 V617F was quantified by single-molecule FRET (see movie S7). (C) Homo- and heterodimerization of cytokine receptors by JAK2 V617F. Left: Homodimerization of IFNGR2. Right: Heterodimerization of EpoR and TpoR, which were orthogonally labeled via mXFP and SNAPf-tag, respectively (see movie S8). (D) Ligand-independent dimerization of TpoR W515L (WL) in the absence and presence of different JAK2 (red) and TYK2 (blue) variants and JAK2 V617F (VF, magenta). In (A) to (D), each data point represents the analysis from one cell with a minimum of 10 cells measured for each condition. *P < 0.05, **P ≤ 0.01, ***P ≤ 0.001.
Fig. 4.
Fig. 4.. Energy landscape of TpoR dimerization and its mechanistic interpretation.
(A) Determination of 2D equilibrium dissociation constants from the dimerization levels observed under different conditions. Each dot corresponds to a dimerization experiment where the label denotes TpoR [wt or W515L (WL)]/JAK2 [wt or V617F (VF)]/ligand (+/–Tpo). The 2D law of mass action is depicted for a monomer-dimer (M-D) equilibrium at a total receptor surface concentration of 2 μm–2 (blue) and 200 μm–2 (gray). Dimerization levels that cannot be unambiguously quantified by co-tracking are indicated by gray zones. (B) Semi-quantitative energy diagram of the M-D equilibrium in the absence (–Tpo) and presence (+Tpo) of ligand as derived from (A). Experiments involving different TpoR/JAK2 combinations are depicted in different colors; energy levels for determining different values of ΔΔG are indicated. Energetic contributions ΔΔG obtained for different combinations of components and mutations are listed in the table below. (C) Proposed mechanism of homodimeric cytokine receptor activation deduced from live-cell dimerization assays: In the absence of ligand (I), the basal level of dimerization caused by interactions mediated via the JAK2 PK domains (1) and TM/JM domains (2) is negligible because (KD2D) substantially exceeds the receptor surface concentration in the plasma membrane. Ligand binding provides the additional binding energy (3) required to shift the equilibrium toward the dimeric state. Oncogenic mutations enhancing interactions 1 or 2 shift the equilibrium toward the dimeric state in a ligand-independent manner (II). (D to F) Intrinsic dimerization and activation of TpoR and EpoR. (D) Representative smFRET experiments with TpoR coexpressed with JAK2-mEGFP wt (top) and V617F (bottom) showing single-molecule trajectories of the donor (red) as well as the acceptor upon direct excitation (blue) and via smFRET (magenta) detected within 150 frames (5 s). Total receptor densities were 1.2/μm2 for JAK2 wt and 0.4/μm2 for JAK2 V617F. Scale bar, 5 μm. (E) Relative ligand-independent dimerization levels as a function of receptor density for full-length TpoR in the presence of JAK2 wt and V617F and fit by the law of mass action for a monomer-dimer equilibrium (solid lines). Confidence intervals of the fit are indicated as gray zones. The dimerization curve in the presence of Tpo calculated from the corresponding (KD2D) is shown for comparison (black dotted line). (F) Ligand-independent activation of STAT3 phosphorylation upon overexpression of TpoR and EpoR, respectively, together with JAK2 wt in HeLa cells. pSTAT3 and receptor cell surface densities were quantified by phospho-flow analysis. As a negative control, coexpression of JAK2 was omitted. (G) Activation of mXFP-TpoR by dimerization with an NB-based cross-linker that binds the mXFP-tag. For comparison, activation by Tpo in the presence and absence of TpoR (neg. control) is shown. In (F) and (G), error bars denote SEM.
Fig. 5.
Fig. 5.. Dimerization interface of JAK2 PK domains.
(A) Ligand-independent dimerization of TpoR (top) and associated JAK2 phosphorylation (bottom) in the presence of oncogenic mutations within the JAK2 PK domain. Residues are grouped and colored according to their location within the PK structure: FS-PK linker (blue); αC helix (magenta), and PK-TK interface (purple). (B) Putative intermolecular PK-PK interface derived from the MD simulations, with one PK domain colored orange and the other brown. The positions of the residues mutated in (A) are mapped onto the orange PK domain. Superimposed in cyan is the TK domain in its autoinhibitory configuration (intramolecular) relative to the orange PK domain; the TK domain would clash with the second (brown) PK domain. (C and D) Ligand-independent dimerization of EpoR (C) and GHR (D) (top) and associated JAK2 phosphorylation (bottom) for selected constitutively active JAK2 mutants. (E to G) Altering dimerization and activation by perturbation of the putative PK-PK interface via mutagenesis of Glu592. (E) Activity of different JAK2 mutants in HeLa cells stably expressing mXFP-TpoR. Phosphorylation of JAK2 and STAT5 in the absence of ligand (left) and after stimulation with Tpo (right) was probed by Western blot. [(F) and (G)] Dimerization of TpoR associated with different JAK2 mutants in the absence (F) and presence (G) of Tpo. (H) Correlation of receptor dimerization with activation for constitutively active JAK2 mutants [same color coding as in (A)]. Error bars are omitted for clarity. In (A), (C), (D), (F), and (G), each data point represents the analysis from one cell with a minimum of nine cells measured for each condition. ***P ≤ 0.001.
Fig. 6.
Fig. 6.. Structural organization of homodimeric cytokine receptor signaling complexes in the membrane.
(A) Snapshot (t = 1 μs) from all-atom MD simulations of JAK2 bound to TpoR (TM and IC domains) forming a homodimeric complex (system S1AA; movie S11). JAK2 is colored green (FS), orange (PK), and cyan (TK). Protomer 1 is in dark colors with domains labeled; protomer 2 is in light colors and unlabeled. The FS-PK and PK-TK linkers are colored gray. TpoR is colored magenta (bound to JAK2 protomer 1) and pink (bound to JAK2 protomer 2). POPC lipid molecules are colored off-white. The PK-PK interface region highlighted by the green rectangle is shown in Fig. 5B. (B) Snapshot (t = 1 μs) from an all-atom MD simulation of a homodimeric complex of JAK2 bound to EpoR (residues Pro31 to Ser335, system S4AA) in the presence of Epo (movie S12). (C) Membrane binding of the F2 subdomain of FS stabilizes the orientation of JAK2 relative to the membrane [enlarged view of the region indicated by the black rectangle in (A)]. The side chains of Lys224 and the seven Lys and Arg residues in α3 that change orientation and flexibility upon interaction with the membrane are highlighted. (D to F) Functional role of Lys224 in TpoR dimerization and activation. (D) Representative orientation of JAK2 FS wt (left) and L224E (right) observed in MD simulations (systems S14CG and S16CG, respectively). Arrows indicate the orientation of the FS domain and its variation during the simulations. (E) Ligand-independent dimerization of TpoR (left) as well as JAK2 and STAT5 phosphorylation (right) observed for JAK2 wt and V617F upon combination with L224E. (F) Stability of JAK2 FS wt and L224E binding to TpoR probed by live-cell micropatterning (fig. S14C) in combination with FRAP. Representative FRAP curves are shown for JAK2 wt (green) and L224E (blue); the inset, using the same colors, shows a statistical analysis of dissociation rate constants. Each data point represents the analysis from one cell with a minimum of 10 cells measured for each condition. ***P ≤ 0.001.

References

    1. Atanasova M, Whitty A, Crit. Rev. Biochem. Mol. Biol 47, 502–530 (2012). - PMC - PubMed
    1. Cunningham BC et al., Science 254, 821–825 (1991). - PubMed
    1. Stroud RM, Wells JA, Sci. STKE 2004, re7 (2004). - PubMed
    1. Waters MJ, Brooks AJ, Biochem. J 466, 1–11 (2015). - PMC - PubMed
    1. Gent J, van Kerkhof P, Roza M, Bu G, Strous GJ, Proc. Natl. Acad. Sci. U.S.A 99, 9858–9863 (2002). - PMC - PubMed

Publication types

MeSH terms