. 2020 Feb 7;367(6478):694-699.
doi: 10.1126/science.aaw8653.

Valence and patterning of aromatic residues determine the phase behavior of prion-like domains

Affiliations

Valence and patterning of aromatic residues determine the phase behavior of prion-like domains

Erik W Martin et al. Science. .

Abstract

Prion-like domains (PLDs) can drive liquid-liquid phase separation (LLPS) in cells. Using an integrative biophysical approach that includes nuclear magnetic resonance spectroscopy, small-angle x-ray scattering, and multiscale simulations, we have uncovered sequence features that determine the overall phase behavior of PLDs. We show that the numbers (valence) of aromatic residues in PLDs determine the extent of temperature-dependent compaction of individual molecules in dilute solutions. The valence of aromatic residues also determines full binodals that quantify concentrations of PLDs within coexisting dilute and dense phases as a function of temperature. We also show that uniform patterning of aromatic residues is a sequence feature that promotes LLPS while inhibiting aggregation. Our findings lead to the development of a numerical stickers-and-spacers model that enables predictions of full binodals of PLDs from their sequences.


Conflict of interest statement

Competing interests: R.V. P. is a member of the Scientific Advisory Board of DewpointX. This work was not funded or influenced in any way by this affiliation. The authors declare no competing interests.

Figures

Figure 1:
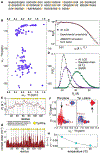
Figure 1:. Aromatic residues are the stickers in the PLD derived from hnRNPA1.
(A) The sequence of the PLD / LCD from hnRNPA1 (A1-LCD); aromatic residues are indicated in orange. (B) 1H-15N HSQC spectrum recorded at 800 MHz and 25 °C in pH 6 MES buffer. For assignments see Fig. S2A. (C) SEC-SAXS data for A1-LCD. Calculated scattering profiles from simulated ensembles are overlaid in red. (D) Rg distribution from all-atom simulations of A1-LCD (black) vs. Gaussian chain (violet) and self-avoiding random coil (green) reference states. (E) 15N amide transverse (R2) relaxation rates recorded at 800 MHz and 25 °C. Overlaid are fits to the data assuming a pure Gaussian-like profile (blue dashed line) or multiple regions of enhanced relaxation centered at aromatic residues (black dashed line) and the underlying Gaussian like profile from this fit (gray long dashed line) with a persistence length of 7.8 amino acid residues. The yellow circles indicate the positions of the aromatic residues. Grey bars indicate positions for which data were not analyzed due to unresolvable overlap in 2D spectra. Monte Carlo sampling of the location of group centers shows a clear positive correlation between the quality of fit and positions of aromatic amino acids within the sequence (Fig. S5A). (F) 13C-1H planes from the aromatic-edited 3D NOESY recorded at 800 MHz and 25 °C. Planes correspond to the Phe 1Hδ/ε/ξ (left) and Tyr 1Hε (right) frequencies and their corresponding diagonal signals are indicated by arrows. In both planes, red boxes show signals at Tyr 1Hδ / 1Hε (left) and Phe (right) which exist in this plane only due to NOE transfer. The 1H,13C-HSQC aromatic region is shown superimposed. (For NOEs in a A1-LCD variant with uniformly spaced aromatic residues (AroPerfect), see Fig. S5E,F.) (G) Contact order from simulations. The dashed lines and yellow circles indicate the positions of all aromatic amino acids. (H) Normalized intensity of Tyr – Phe NOEs as a function of temperature. The Tyr 1Hε – Phe NOE is displayed normalized to the Tyr 1Hδ – 1Hε NOE of fixed distance at 5, 15 and 25 °C. The dashed line is a power law fit.
Figure 2:
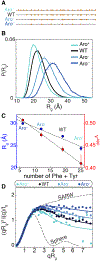
Figure 2:. Sticker valence directly determines the single chain behavior of the A1-LCD.
(A) Schematic showing position of aromatic residues indicated as circles, where orange and white reflect the presence and absence of aromatic residues, respectively. (B) The Rg distributions from all-atom simulations of A1-LCD variants. (C) Values of Rg (blue) and vapp (red) derived from the MFF fits in (D). Dashed lines are the lines of best fit through the four points. (D) Raw SEC-SAXS data in normalized Kratky representation (logarithmically smoothed into 60 bins). Solid lines are fits to an empirical MFF (30). The MFFs for a self-avoiding random walk (SARW) and a solid sphere are overlaid as dashed lines.
Figure 3:
Figure 3:. Sticker valence directly determines the phase behavior of the A1-LCD.
(A) Schematic representation of the stickers-and-spacers model. (B) Correlation between Rg from coarse-grained stickers-and-spacers simulations with values obtained from SEC-SAXS. Error bars are shown if greater than marker size. (C) Overlaid DIC and fluorescence images of LCD droplets fusing over the course of 20 seconds (see Movie S5) (top). The scalebar represents 50 μm. Snapshots from lattice-based stickers-and-spacers simulations (bottom). (D) Amplitude-normalized FCS curves for WT A1-LCD prior to phase separation (orange), and in the dilute (red) and dense (green) phases. (E) Complete binodal for the WT A1-LCD computed from the lattice-based stickers-and-spacers simulations (circles) and three different types of experiments, centrifugation followed by UV absorbance (triangles), cloud point (inverted triangles) and FCS / fluorescence intensity (squares) (see Fig. S11B,C, Fig. S12). The solid line is a fit from Flory-Huggins theory to the UV absorbance data. (F) Complete binodals as presented in (E) for the Aro+, WT (shown in E), and Aro. For Aro−−, the binodal is from simulations that use the lattice-based stickers-and-spacers model (solid circles) and fits based on Flory-Huggins theory to simulation results. (G) The correlation between the experimentally reported saturation concentrations and those calculated by stickers-and-spacers simulations for WT and 3 FUS variants with deleted ‘RAC’s. (37).
Figure 4:
Figure 4:. Linear patterning of stickers vs. spacers determines the ability of LCDs to undergo LLPS vs. aggregation.
(A) The aromatic residues in the WT A1-LCD are more uniformly distributed than 99.99% of sequence variants with the same composition as quantified by a mixing parameter Ωaro. The positions of the AroPerfect, WT and AroPatchy LCDs are indicated by arrows on the distribution. (B) A schematic showing the positions of aromatic amino acids as orange circles in the AroPerfect, WT and AroPatchy LCDs. (C) Snapshots from stickers-and-spacers simulations of AroPerfect, WT and AroPatchy LCDs. The AroPatchy LCD (top) forms amorphous structures (top) while AroPerfect and WT both form spherical droplets (bottom). Stickers are orange and spacers are either gray (bottom) or transparent (top). (D) Overlaid DIC and fluorescence images of AroPerfect, WT and AroPatchy LCDs at identical concentrations and solution conditions. The scalebar represents 50 μm. (E) Functional annotation of proteins with PLDs that have similarly well-mixed distributions of aromatic residues.

References

    1. Franzmann TM et al., Science 359, (2018). - PubMed
    1. Riback JA et al., Cell 168, 1028 (2017). - PMC - PubMed
    1. Molliex A et al., Cell 163, 123 (2015). - PMC - PubMed
    1. Wang A et al., EMBO J 37, (2018).
    1. Woodruff JB, Journal of Molecular Biology, (2018).

Publication types