. 2020 Mar 27;367(6485):1468-1473.
doi: 10.1126/science.aay0939. Epub 2020 Feb 6.

Deregulation of ribosomal protein expression and translation promotes breast cancer metastasis

Affiliations

Deregulation of ribosomal protein expression and translation promotes breast cancer metastasis

Richard Y Ebright et al. Science. .

Abstract

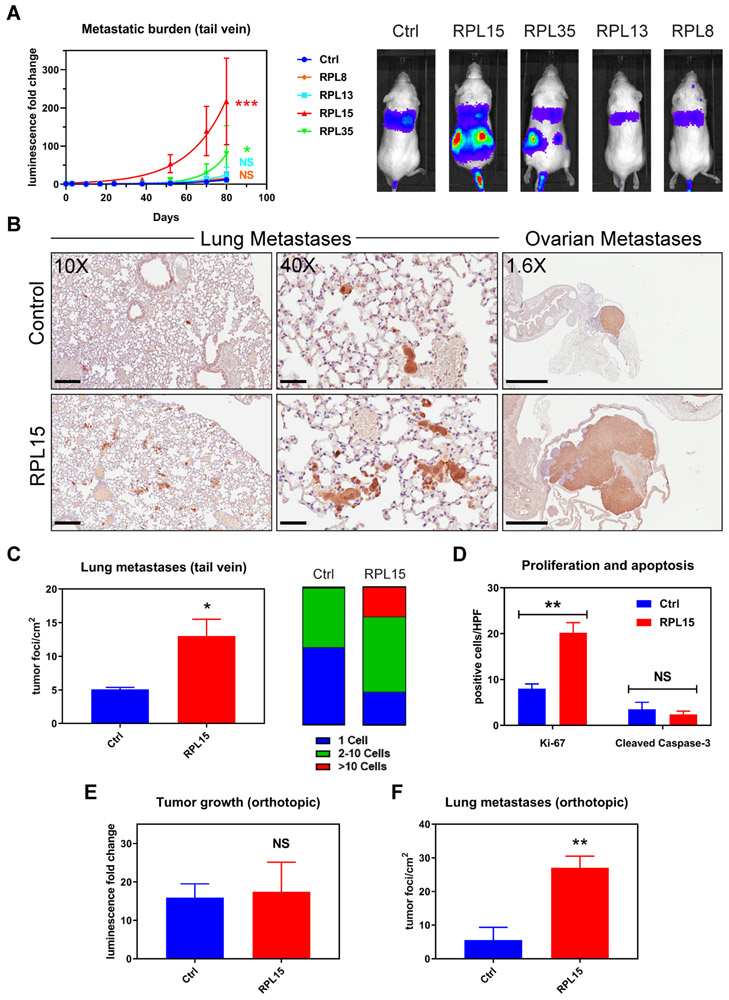
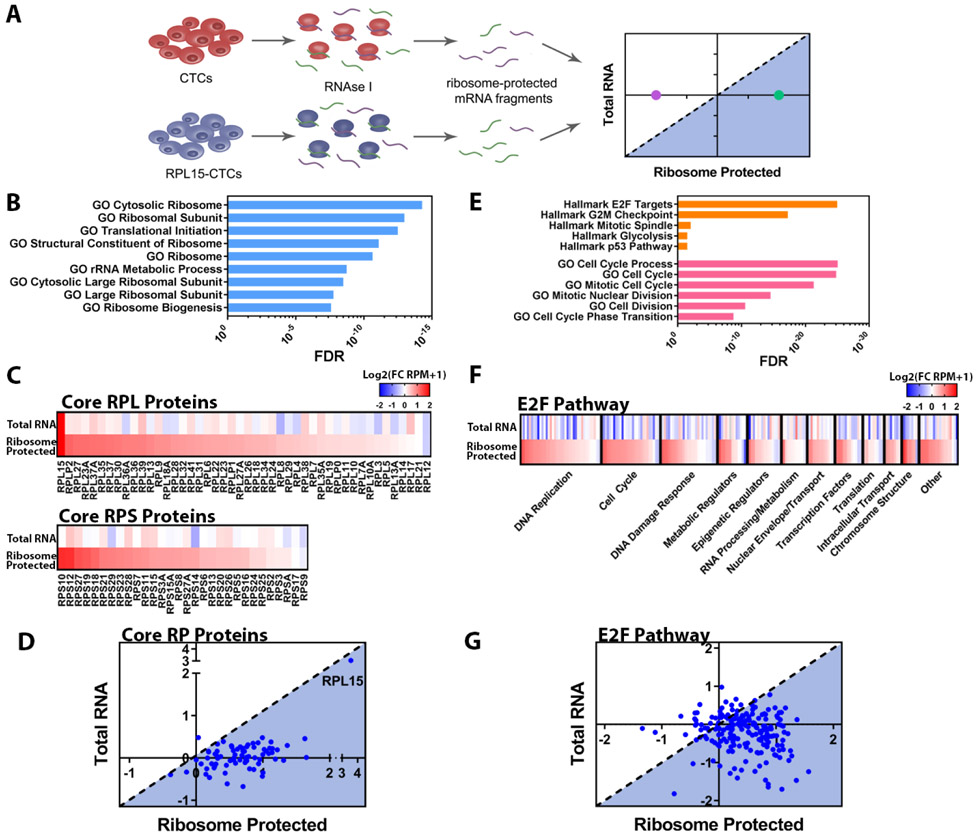
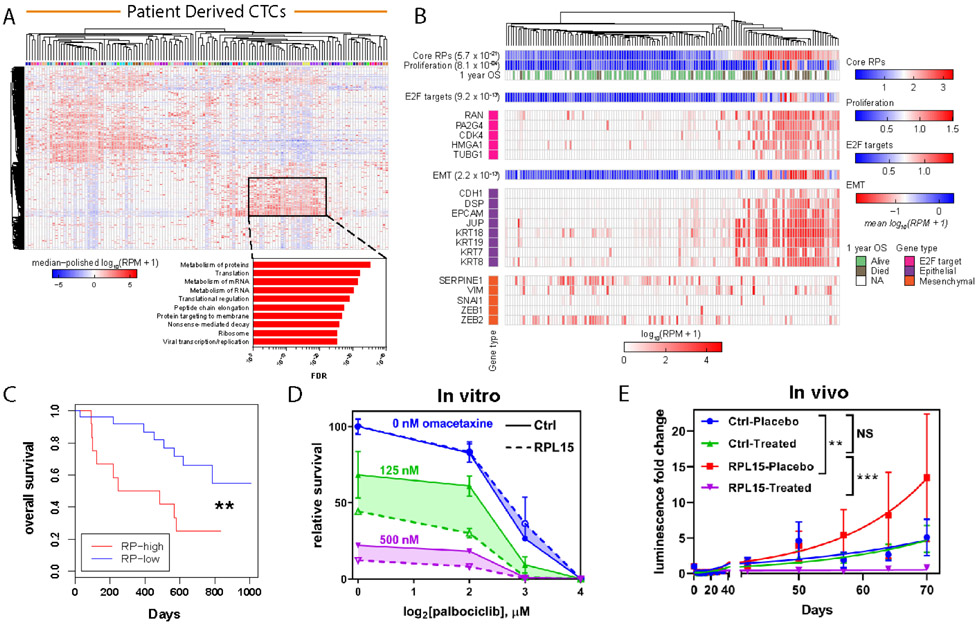
Circulating tumor cells (CTCs) are shed into the bloodstream from primary tumors, but only a small subset of these cells generates metastases. We conducted an in vivo genome-wide CRISPR activation screen in CTCs from breast cancer patients to identify genes that promote distant metastasis in mice. Genes coding for ribosomal proteins and regulators of translation were enriched in this screen. Overexpression of RPL15, which encodes a component of the large ribosomal subunit, increased metastatic growth in multiple organs and selectively enhanced translation of other ribosomal proteins and cell cycle regulators. RNA sequencing of freshly isolated CTCs from breast cancer patients revealed a subset with strong ribosome and protein synthesis signatures; these CTCs expressed proliferation and epithelial markers and correlated with poor clinical outcome. Therapies targeting this aggressive subset of CTCs may merit exploration as potential suppressors of metastatic progression.


Conflict of interest statement

Competing interests:

D.T.T., M.T., D.A.H., and S.M. are founders of and own equity in TellBio, Inc., which is involved with CTC therapeutics and diagnostic. At this time there has been no funding received or license that has been given to TellBio, Inc. for this work. D.T.T. is also a founder and owns equity ROME Therapeutics and PanTher Therapeutics, which is not related to this work. D.T.T. has received consulting fees from Merrimack Pharmaceuticals, Ventana Roche, Foundation Medicine, Inc., and EMD Millipore Sigma, which are not related to this work. D.T.T.’s interests were reviewed and are managed by Massachusetts General Hospital and Partners Healthcare in accordance with their conflict of interest policies. The other authors declare no competing interests.

Figures

Fig. 1
Fig. 1. In vivo genome-wide CRISPR activation screen.
(A) Left panel: Whole body bioluminescence monitoring of NSG mice injected via tail vein with GFP-luciferase tagged CTC lines or MDA-MB-231-LM2 cells (n = 3 mice per cell line). Right panel: Representative images of the bioluminescent signal at day 22 and corresponding lung histologic sections stained with anti-GFP to identify tumor cells. Scale bar: 100μm. (B) Diagram of in vivo CRISPR activation screening in CTCs. (C) Classification of known functions of the top 250 genes identified in the combined screen ranking. (D) Distribution of combined screen scores, demonstrating that only the top few hundred genes are enriched. Top genes related to translation are highlighted. (E) Crystal structure of the large and small subunits of the eukaryotic ribosome (11) highlighting the locations of RPL13, RPL15, and RPL35 as well as direct RPL13:RPL35 and RPL15:RPL35 interactions. Ribosome structural features indicated include the central protuberance (CP), exit channel and L1 stalk.
Fig. 2
Fig. 2. Validation of pro-metastatic effect of RPL15 overexpression.
(A) Left panel: Whole body luminescence monitoring of NSG mice injected via tail vein with CTCs overexpressing RPL8, RPL13, RPL15, or RPL35 (n = 4 mice per group). Curve fit by least squares method. P values calculated by the extra sum-of-squares F test. Right panel: Representative images of the bioluminescent signal one month after injection. (B) Representative sections of lung (left and middle panels) and ovarian (right panel) histology after staining with anti-GFP antibody (brown) and counter-stained with hematoxylin. Average long axis diameter of ovarian metastases in mice injected with RPL15-CTCs vs control: 9.1mm vs 2.4 mm respectively. Scale bars: Left panel 200μm; Middle panel 50μm; Right panel 2mm. (C) Quantitation of the number and size of tumor foci per cm2 identified by anti-GFP staining of lung histologic sections from mice injected with RPL15-CTCs or control. (D) Quantitation of the number of cells positive for Ki-67 or cleaved caspase-3 per high powered field by immunohistochemical staining of ovarian histologic sections. (E) Fold change in tumor bioluminescence after mammary fat pad injections of RPL15-CTCs or control at the terminal time point of day 78 (n = 4 mice per group, 2 tumors per mouse). (F) Quantitation of the number of tumor foci per cm2 identified by anti-GFP staining of lung histologic sections from mice after orthotopic injection of RPL15-CTCs or control. Error bars represent SEM. P values calculated by two-tailed unpaired Student’s t test. ***: p<0.001, **: p<0.01 *: p<0.05, NS: p>0.05.
Fig. 3
Fig. 3. RPL15 overexpression promotes translation of core ribosomal proteins and E2F pathway proteins.
(A) Schema illustrating ribosome profiling of control CTCs or RPL15-CTCs. (B) Gene Set Enrichment Analysis of transcripts preferentially bound by ribosomes in RPL15-CTCs. The most enriched ribosomal/translational GO gene sets and associated FDR values are shown. (C) Heat map representing the fold change of RPL15-CTCs relative to control for each RP gene for total RNA sequencing and ribosome profiling. Upper panel represents RPL proteins and lower panel represents RPS proteins. (D) Scatter plot representing the translational efficiency of individual RP gene transcripts. The y-axis represents the log2(fold change in RNA-seq), and the x-axis represents the log2(fold change in ribosome profiling). The shaded region represents transcripts that have increased translational efficiency relative to the level of the transcript. (E) Gene Set Enrichment Analysis of transcripts preferentially bound by ribosomes in RPL15-CTCs. The most enriched Hallmarks of Cancer gene sets from the Broad Molecular Signatures Database and most enriched cell cycle related Gene Ontology (GO) gene sets, and associated FDR values are shown. (F) Heat map representing fold change of RPL15-CTCs relative to control for each gene within the Hallmark E2F Targets gene set for total RNA sequencing and ribosome profiling. Genes were categorized according to their function and ordered based on the fold change in the ribosome profiling. (G) Scatter plot representing the translational efficiency of individual transcripts within the Hallmark E2F Targets gene set. The y-axis represents the log2(fold change in RNA-seq), and the x-axis represents the log2(fold change in ribosome profiling). The shaded region represents transcripts that have increased translational efficiency relative to the level of the transcript. Ribosome profiling was performed in duplicate.
Fig. 4
Fig. 4. Heterogeneity of RP expression in primary patient CTCs correlates with worse clinical outcome and sensitivity to translational and cell cycle inhibition:
(A) Upper panel: RNA-seq from CTCs enriched from whole blood with the iChip microfluidic device and isolated as single cells or clusters. Expression values represent log10(RPM+1), and the dataset was median polished. Dendrogram represents unsupervised clustering of the 2000 most variant genes within the dataset. Color bar identifies individual patients. Highlighted box represents a subset of CTCs with coordinately expressed RP genes. Lower panel: GSEA for KEGG and Reactome gene sets of the genes found in the highlighted box. (B) Heat map of the expression level of selected E2F target genes, epithelial markers and mesenchymal markers. Dendrogram represents supervised clustering of the CTC samples based on RP gene expression. OS bar indicates whether patient was alive one year after CTC sample collection. Color bar illustrates metagene analysis of core RPs, a proliferation signature, E2F targets, and an EMT signature and associated p values. (C) Kaplan-Meier analysis of the overall survival for patients with high average RP gene expression versus low average RP gene expression. The RP-high and RP-low subgroups were determined based on average RP gene expression for each patient blood draw. P value calculated by log rank test. (D) Dose response curves for RPL15-CTCs and control treated with increasing doses of palbociclib and omacetaxine. Shaded region represents the difference between RPL15-CTCs and control across tested concentrations of palbociclib. (E) Whole body luminescence monitoring of NSG mice after intracardiac injection with RPL15-CTCs or control and treatment with placebo or a combination of palbociclib and omacetaxine (n = 4-5 mice per condition). Error bars represent SEM. Curve fit by least squares method. P values calculated by the extra sum-of-squares F test. ***: p<0.001, **: p<0.01, NS: p>0.05.

Comment in

  • Deciphering cancer clues from blood.
    Ma N, Jeffrey SS. Ma N, et al. Science. 2020 Mar 27;367(6485):1424-1425. doi: 10.1126/science.abb0736. Science. 2020. PMID: 32217712 No abstract available.

References

    1. Gomis RR, Gawrzak S, Tumor cell dormancy. Mol Oncol 11, 62–78 (2017). - PMC - PubMed
    1. Micalizzi DS, Maheswaran S, Haber DA, A conduit to metastasis: circulating tumor cell biology. Genes Dev 31, 1827–1840 (2017). - PMC - PubMed
    1. Pan H et al., 20-Year Risks of Breast-Cancer Recurrence after Stopping Endocrine Therapy at 5 Years. N Engl J Med 377, 1836–1846 (2017). - PMC - PubMed
    1. Ozkumur E et al., Inertial focusing for tumor antigen-dependent and -independent sorting of rare circulating tumor cells. Sci Transl Med 5, 179ra147 (2013). - PMC - PubMed
    1. Karabacak NM et al., Microfluidic, marker-free isolation of circulating tumor cells from blood samples. Nat Protoc 9, 694–710 (2014). - PMC - PubMed

Publication types

Substances