. 2020 Feb 6;11(1):745.
doi: 10.1038/s41467-020-14421-x.

Therapeutic senescence via GPCR activation in synovial fibroblasts facilitates resolution of arthritis

Affiliations

Therapeutic senescence via GPCR activation in synovial fibroblasts facilitates resolution of arthritis

Trinidad Montero-Melendez et al. Nat Commun. .

Abstract

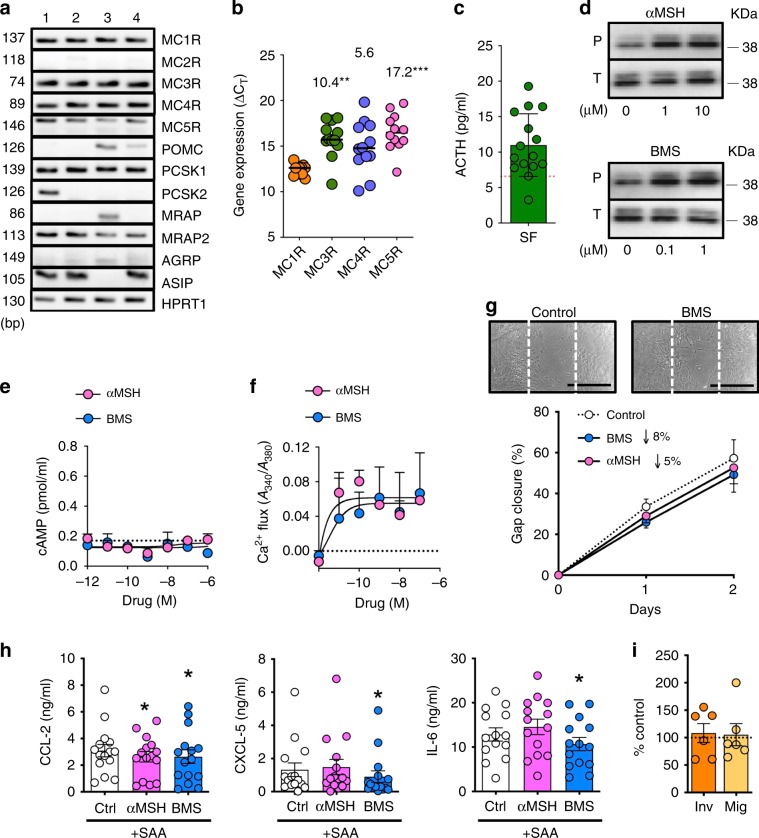
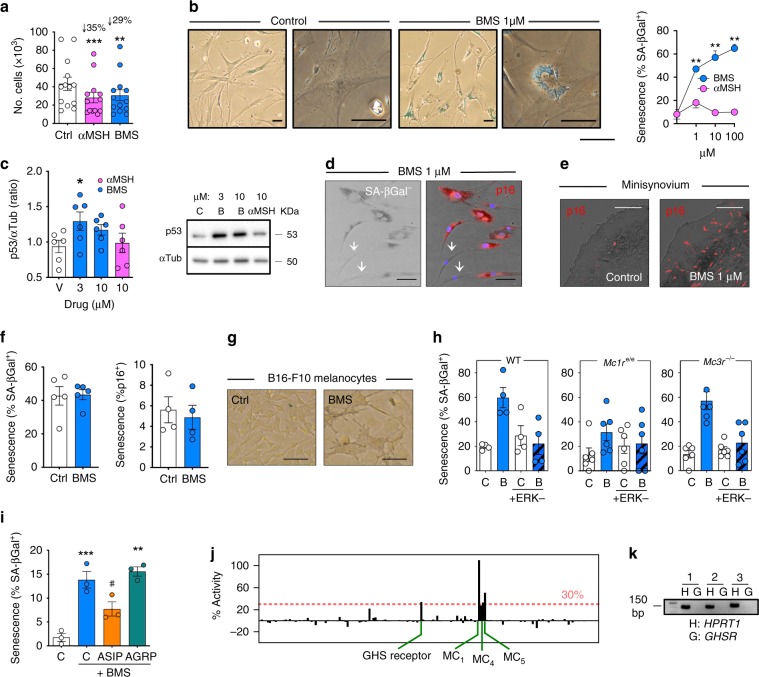
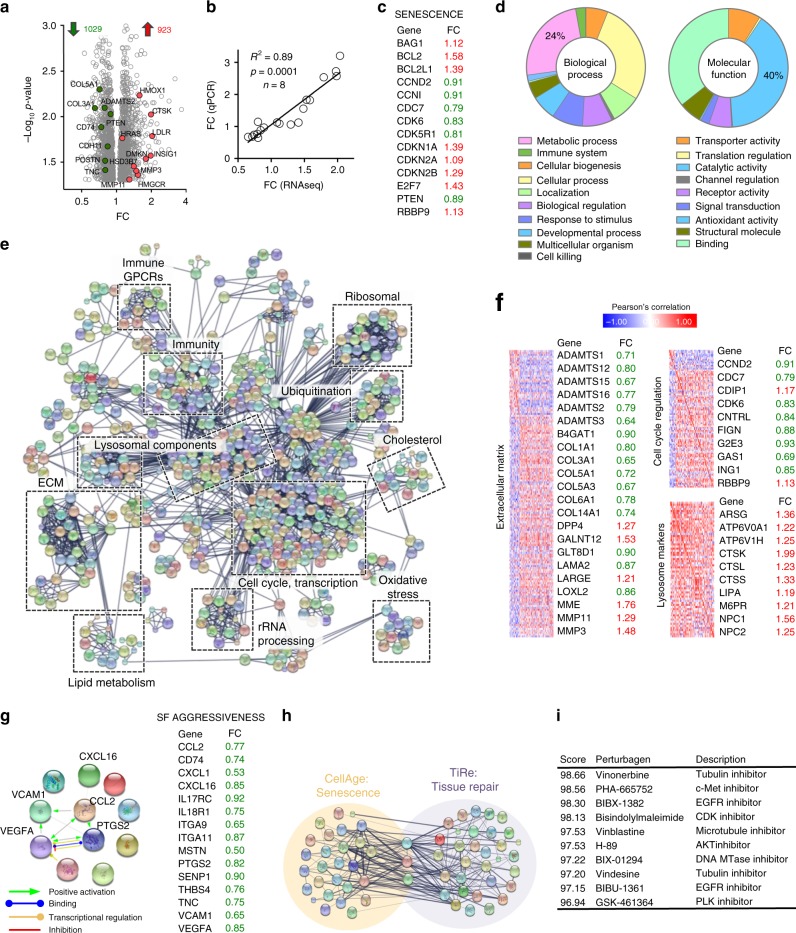
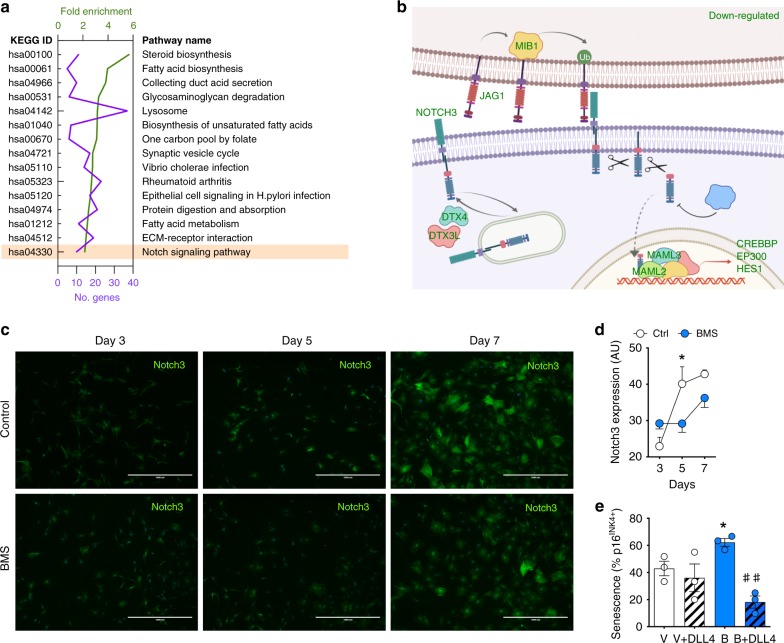
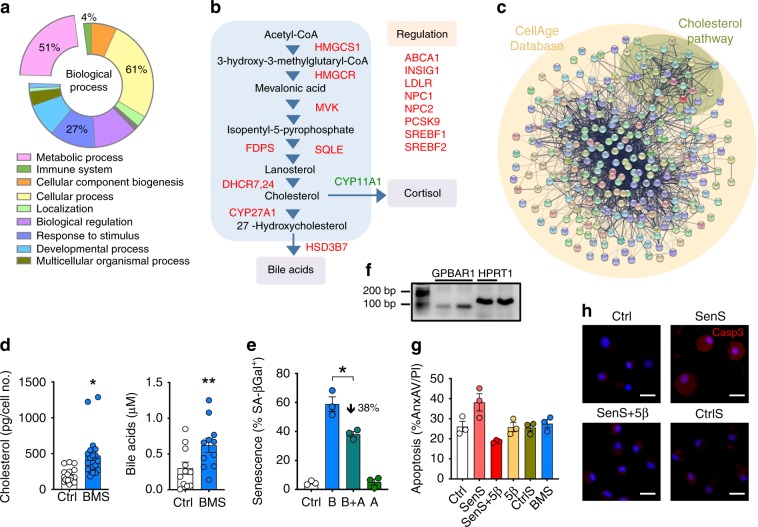
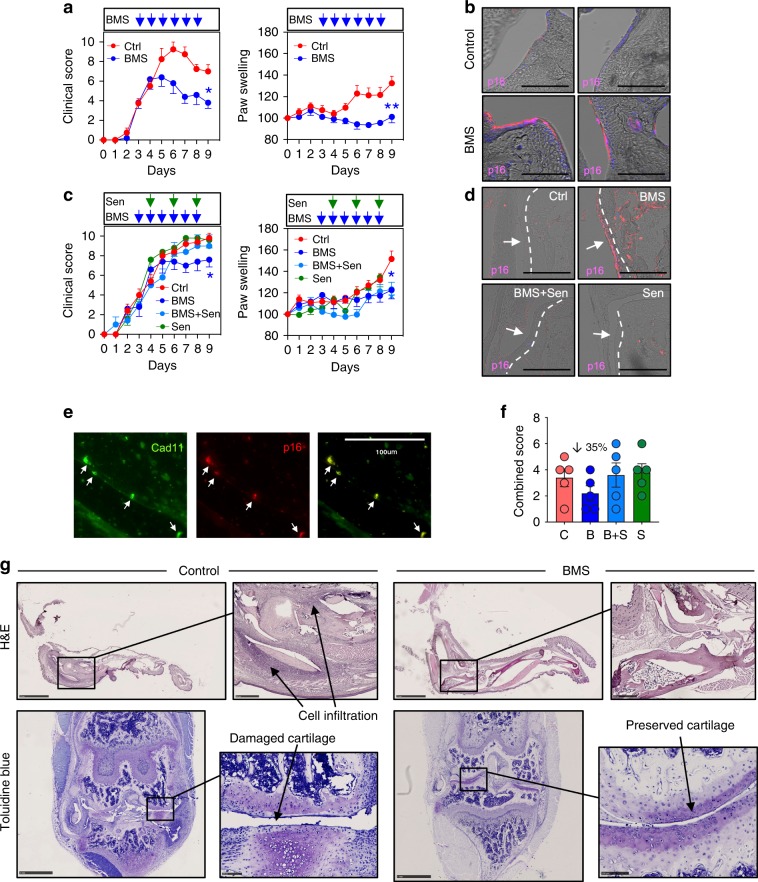
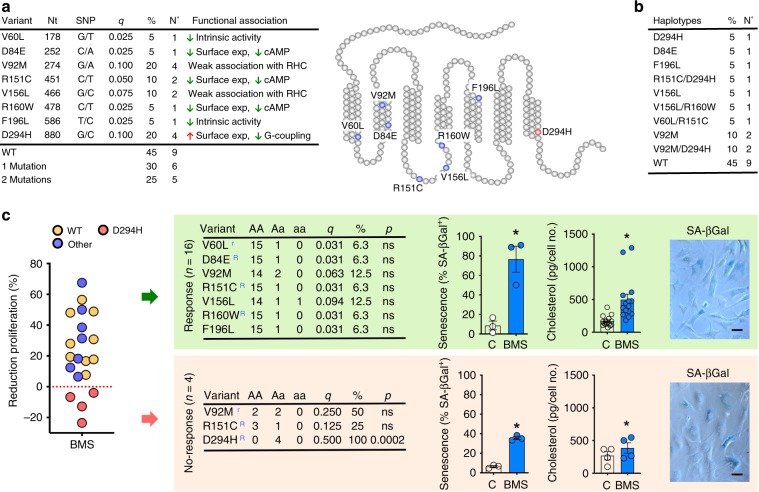
Rheumatoid arthritis affects individuals commonly during the most productive years of adulthood. Poor response rates and high costs associated with treatment mandate the search for new therapies. Here we show that targeting a specific G-protein coupled receptor promotes senescence in synovial fibroblasts, enabling amelioration of joint inflammation. Following activation of the melanocortin type 1 receptor (MC1), synovial fibroblasts acquire a senescence phenotype characterized by arrested proliferation, metabolic re-programming and marked gene alteration resembling the remodeling phase of wound healing, with increased matrix metalloproteinase expression and reduced collagen production. This biological response is attained by selective agonism of MC1, not shared by non-selective ligands, and dependent on downstream ERK1/2 phosphorylation. In vivo, activation of MC1 leads to anti-arthritic effects associated with induction of senescence in the synovial tissue and cartilage protection. Altogether, selective activation of MC1 is a viable strategy to induce cellular senescence, affording a distinct way to control joint inflammation and arthritis.


Conflict of interest statement

The authors declare no competing interests.

Figures

Fig. 1
Fig. 1. The Melanocortin (MC) system in synovial fibroblasts.
a Expression of several components of the MC pathway in RA SF fibroblasts as determined by end-point PCR using 1 μg of RNA (n = 4). b MCRs expression was further analyzed by real-time PCR using 1 μg of RNA. Cycle threshold (CT) values normalized against the reference control HPRT1 are shown (lower CT values denote higher expression). Numbers above bars indicate overexpression of MC1R compared to the other receptors calculated as 2−ΔΔCt. Data represent mean values, min to max range (n = 12, one-way ANOVA, Dunn’s correction; **p < 0.01; ***p = 0.001). c ACTH quantification in supernatants on SF cultured for 7 days without media replacement. Data are mean ± SD (n = 15). Dotted line represents values quantified in media without incubation with SF cells, serving as a negative control. d ERK-phosphorylation as analyzed by western blotting after 5 min stimulation of SF with MC agonists at the indicated concentrations. e Intracellular cAMP accumulation was quantified by EIA after 15 min SF cell stimulation with BMS or αMSH. The adenylyl cyclase activator forskolin (3 μM) was used as a positive control, yielding 0.58 pmol/ml. Data are mean ± SE (n = 3). f Ca2+ mobilization in SF upon addition of αMSH or BMS (from 1 μM then serially diluted up to 10 pM), and recorded for 86 s. Ionomycin (1 μM) was used as a positive control, yielding 0.15 units of absorbance ratio at 340/380 nm. Data are mean ± SE (n = 3). g In vitro wound healing assay conducted using ibidi® chambers on SF cells stimulated with 10 μM αMSH and 1 μM BMS. Representative images show gap closure. Scale bars indicate 100 μm. Data are mean ± SE (n = 6, two-way ANOVA). h Cytokines release from SF stimulated with SAA at 10 μg/ml and treated with αMSH (30 μM) or BMS (10 μM) for 24 h, determined by ELISA. Data are mean ± SE (n = 15, one-way ANOVA vs. control; *p < 0.05). i Transwell® inserts were used for SF migration (Mig) and invasion assays on Matrigel®-coated wells (Inv). Cells were treated overnight with 10 μM BMS. Data are mean ± SE (n = 6, Student’s t-test vs. control). Source data are provided as Source Data file.
Fig. 2
Fig. 2. Cellular senescence induced by selective MC1 agonism.
a SF cells were treated for 7 days with 10 μM αMSH or 1 μM BMS and proliferation assessed by cell counting. Data are mean ± SE (n = 13, Student’s t-test vs. control; **p < 0.01, ***p < 0.001). b Cells were treated with BMS or αMSH for 7 days and SA-βGal+ cells quantified. Scale bars indicate 100 μm. Data are mean ± SE (n = 2, two-way ANOVA; **p < 0.01). c p53 protein levels were analyzed by western blot after 7-day treatment of SF cells with 3 or 10 μM BMS (B) or 10 μM αMSH and bands quantified (fold change with respect to vehicle). Data are mean ± SE (n = 6, Student’s t-test vs. control, C; *p < 0.05). d Immunofluorescence for p16INK4 in SF cells treated with 1 μM BMS was performed on SA-βGal-stained cells to determine their association. Scale bars indicate 200 μm. e SF cells were grown on Matrigel®-based 3D spheroids for 3 weeks with or without 1 μM BMS. p16INK4 was determined by immunofluorescence. Scale bars indicate 200 μm. f Effect of BMS on SA-βGal and p16INK4 staining in human macrophages incubated with 1 µM BMS for 7 days. Data are mean ± SE (n = 5, Student’s t-test vs. control, Ctrl). g Senescence on B16-F10 mouse melanocytes (1 µM BMS for 7 days) was determined by SA-βGal staining. Scale bars indicate 1000 μm. h SF were isolated from the joints of wild type (WT), Mc1re/e, or Mc3r−/− mice and treated with 1 μM BMS (B) and/or the ERK1/2 inhibitor FR180204 (ERK−; 1 µM) for 7 days. Senescence was quantified by SA-βGal staining. Data are mean ± SE (n = 4–6, Student’s t-test vs. control, C). i Senescence was induced in SF with 1 μM BMS and determined by SA-βGal staining. The MC1 antagonist ASIP or MC3/MC4 antagonist AGRP were used at 50 nM. Data are mean ± SE (n = 3, Student’s t-test vs. control, C; **p < 0.01, ***p < 0.001). j BMS (10 µM) was tested on the PathHunter β-Arrestin assay. Data represent % activation respect to positive controls: αMSH for melanocortin receptors and ghrelin for GHS receptor. k RT-PCR for the reference control HPRT1, and the ghrelin receptor GHSR on three different SF cells lines with expected bands at 130 and 148 bp, respectively. Source data are provided as Source Data file.
Fig. 3
Fig. 3. Gene expression profile acquired during MC1-mediated cellular senescence.
a RNAseq analysis on SF (n = 8 patient cell lines) treated with 1 μM BMS, identified 1952 statistically significant (p < 0.05) differentially expressed genes which are presented as a volcano plot: fold change from BMS vs. control, against p value. Highlighted genes were validated by real-time PCR. b Nineteen genes (details in Supplementary Table 3) were selected for expression validation using SYBR Green real-time PCR and fold changes calculated as 2−ΔΔCt. Values obtained by both techniques are presented against each other. Data are mean ± SE (n = 8 SF cell, Pearson’s correlation). c Senescence-related genes significantly altered by BMS treatment and their differential expression value: up-regulated in red, down-regulated in green. d Functional profiling of all 1952 differentially expressed genes identified by RNAseq using Panther Classification System. e Protein–protein interaction (PPI) network built with all 1952 significantly altered genes using STRING. Further functional analysis was performed with DAVID and significantly enriched categories are highlighted. f Selected genes associated with biological functions of interest are shown with their respective expression values (up-regulated in red, down-regulated in green) together with a correlation matrix constructed with all genes in each category. g PPI network constructed with selected genes related to SF activation and aggressive phenotype. The fold changes of down-regulated genes (in green) induced by BMS are shown. h Genes related to senescence and tissue repair were retrieved from CellAge and TiRe databases, respectively, and a merged PPI network generated using STRING. i Connectivity map analysis shows positive association (i.e. positive score, maximum score can be 100) between the BMS-induced genes identified through our RNAseq analysis and the gene expression profiles induced by drugs included in the Connectivity Map database. Source data are provided as Source Data file.
Fig. 4
Fig. 4. Role of the Notch pathway in SF senescence induced by BMS.
a Analysis of KEGG pathways of all 1952 differentially expressed genes following treatment with BMS (1 µM; 7 days). Number of genes annotated to each pathway (purple) and fold enrichment (green) are shown for the top 15 pathways. The Notch pathway is highlighted. b Specific members of the Notch pathway down-regulated in BMS-treated SF (green); figure was created using BioRender. Additional genes are shown in Supplementary Table 3. c Visual expression of Notch3 protein as determined by immunofluorescence on SF with or without treatment with BMS (1 µM; 7 days). Scale bars indicate 1000 μm. d Quantification of Notch3 protein expression on SF with or without treatment with BMS (1 µM for 7 days; n = 3, one-way ANOVA vs. control, Ctrl; *p < 0.05). e SFs were treated with vehicle or 1 μM BMS, in the presence or absence of the recombinant Notch ligand DLL4 (5 μg/ml) for 7 days. Senescence was measured by p16INK4 staining by immunofluorescence and % of positive cells were quantified (n = 3, Student’s t-test compared to vehicle (V*) or to BMS (B#); *p < 0.05, ##p < 0.001). Source data are provided as Source Data file.
Fig. 5
Fig. 5. Role of cholesterol and bile acids in SF senescence.
a Functional annotation of all 279 genes included in the CellAge database. b Cholesterol-pathway-related genes identified by RNAseq of SF treated with 1 μM BMS for 7 days: red (up-regulated); green (down-regulated). Additional information on these genes is reported in Supplementary Table 3. c Protein–protein interaction (PPI) network constructed with STRING reveals the interactivity between senescence-related genes and the cholesterol pathway. d Levels of cholesterol and bile acids in SF treated with 1 μM BMS for 7 days were quantified by enzyme immune-assay. Data are mean ± SE (n = 11 for cholesterol, n = 11 for bile acids, Student’s t-test vs. control, Ctrl; *p < 0.05, **p < 0.01). e SF were treated with 1 μM BMS (B) with or without 1 μM atorvastatin (A) for 7 days and senescence determined by SA-βGal staining. Data are mean ± SE (n = 3, one-way ANOVA vs. control, Ctrl; *p < 0.05). f Gene expression of GPBAR1 and reference gene HPRT1 on differentiated human macrophages on two different donors is shown with expected bands at 63 and 130 bp, respectively. g Human macrophages were incubated with supernatants from senescent SF (SenS, from SF treated with 1 µM BMS for 7 days), with SenS supernatants plus 5β-cholanic acid (SenS + 5β), supernatants from control SF (CtrlS) or directly stimulated with 1 μM BMS for 5 days. Apoptosis was assessed by flow cytometry by measuring annexin A5 and propidium iodide staining. Data are mean ± SE (n = 3). h Activated caspase-3 was assessed by fluorescent microscopy on human macrophages treated as in panel g. Scale bars indicate 200 μm. Source data are provided as Source Data file.
Fig. 6
Fig. 6. Anti-arthritic actions of BMS are associated with SF senescence.
a Arthritis was induced in C57BL/6NCrl mice with two injections of 100 μl KBN serum on day 0 and day 2. BMS was administered intraperitoneally daily at the dose of 18 mg/kg from day 3. Clinical score and paw swelling were recorded daily. Data are mean ± SE (n = 5, Student’s t-test vs. control day 9, Ctrl; *p < 0.05, **p < 0.01). b p16INK4 expression was assessed by immunofluorescence on EDTA-decalcified and paraffin-embedded knee joint sections. p16INK4 immunostaining is shown in pink while nuclear staining with DAPI is in blue. Scale bars indicate 100 μm. c Arthritis was induced with two injections of 150 μl KBN serum on days 0 and 2. BMS was administered intraperitoneally at a daily dose of 18 mg/kg from day 3. From day 4, senolytics (Sen, dasatinib + quercetin at doses of 2.5 and 10 mg/kg, respectively) were administered intraperitoneally on alternate days. Data are mean ± SE (n = 5, Student’s t-test vs. control at day 9, Ctrl; *p < 0.05). d p16INK4 expression was assessed by immunofluorescence on EDTA-decalcified and paraffin-embedded knee joints sections. p16INK4 is shown in pink. Arrows and dotted lines indicate synovial lining. e Co-localization by immunofluorescence of senescence marker p16INK4 and the SF marker cadherin-11, Cad11, in knee joins of arthritic mice treated with BMS. Scale bars indicate 100 μm. f Representative images of H&E (ankle joints) and Toluidine blue (knee joints) staining, indicating the degree of cell infiltration (H&E) and cartilage integrity (Toluidine blue) in control and BMS-treated mice. Data are mean ± SE (n = 5). g The extent of cell infiltration and cartilage damage were combined in a cumulative damage score (max = 6). Data values are mean ± SE (n = 5). Scale bars indicate 2.5 mm and 500 μm for H&E, and 1 mm and 100 μm for Toluidine blue. Source data are provided as Source Data file.
Fig. 7
Fig. 7. Association of MC1R gene variants with induction of SF senescence.
a MC1R variants identified in our study participants. Table includes variant name, position of nucleotide changed (Nt), specific nucleotide change (SNP), variant allele frequency (q), percentage (%), and number of patients (No.) and functional outcome described in literature for each variant (n = 20 patients). The location of each variant within MC1 protein is shown in the scheme. b Percentage (%) and number (No.) of patients carrying each of the haplotypes identified (total n = 20). c Effect of BMS on proliferation of SF cell lines obtained from each of the 20 patients genotyped. Patient cells cluster into responders (n = 16, green panel) and non-responders (n = 4, yellow panel) according to the effect of BMS in the proliferation assay. For each group, the MC1R variant analysis is shown (A: consensus allele; a: variant allele; q: allele “a” frequency; %: proportion of allele “a” carriers; p: p value two-tailed Fisher’s test). Moreover, superscript R: high penetrance red hair variant; superscript r: weakly associated with red hair. Quantification and images of SA-βGal staining are shown for each group (scale bars indicate 100 μm) as well as cholesterol production measured by enzyme immunoassay. Data are mean ± SE (Student’s t-test vs. control, C, *p < 0.05). Source data are provided as Source Data file.

Comment in

References

    1. Rodier F, Campisi J. Four faces of cellular senescence. J. Cell Biol. 2011;192:547–556. doi: 10.1083/jcb.201009094. - DOI - PMC - PubMed
    1. Childs BG, et al. Senescent cells: an emerging target for diseases of ageing. Nat. Rev. Drug Discov. 2017;16:718–735. doi: 10.1038/nrd.2017.116. - DOI - PMC - PubMed
    1. Shelton DN, Chang E, Whittier PS, Choi D, Funk WD. Microarray analysis of replicative senescence. Curr. Biol. 1999;9:939–945. doi: 10.1016/S0960-9822(99)80420-5. - DOI - PubMed
    1. Demaria M, et al. An essential role for senescent cells in optimal wound healing through secretion of PDGF-AA. Dev. Cell. 2014;31:722–733. doi: 10.1016/j.devcel.2014.11.012. - DOI - PMC - PubMed
    1. Krizhanovsky V, et al. Senescence of activated stellate cells limits liver fibrosis. Cell. 2008;134:657–667. doi: 10.1016/j.cell.2008.06.049. - DOI - PMC - PubMed

Publication types

MeSH terms