. 2020 Feb 6;11(2):102.
doi: 10.1038/s41419-020-2303-9.

Acetate supplementation restores chromatin accessibility and promotes tumor cell differentiation under hypoxia

Affiliations

Acetate supplementation restores chromatin accessibility and promotes tumor cell differentiation under hypoxia

Yang Li et al. Cell Death Dis. .

Abstract

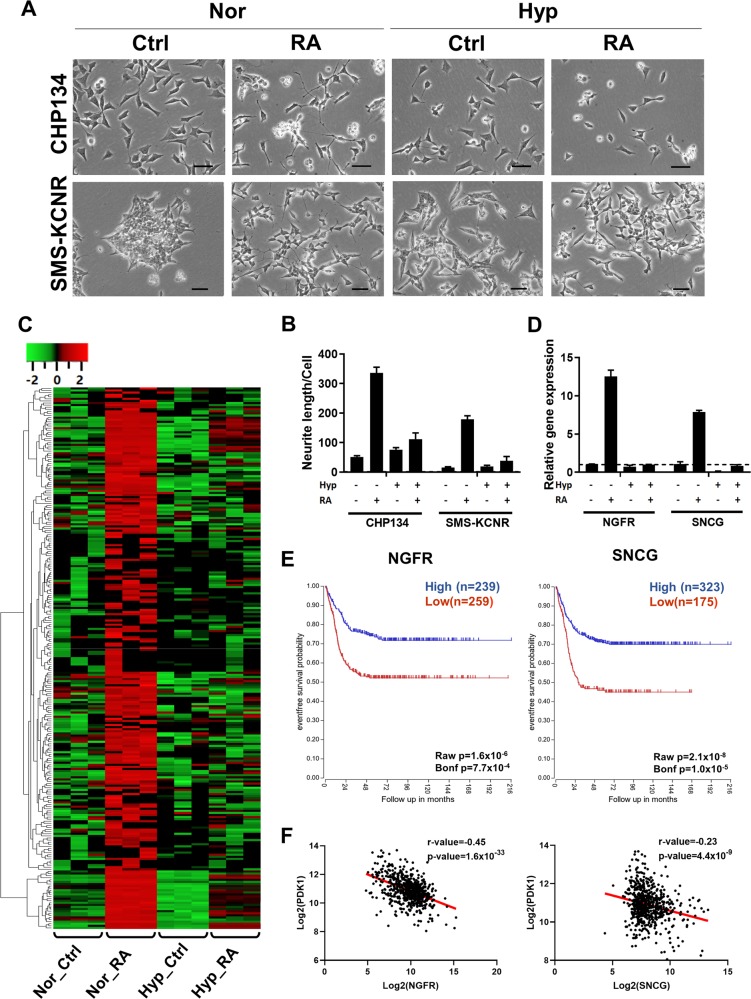
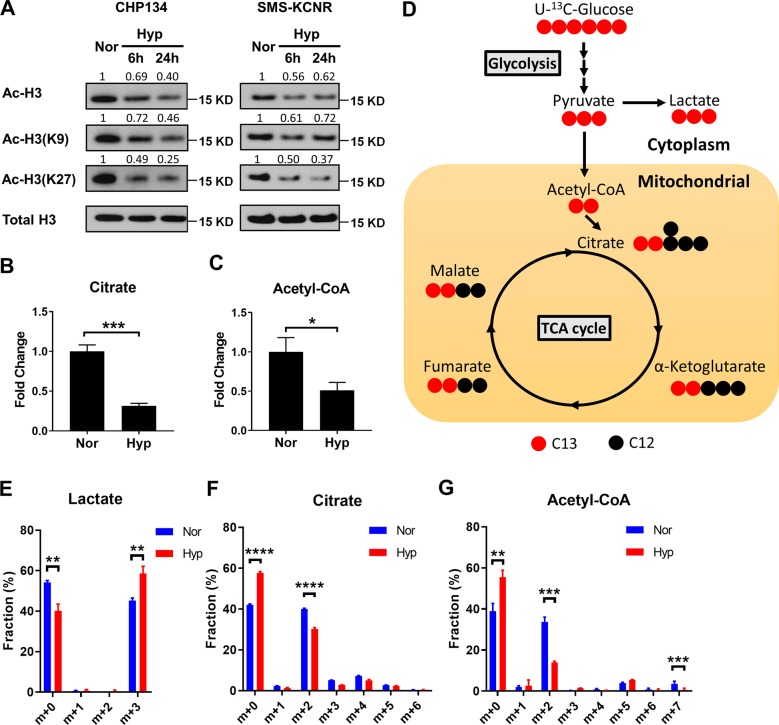
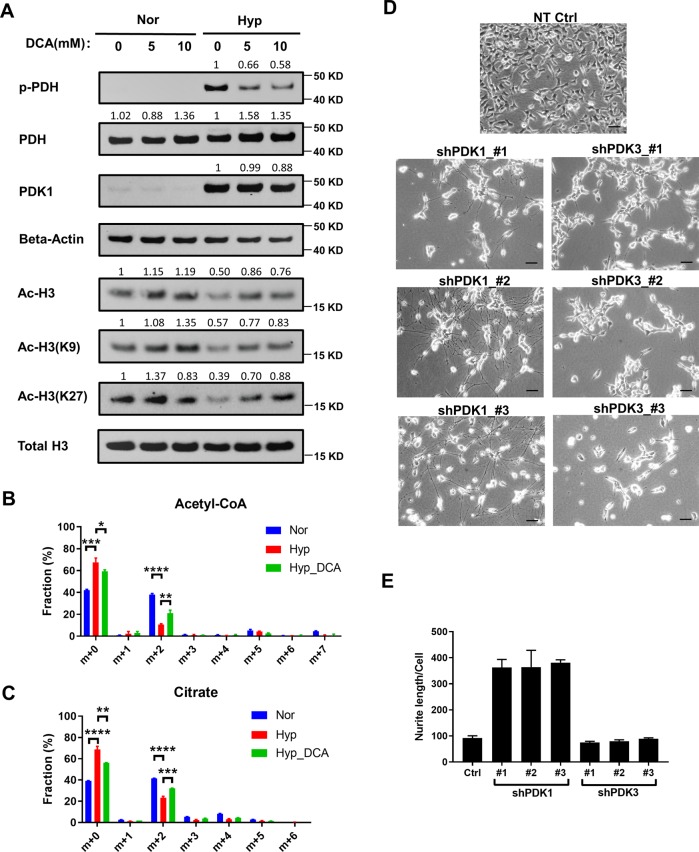
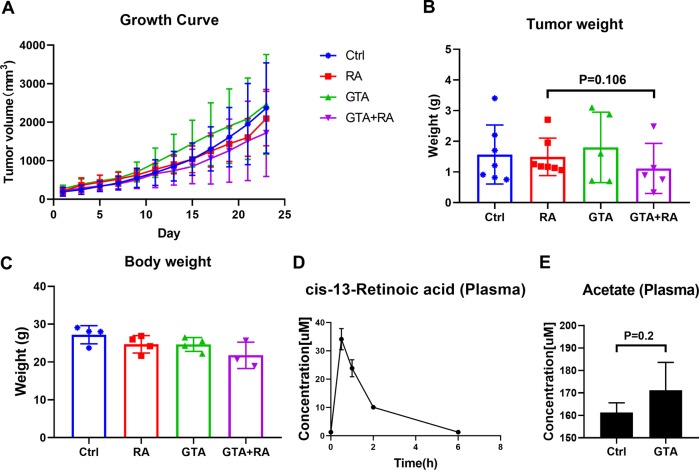
Despite the fact that Otto H. Warburg discovered the Warburg effect almost one hundred years ago, why cancer cells waste most of the glucose carbon as lactate remains an enigma. Warburg proposed a connection between the Warburg effect and cell dedifferentiation. Hypoxia is a common tumor microenvironmental stress that induces the Warburg effect and blocks tumor cell differentiation. The underlying mechanism by which this occurs is poorly understood, and no effective therapeutic strategy has been developed to overcome this resistance to differentiation. Using a neuroblastoma differentiation model, we discovered that hypoxia repressed cell differentiation through reducing cellular acetyl-CoA levels, leading to reduction of global histone acetylation and chromatin accessibility. The metabolic switch triggering this global histone hypoacetylation was the induction of pyruvate dehydrogenase kinases (PDK1 and PDK3). Inhibition of PDKs using dichloroacetate (DCA) restored acetyl-CoA generation and histone acetylation under hypoxia. Knocking down PDK1 induced neuroblastoma cell differentiation, highlighting the critical role of PDK1 in cell fate control. Importantly, acetate or glycerol triacetate (GTA) supplementation restored differentiation markers expression and neuron differentiation under hypoxia. Moreover, ATAC-Seq analysis demonstrated that hypoxia treatment significantly reduced chromatin accessibility at RAR/RXR binding sites, which can be restored by acetate supplementation. In addition, hypoxia-induced histone hypermethylation by increasing 2-hydroxyglutarate (2HG) and reducing α-ketoglutarate (αKG). αKG supplementation reduced histone hypermethylation upon hypoxia, but did not restore histone acetylation or differentiation markers expression. Together, these findings suggest that diverting pyruvate flux away from acetyl-CoA generation to lactate production is the key mechanism that Warburg effect drives dedifferentiation and tumorigenesis. We propose that combining differentiation therapy with acetate/GTA supplementation might represent an effective therapy against neuroblastoma.


Conflict of interest statement

Y.L and J.Y have filed a provisional patent application: Treatment of cancer with combination of agents.

Figures

Fig. 1
Fig. 1. Hypoxia disrupts RA-induced differentiation by suppressing the expression of differentiation markers in neuroblastoma cells.
a CHP134 and SMS-KCNR cells were treated with 10 μM RA for 48 h under normoxia or hypoxia. Representative image from each treatment group showed the morphologic changes. Scale bar: 50 μm. b Quantification of neurite outgrowth in (a) with NeuronJ, a plugin in the ImageJ package. c Heatmap and hierarchical clustering of the potential differentiation markers that were induced by RA treatment but repressed by hypoxia treatment. Gene expression levels were determined by RNA-Seq (n = 3). d NGFR and SNCG expression levels in CHP134 cells treated with 10 μM RA or DMSO under normoxia or hypoxia (n = 3). e Overall survival of neuroblastoma patients grouped by NGFR or SNCG expression level. f The negative correlation between the expression of differentiation markers and hypoxic marker PDK1 in neuroblastoma samples. (The analyses in e, f were performed on publicly available dataset from R2: Genomic Analysis and Visualization Platform (http://r2.amc.nl).
Fig. 2
Fig. 2. Hypoxia causes histone hypoacetylation by decreasing citrate and acetyl-CoA generation.
a Time course study of acetylation on H3K9, H3K27, and total H3 in CHP134 and SMS-KCNR cells under hypoxia by immunoblots. The band intensity was quantified with Imagelab 6.0.1 software (Bio-Rad) and normalized to loading control. b, c Both citrate and acetyl-CoA levels were measured using LC-MS (n = 3). d Schematic of labeling patterns of U-13C-glucose flux through metabolic pathways. e–g Isotopomer distribution of lactate, citrate, and acetyl-CoA from CHP134 cells cultured in the presence of U-13C glucose for 3 h with or without 16 h hypoxia pretreatment (n = 3). (Data in b, c and eg are represented as mean ± SD of three biological repeats. P < 0.05; ∗∗P < 0.01; ∗∗∗P < 0.001, determined by Student’s two-tailed t-test.).
Fig. 3
Fig. 3. DCA restores pyruvate flux into TCA cycle and histone acetylation.
a Immunoblots of p-PDH, total PDH, PDK1, beta-Actin, acetylation on H3K9, H3K27 and total H3 under normoxia or hypoxia treated with DMSO, 5 mM or 10 mM DCA. b, c Isotopomer distribution of citrate and acetyl-CoA from CHP134 cells cultured in the presence of U-13C glucose for 3 h under normoxia, hypoxia, or hypoxia with 5 mM DCA treatment. (Data in b, c are represented as mean ± SD of three biological repeats. *P < 0.05; **P < 0.01; ***P < 0.001, determined by Student’s two-tailed t-test.). d CHP134 cells were infected with lentivirus expressing shRNA targeting PDK1 or PDK3 (three independent vectors). After puromycin selection, representative images from each pool population were shown. e Quantification of neurite outgrowth in (d).
Fig. 4
Fig. 4. Acetate supplementation increases the expression of differentiation markers by promoting histone acetylation.
a Immunoblots of acetylation on H3K9, H3K27, and total H3 under normoxia or hypoxia treated with vehicle control, 5 mM acetate, 0.5 mM GTA or 2 mM GTA. b Isotopomer distribution of acetyl-CoA, citrate, fumarate, and malate from CHP134 cells cultured in the presence of U-13C acetate for 3 h with or without 16 h hypoxia pretreatment. c, d qPCR analysis for SNCG and NGFR expression in CHP134 cells treated with DMSO, 10 μM RA alone, or 10 μM RA combined with 5 mM acetate or 2 mM GTA for 16 h under normoxia or hypoxia. e Model of histone acetylation and cell differentiation regulation under hypoxia. (Data in b represent mean ± SD of three biological repeats. Data in c, d are represented as mean ± SD of triplicate PCR reactions; a representative of two independent experiments is shown. *P < 0.05; **P < 0.01; ***P < 0.001, ****P < 0.0001, determined by Student’s two-tailed t-test.).
Fig. 5
Fig. 5. Acetate supplementation restores neuroblastoma cell differentiation under hypoxia.
a CHP134 cell differentiation induced by 10 μM RA, 2 mM GTA, or 10 μM RA plus 2 mM GTA for 48 h under normoxia or hypoxia. Scale bar: 50 μm. b Immunofluorescence staining of β-tubulin III (Red) and DAPI (Blue) in CHP134 cells treated with 10 μM RA, 5 mM acetate, or 10 μM RA plus 5 mM acetate for 72 h under normoxia or hypoxia. Scale bar: 50 μm. c Quantification of neurite outgrowth in (a). d CHP134 cell proliferation measured in 12 well-plate treated with 10 μM RA, 2 mM GTA, or 10 μM RA plus 2 mM GTA under normoxia or hypoxia for 48 h. (Data in c, d are represented as mean ± SD of three biological repeats. *P < 0.05; **P < 0.01; ***P < 0.001, ****P < 0.0001, determined by Student’s two-tailed t-test.).
Fig. 6
Fig. 6. ATAC-Seq reveals that chromatin accessibility of RAR-RXR target genes and differentiation markers are restored by acetate supplementation under hypoxia.
a Comparison of chromatin accessibility under normoxia and hypoxia. b Chromatin accessibility changes in response to acetate supplementation under hypoxia. c Genes with RAR-RXR binding site showed decreased chromatin accessibility under hypoxia. d Acetate supplementation increased chromatin accessibility of genes with RAR-RXR sites under hypoxia. e Pathway enrichment of genes whose chromatin accessibility was decreased under hypoxia and restored by acetate supplementation. f Browser track of SNCG under normoxia, hypoxia and hypoxia with 5 mM acetate.
Fig. 7
Fig. 7. In vivo xenograft study in NSG mice.
a Tumor volume of CHP134 mice xenografts as measured every other day. NSG mice xenografted with CHP134 cells were randomized into 4 groups and received 10 mg/kg RA via i.p. injection, 5% GTA in drinking water or both. b Tumor weights at experimental endpoint. (Control group: n = 7, RA group: n = 7, GTA group: n = 5 and GTA + RA group: n = 5). c Body weights at experimental endpoint. (Control group: n = 4, RA group: n = 4, GTA group: n = 4 and GTA + RA group: n = 3, one mouse died during treatment). d Pharmacokinetics of RA in NSG mice following administration of 10 mg/kg RA via i.p. injection. Plasma samples at each time point were collected from tail vein (n = 3). e Acetate measurement in the plasma of NSG mice in control and GTA group (n = 3). (Results in ae are represented as mean ± SD.).
Fig. 8
Fig. 8. αKG reduces hypoxia-induced histone hypermethylation, but cannot restore the expression of differentiation markers.
a Time course study of tri-methylation on H3K9, H3K27 in CHP134 and SMS-KCNR cells under hypoxia. b Hypoxia decreased αKG level, but increased 2HG production and 2HG/αKG ratio in CHP134 and SMS-KCNR cells. c Immunoblots of histone methylation and acetylation markers under normoxia or hypoxia treated with vehicle control, 1 mM or 5 mM DMKG in CHP134 cells. d qPCR analysis for SNCG and NGFR expression in CHP134 cells treated with DMSO, 10 μM RA alone, 5 mM DMKG alone or 10 μM RA combined with 5 mM DMKG for 16 h under normoxia or hypoxia. (Data in b are represented as mean ± SD of three biological repeats. Data in d are represented as mean ± SD of triplicate PCR reactions; a representative of two independent experiments is shown. *P < 0.05; **P < 0.01; ***P < 0.001, ****P < 0.001, determined by Student’s two-tailed t-test.).

References

    1. Warburg O, Posener K, Negelein E. On the metabolism of carcinoma cells. Biochem Z. 1924;152:309–344.
    1. Warburg O, Wind F, Negelein E. The metabolism of tumors in the body. J. Gen. Physiol. 1927;8:519–530. doi: 10.1085/jgp.8.6.519. - DOI - PMC - PubMed
    1. Warburg O. On the origin of cancer cells. Science. 1956;123:309–314. doi: 10.1126/science.123.3191.309. - DOI - PubMed
    1. Jogi A, et al. Hypoxia alters gene expression in human neuroblastoma cells toward an immature and neural crest-like phenotype. Proc. Natl Acad. Sci. USA. 2002;99:7021–7026. doi: 10.1073/pnas.102660199. - DOI - PMC - PubMed
    1. Fredlund E, Ringner M, Maris JM, Pahlman S. High Myc pathway activity and low stage of neuronal differentiation associate with poor outcome in neuroblastoma. Proc. Natl Acad. Sci. USA. 2008;105:14094–14099. doi: 10.1073/pnas.0804455105. - DOI - PMC - PubMed

Publication types

MeSH terms