. 2020 Feb 6;10(1):2046.
doi: 10.1038/s41598-020-58563-w.

Automated high-throughput heartbeat quantification in medaka and zebrafish embryos under physiological conditions

Affiliations

Automated high-throughput heartbeat quantification in medaka and zebrafish embryos under physiological conditions

Jakob Gierten et al. Sci Rep. .

Abstract

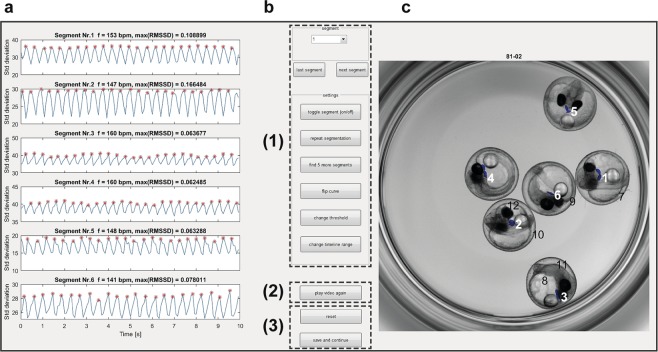
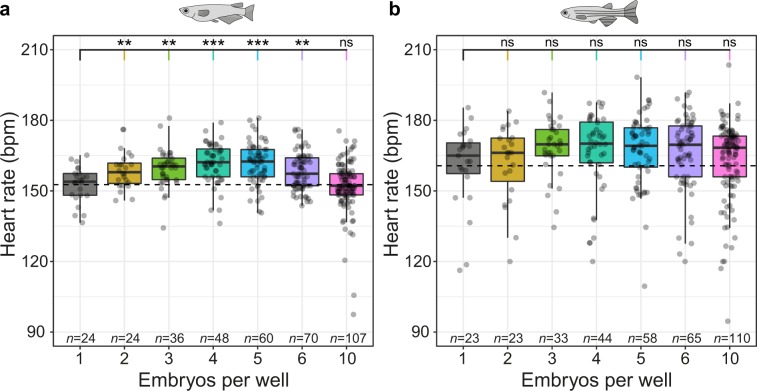
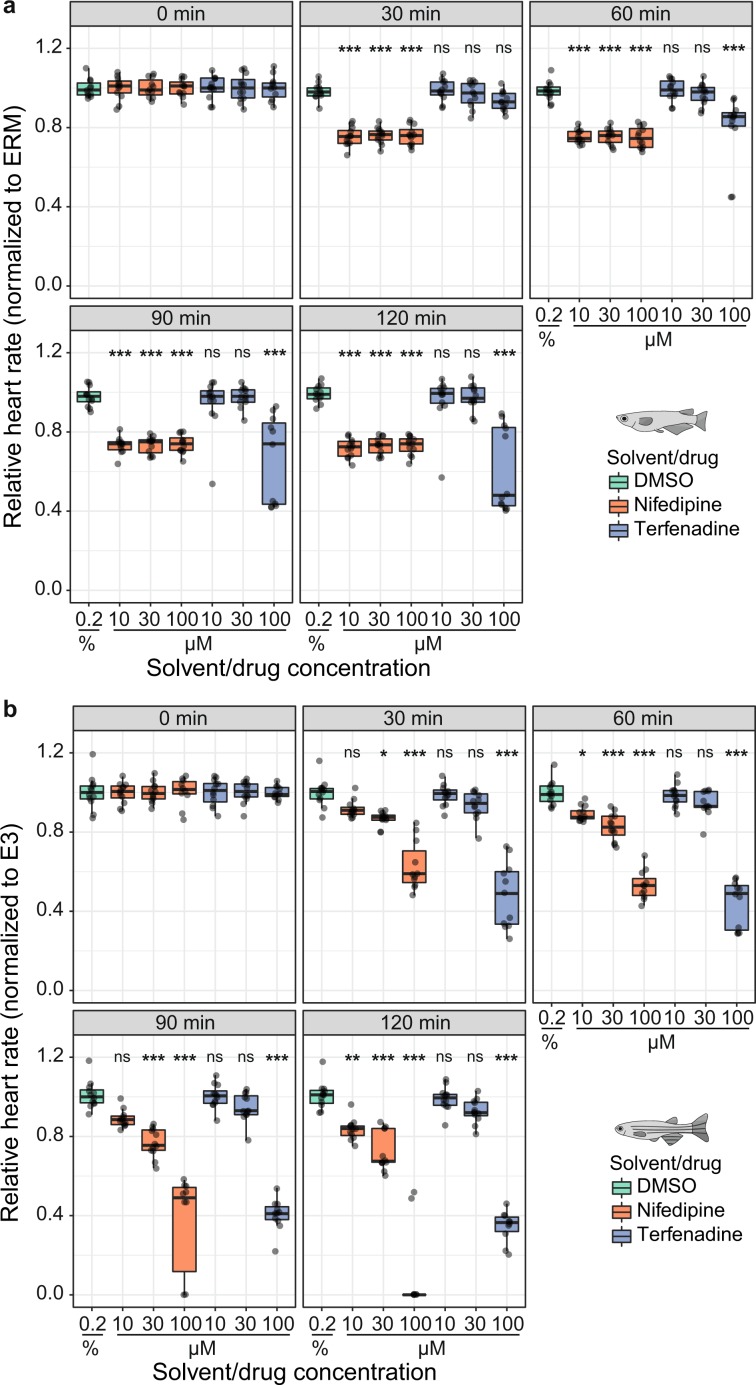
Accurate quantification of heartbeats in fish models is an important readout to study cardiovascular biology, disease states and pharmacology. However, dependence on anaesthesia, laborious sample orientation or requirement for fluorescent reporters have hampered the use of high-throughput heartbeat analysis. To overcome these limitations, we established an efficient screening assay employing automated label-free heart rate determination of randomly oriented, non-anesthetized medaka (Oryzias latipes) and zebrafish (Danio rerio) embryos in microtiter plates. Automatically acquired bright-field data feeds into an easy-to-use HeartBeat software with graphical user interface for automated quantification of heart rate and rhythm. Sensitivity of the assay was demonstrated by profiling heart rates during entire embryonic development. Our analysis revealed rapid adaption of heart rates to temperature changes, which has implications for standardization of experimental layout. The assay allows scoring of multiple embryos per well enabling a throughput of >500 embryos per 96-well plate. In a proof of principle screen for compound testing, we captured concentration-dependent effects of nifedipine and terfenadine over time. Our novel assay permits large-scale applications ranging from phenotypic screening, interrogation of gene functions to cardiovascular drug development.


Conflict of interest statement

Jochen Gehrig is an employee of DITABIS AG, Pforzheim, Germany. All other authors declare no competing interests.

Figures

Figure 1
Figure 1
Workflow of automated imaging and heart rate quantification in medaka and zebrafish embryos. (a) Cardiovascular development is functional after 24 and 48 hpf and hatching occurs around 48–72 hpf and 7–8 dpf in zebrafish and medaka, accordingly, defining time windows of embryonic cardiac imaging in both fish species. (b) Single or multiple fish embryos per well are mounted without anaesthesia or agarose into microtiter plates, which have a fixed position in the imaging platform; image sequences can be sampled at different frame rates, resolutions and channels; all images were recorded with 2x objective, images with single embryos were cropped, multiple embryos in a well (Multi) are presented as full frame; in the fluorescent image A and V denote atrium and ventricle and a rough outline of the embryo is overlaid as a reference. (c) After image optimization, image sequences are quantified through a GUI of the HeartBeat program (compare Fig. 2) and heart rates, beat-to-beat variability and an overview of segmentation are saved as spreadsheet and graphical output, respectively.
Figure 2
Figure 2
Functionalities of HeartBeat software. (ac) Graphical user interface of the HeartBeat software for computer-assisted semi-automated analysis allowing convenient and rapid quality check. (a) Standard deviations of pixel values relating to segmented heart regions are displayed over time in the left panel, where heartbeats are indicated by red asterisks for each image sequence. (b) A control panel allows (1) to refine settings of segmentation and to choose alternative segments, (2) to re-play the current image sequence (visualized in c), (3) to reset all settings or to save heart rates to spreadsheets together with a picture of segmented image sequence. (c) Visualization of the image sequence with segmented heart regions displayed as numbered blue areas (detailed manual available together with software in Supplementary material online).
Figure 3
Figure 3
Heartbeat detection of multiple embryos per well. (a,b) Scoring of heart rate with 1–6 and 10 embryos per well for medaka at 102 hpf (a) and zebrafish at 34 hpf (b). Data is provided as box plots and scatter plots of original heart rate measurements. Heart rates of mounting groups with ≥2 embryos per well were each tested with Student’s t-test against 1 embryo per well (dashed line indicates mean heart rate of the group with 1 embryo per well); significant differences are indicated with *P < 0.05, **P < 0.01 and ***P < 0.001, ns (not significant); n for each group is indicated in the figure.
Figure 4
Figure 4
Heart rates of medaka and zebrafish during embryonic development. (a,b) Heart rates of unhatched embryos were measured from onset of heartbeat until hatching (details in Methods). (a) Circadian oscillation of heart rate in medaka from 3 dpf onwards (mean ± s.d., n = 13–18 each point in time). (b) In zebrafish, the onset of the heartbeat was followed by an immediate increase of heart rate passing into a less steep slope of increase at around 210 bpm (mean ± s.d., n = 12–52 each point in time).
Figure 5
Figure 5
Temperature-dependent heart rate modulation. (a,b) Heart rate response to temperature gradients in medaka (100–102 hpf, n = 47–48 at each temperature in a) and zebrafish (31–33 hpf, n = 43–48 at each temperature in b) recorded at 13 fps. Significant differences between heart rates at each temperature were tested with one-way ANOVA and pairwise comparisons using Student’s t-test and are given with *P < 0.05, **P < 0.01 and ***P < 0.001 (significant differences are indicated only for 1 °C-increments; P-values for all pairs of combinations in a,b are given in Supplementary Table S1 and S2, respectively); data is presented as box plots (median±interquartile range) and overlaid scatter plots of heart rate values.
Figure 6
Figure 6
Quantification of heart rates in fish embryos treated with compounds. 96-well format for incubation of medaka and zebrafish embryos with terfenadine and nifedipine each at three different concentrations in µM. As a control for stage-dependent changes of heart rate, all measurements (drugs and DMSO) were normalized to a negative control group of age-matched untreated embryos (row H). The HeartBeat software directly provides a heatmap output for intuitive assessment of drug effects (heart rate response shown at 90 min; nd: not detected).
Figure 7
Figure 7
Heart rate inhibition by nifedipine and terfenadine over time. (a) Time course of drug effects revealing heart rate inhibition in medaka embryos (102–104 hpf) by nifedipine and 100 µM terfenadine (n = 11–12 each for DMSO, terfenadine 10/30/100 µM, nifedipine 10/30/100 µM at every time point). (b) Concentration-dependent heart rate decrease by nifedipine and terfenadine in zebrafish (32–34 hpf; n = 10–12 for all treatment and control groups at every time point). Significant difference between each drug concentration and the time-matched DMSO control group were tested with one-way ANOVA and pairwise comparisons using Student’s t-test and are given with *P < 0.05, **P < 0.01 and ***P < 0.001, ns (not significant); data is visualized as box plots (median ± interquartile range) and scatter plots of original data points. At all points in time, each heart rate measurement of one of the treatment groups is normalized to the mean heart rate of a control group in fish medium (ERM/medaka, E3/zebrafish; data not shown) to account for stage-dependent changes and is expressed relative to the corresponding baseline treatment group mean (time point 0).

References

    1. Hoed den M, et al. Identification of heart rate-associated loci and their effects on cardiac conduction and rhythm disorders. Nat. Genet. 2013;45:621–631. doi: 10.1038/ng.2610. - DOI - PMC - PubMed
    1. Eppinga RN, et al. Identification of genomic loci associated with resting heart rate and shared genetic predictors with all-cause mortality. Nat. Genet. 2016;48:1557–1563. doi: 10.1038/ng.3708. - DOI - PubMed
    1. Hassel D, et al. Deficient zebrafish ether-a-go-go-related gene channel gating causes short-QT syndrome in zebrafish reggae mutants. Circulation. 2008;117:866–875. doi: 10.1161/CIRCULATIONAHA.107.752220. - DOI - PubMed
    1. Ma J-F, et al. TBX5 mutations contribute to early-onset atrial fibrillation in Chinese and Caucasians. Cardiovasc. Res. 2016;109:442–450. doi: 10.1093/cvr/cvw003. - DOI - PMC - PubMed
    1. Milan DJ, Peterson TA, Ruskin JN, Peterson RT, MacRae CA. Drugs that induce repolarization abnormalities cause bradycardia in zebrafish. Circulation. 2003;107:1355–1358. doi: 10.1161/01.CIR.0000061912.88753.87. - DOI - PubMed

Publication types