. 2020 Feb 6;10(1):1959.
doi: 10.1038/s41598-020-58878-8.

Red versus green leaves: transcriptomic comparison of foliar senescence between two Prunus cerasifera genotypes

Affiliations

Red versus green leaves: transcriptomic comparison of foliar senescence between two Prunus cerasifera genotypes

Alberto Vangelisti et al. Sci Rep. .

Abstract

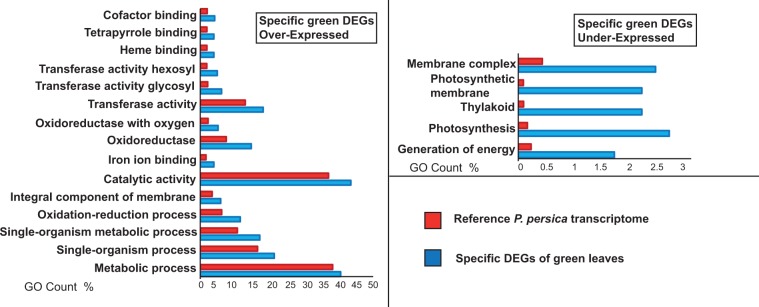
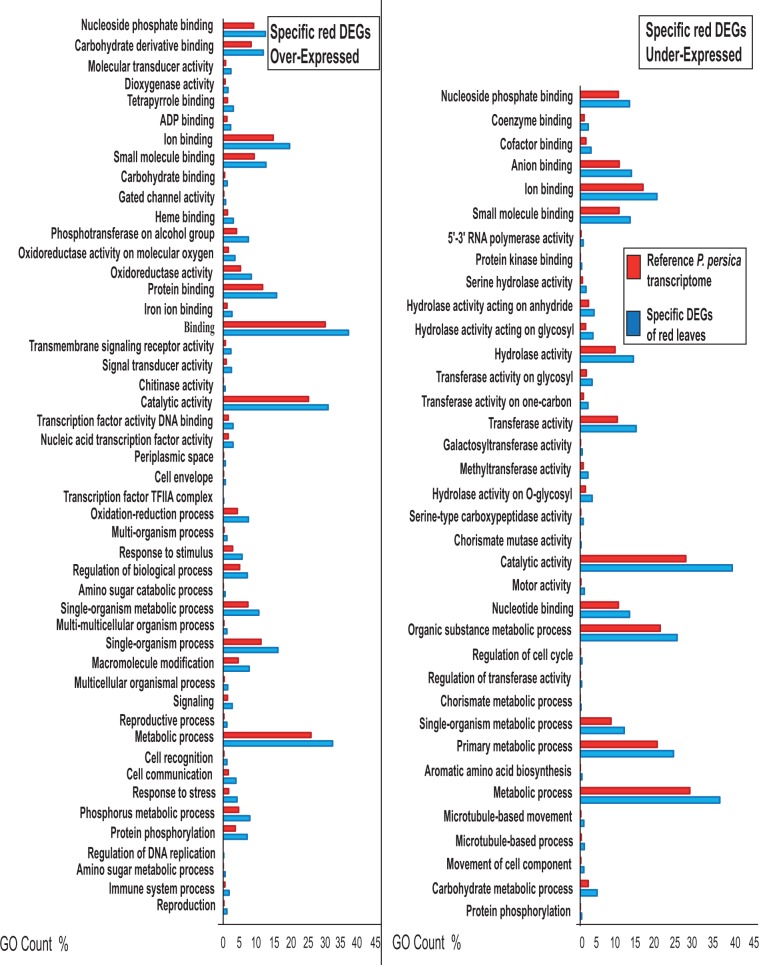
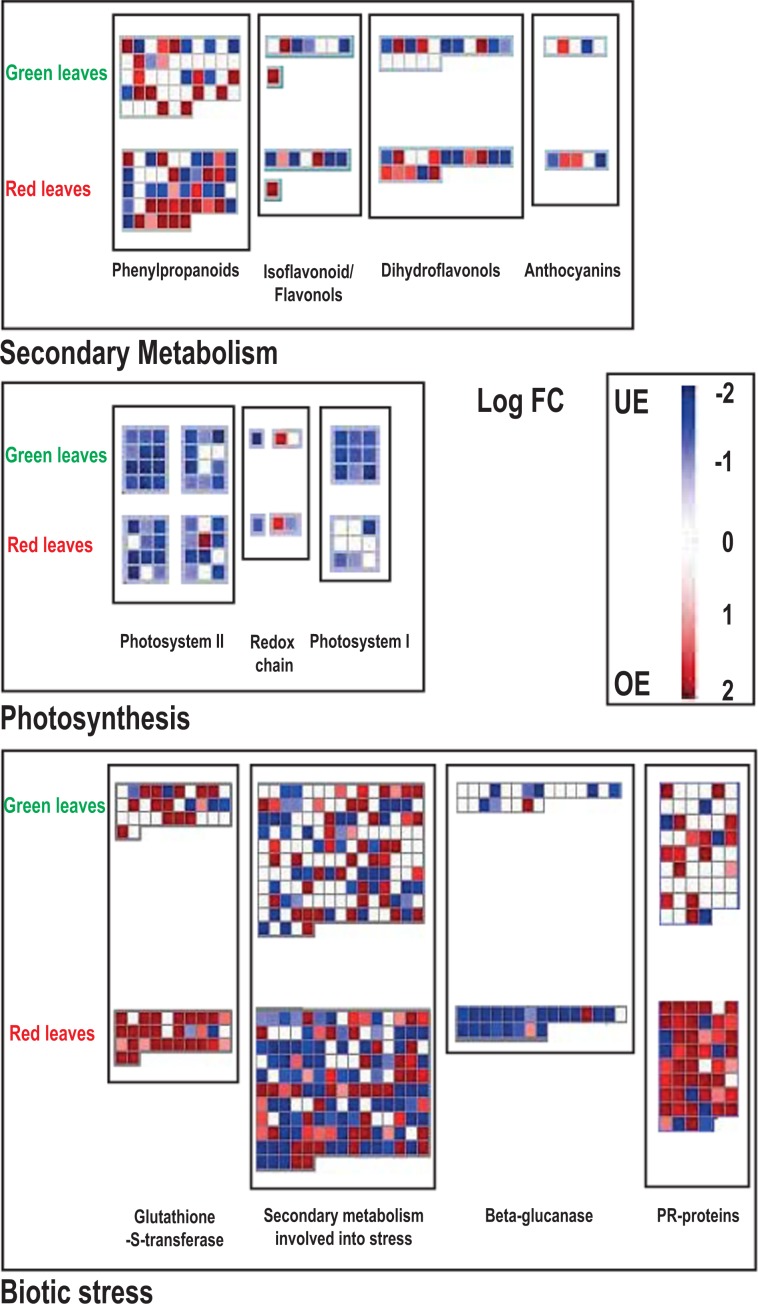
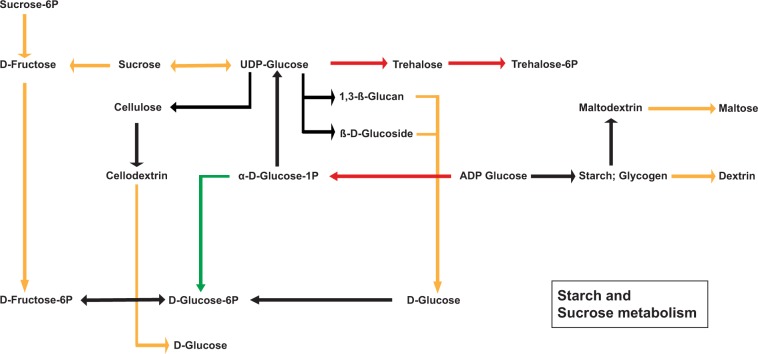
The final stage of leaf ontogenesis is represented by senescence, a highly regulated process driven by a sequential cellular breakdown involving, as the first step, chloroplast dismantling with consequent reduction of photosynthetic efficiency. Different processes, such as pigment accumulation, could protect the vulnerable photosynthetic apparatus of senescent leaves. Although several studies have produced transcriptomic data on foliar senescence, just few works have attempted to explain differences in red and green leaves throughout ontogenesis. In this work, a transcriptomic approach was used on green and red leaves of Prunus cerasifera to unveil molecular differences from leaf maturity to senescence. Our analysis revealed a higher gene regulation in red leaves compared to green ones, during leaf transition. Most of the observed DEGs were shared and involved in transcription factor activities, senescing processes and cell wall remodelling. Significant differences were detected in cellular functions: genes related to photosystem I and II were highly down-regulated in the green genotype, whereas transcripts involved in flavonoid biosynthesis, such as UDP glucose-flavonoid-3-O-glucosyltransferase (UFGT) were exclusively up-regulated in red leaves. In addition, cellular functions involved in stress response (glutathione-S-transferase, Pathogen-Related) and sugar metabolism, such as three threalose-6-phosphate synthases, were activated in senescent red leaves. In conclusion, data suggests that P. cerasifera red genotypes can regulate a set of genes and molecular mechanisms that cope with senescence, promoting more advantages during leaf ontogenesis than compared to the green ones.


Conflict of interest statement

The authors declare no competing interests.

Figures

Figure 1
Figure 1
Venn diagram for over and under-expressed DEGs of Prunus cerasifera red and green leaves during ontogenesis. Red circle represents differentially expressed genes (DEGs) in the red morph whereas green area is for DEGs of green leaves. Shared genes are in the yellow intersection.
Figure 2
Figure 2
GO enrichment analysis for specific genes activated and repressed only by green leaves of Prunus cerasifera during senescence. Blue bars represent percentage of GO terms in DEGs. Red bars are the percentage of GO terms in reference transcriptome. GO terms summarized by REVIGO are shown.
Figure 3
Figure 3
GO enrichment analysis for specific genes activated and repressed only by red leaves of Prunus cerasifera during senescence. Blue bars represent percentage of GO terms in DEGs. Red bars are the percentage of GO terms in reference transcriptome. GO terms summarized by REVIGO are shown.
Figure 4
Figure 4
MapMan analysis for differentially expressed genes both in red and green Prunus cerasifera leaves throughout ontogenesis. Maps for secondary metabolism, photosynthesis and biotic stress were shown. Red dots are the over-expressed genes whereas blue dots are under-expressed ones. White dots indicate genes which were not differentially expressed in one morph but in the other. The scale, based on gene fold change, span from dark blue (Log FC = −2) to dark red (Log FC = 2).
Figure 5
Figure 5
Summarized sketch for starch and sucrose map from KEGG. Red and green arrows are the enzymatic pathway for over-expressed DEGs in respectively red and green Prunus cerasifera morphs during senescence. Pathway activated from both leaf morphs are yellow underlined. Not activated pathways are represented by black arrow.

References

    1. Masclaux C, Valadier MH, Brugière N, Morot-Gaudry JF, Hirel B. Characterization of the sink/source transition in tobacco (Nicotiana tabacum L.) shoots in relation to nitrogen management and leaf senescence. Planta. 2000;211:510–518. doi: 10.1007/s004250000310. - DOI - PubMed
    1. Kim, H. J., Lim, P. O. & Nam, H. G. Molecular regulation of senescence in Annual Plant Reviews (ed. Gan, S.) 180–181 (2007).
    1. Wu XY, Kuai BK, Jia JZ, Jing HC. Regulation of leaf senescence and crop genetic improvement. J. Integr Plant Biol. 2012;54:936–952. doi: 10.1111/jipb.12005. - DOI - PubMed
    1. Woo HR, et al. Programming of plant leaf senescence with temporal and inter-organellar coordination of transcriptome in Arabidopsis. Plant. Physiol. 2016;171:452–467. doi: 10.1104/pp.15.01929. - DOI - PMC - PubMed
    1. Kim J, Wuo HR, Nam HG. Toward systems understanding of leaf senescence: an integrated multi-omics perspective on leaf senescence research. Mol. Plant. 2016;9:813–825. doi: 10.1016/j.molp.2016.04.017. - DOI - PubMed

Publication types

MeSH terms