. 2020 Feb;22(2):225-234.
doi: 10.1038/s41556-020-0461-8. Epub 2020 Feb 6.

Energy-stress-mediated AMPK activation inhibits ferroptosis

Affiliations

Energy-stress-mediated AMPK activation inhibits ferroptosis

Hyemin Lee et al. Nat Cell Biol. 2020 Feb.

Abstract

Energy stress depletes ATP and induces cell death. Here we identify an unexpected inhibitory role of energy stress on ferroptosis, a form of regulated cell death induced by iron-dependent lipid peroxidation. We found that ferroptotic cell death and lipid peroxidation can be inhibited by treatments that induce or mimic energy stress. Inactivation of AMP-activated protein kinase (AMPK), a sensor of cellular energy status, largely abolishes the protective effects of energy stress on ferroptosis in vitro and on ferroptosis-associated renal ischaemia-reperfusion injury in vivo. Cancer cells with high basal AMPK activation are resistant to ferroptosis and AMPK inactivation sensitizes these cells to ferroptosis. Functional and lipidomic analyses further link AMPK regulation of ferroptosis to AMPK-mediated phosphorylation of acetyl-CoA carboxylase and polyunsaturated fatty acid biosynthesis. Our study demonstrates that energy stress inhibits ferroptosis partly through AMPK and reveals an unexpected coupling between ferroptosis and AMPK-mediated energy-stress signalling.


Conflict of interest statement

Competing Interests

B.R.S. holds equity in and serves as a consultant to Inzen Therapeutics, and is an inventor on patents and patent applications related to ferroptosis. The other authors declare no competing financial interests.

Figures
Extended Data Fig. 1
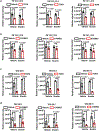
Extended Data Fig. 1. Energy stress inhibits ferroptosis
a, Immunoblot analysis in MEFs treated with 2 μM erastin (16 h), cysteine free media (8 h), 100 nM RSL3 (16 h), or 1 μM of staurosporine (STS, 2 h). b, Cell death measurement in MEFs treated with 2 μM erastin and cell death inhibitors for 16 h. Ferr-1: 1 μM ferrostatin-1; DFO: 100 μM deferoxamine; Z-V: 20 μM Z-VAD-FMK; Nec: 2 μM necrostatin-1; NAC: 5 mM N-acetyl cysteine. c, Cell death measurement in MEFs cultured in 25 or 0 mM glucose-containing medium with erastin and/or Ferrostatin-1 for the indicated times. d, Immunoblot analysis in MEFs treated as in a, or glucose starvation for 48 h. e, Cell death measurement in MEFs cultured in cystine free media with cell death inhibitors for 8 h. f, g, Intracellular ATP levels (f) and cell death measurement (g) in MEFs cultured with the indicated concentrations of glucose for 16 h. h-k, The measurement of cell death (h, j) and lipid peroxidation (i, k) in Caki-1 or BJ cells. Cells were treated with A769662 (200 μM), AICAR (2 mM), 2DG (5 mM), 0 mM glucose with simultaneous treatment of 2 μM erastin for 24 h (cell death) and 16 h (Lipid peroxidation). P values correspond to the comparison between control and each treatment in red bars. l, Immunoblot showing the levels of AMPK T172 phosphorylation. MEFs cells were treated as in h-k and compound C (5 μM) for 16 h. m, Cell death measurement in AMPK WT and DKO MEFs treated with 2 μM erastin and 2 mM of AICAR for 16 h. n, Cell death measurement in AMPK WT and DKO MEFs treated with erastin at the indicated concentrations for 16 h. P values correspond to the comparison between AMPK WT and DKO at indicated erastin concentrations. Data show the mean ± s.d., n = 3 independent experiments. Statistical analysis was performed using unpaired, two-tailed t-test. Numerical source data are provided in Source Data Extended Data Fig. 1. Scanned images of unprocessed blots are shown in Source Data Extended Data Fig. 1.
Extended Data Fig. 2
Extended Data Fig. 2. AMPK inactivation renders cells sensitive to ferroptotic cell death
a, Western blot showing the levels of ACC (S79) and AMPK (T172) phosphorylation in ACHN cells treated with erastin for 24 h or cultured in cystine-free media for 36 h with and without compound C (10 μM). b, Cell death measurement in AMPK WT and DKO ACHN cell lines treated with 100 nM RSL3 for 16 h. c, d, Cell death measurement in RCC4 cells treated with 10 μM of compound C, cell death inhibitors, and 5 μM of erastin for 24 h (c) or in cystine free media for 36 h (d). Ferr-1: 1 μM ferrostatin-1; Z-V: 20 μM Z-VAD-FMK; Nec: 2 μM necrostatin-1; NAC: 5 mM N-acetyl cysteine. e, Western blot showing the AMPK expression in RCC4 cell as indicated. f-h, Cell death measurement in AMPK WT and DKO RCC4 cell lines treated with 5 μM of erastin for 24 h (f), cultured in cystine free media for 24 h (g), or treated with 100 nM of RSL3 for 24 h (h). i-k, Lipid peroxidation measurement in AMPK WT and DKO RCC4 cells treated with 5 μM of erastin for 18 h (i), cultured in cystine free media for 18 h (j), or treated with 100 nM of RSL3 for 12 h (k). l, Cell death measurement in indicated RCC4 cells cultured with cystine free media for 24 h. Data show the mean ± s.d., n = 3 independent experiments. Statistical analysis was performed using unpaired, two-tailed t-test. Numerical source data are provided in Source Data Extended Data Fig. 2. Scanned images of unprocessed blots are shown in Source Data Extended Data Fig. 2.
Extended Data Fig. 3
Extended Data Fig. 3. AMPK regulates ferroptosis partly through AMPK-mediated phosphorylation of ACC
a, Immunoblot blot indicating the loss of LKB1 in LKB1 KO ACHN cells generated using CRISPR/CAS9 system. b, Cell death in LKB1 WT and KO ACHN cells treated with 2 μM of erastin for 24 h and cultured in cystine free media for 24 h. c, Immunoblot blot showing mTOR inhibition in MEFs treated with rapamycin for 8 h. d, Cell death in MEFs treated with 2 μM of erastin and rapamycin for 16 h. e, The measurement of L-[14C] Cystine uptake in AMPK WT and DKO ACHN cells. f, g, The measurement of L-[14C] Cystine uptake in Caki-1 (f) and BJ (g) cells treated with 2 mM AICAR and 5 mM 2DG for 6h. h, The histograms and bar graphs showing the levels of intracellular labile iron in AMPK WT and DKO ACHN cells. i, Cell death measurement in MEFs treated with different TOFA concentrations and 2 μM erastin. P values correspond to the comparison between 0 μM and different conentrations of TOFA under erastin treatment. j,k, Cell death measurement in Caki-1 (j) and BJ (k) cells treated with 2 μM erastin and 50 μM TOFA for 24 h. l, m, The intracellular levels of the indicated free fatty acids in MEFs treated with vehicle or 25 μM of TOFA for 8 h (l) and treated with vehicle, 2 mM AICAR, or 0 mM glucose for 8 h (m). Data show the mean ± s.d., n = 3 independent experiments. Statistical analysis was performed using unpaired, two-tailed t-test. Numerical source data are provided in Source Data Extended Data Fig. 3. Scanned images of unprocessed blots are shown in Source Data Extended Data Fig. 3.
Extended Data Fig. 4
Extended Data Fig. 4. Lipidomic analyses upon AMPK activation or inactivation
a, b, Schematic diagram of the experimental design of mass spectrometry-based lipidomic analysis associated with AMPK activation. Global lipidomic analysis was performed in MEFs treated with vehicle, 2 μM erastin, 200 μM A769662, or 2 μM erastin + 200 μM A769662 for 8 h (a) or in AMPK WT and DKO ACHN cells treated with vehicle or 2 μM erastin for 11 h (b). There are three biologically independent samples (Rep. 1–3) in each group (a) and four biologically independent samples (Rep. 1–4) in each group (b). Samples ran in duplicates (two technical replicates: A, B) on the UPLC-MS. c, d, Heat map of significantly changed lipid species (One-way ANOVA, FDR corrected p-value < 0.05) in MEFs treated with vehicle, 2 μM erastin, 200 μM A769662, or 2 μM erastin + 200 μM A769662 (c) or in AMPK WT and DKO ACHN cells treated with vehicle or 2 μM erastin (d) combined in both positive and negative ionization modes. Each row represents z-score-normalized intensities of the detected lipid species. Each column represents a sample. The relative abundance of each lipid is color-coded with red indicating high signal intensity and blue indicating low signal intensity. (FA, free fatty acid; Cer, ceramide; PC, phosphatidylcholine; LysoPC, lysophosphatidylcholine; PC O, ether-linked PC; PC P, plasmalogen PC; LysoPC O, ether-linked LysoPC; PE, phosphatidylethanolamine; LysoPE, lysophosphatidylethanolamine; PE O, ether-linked PE; PE P, plasmalogen PE; LysoPE O, ether-linked LysoPE; LysoPE P, plasmalogen LysoPE P; PG, phosphatidylglycerol; LysoPG, lyso phosphatidylglycerol; PI, phosphatidylinositol; LysoPI, lyso phosphatidylinositol; PA, phosphatidic acid; PS, phosphatidylserine; TAG, triacylglycerol; CE, cholesteryl ester. Lipids are annotated based on the fatty acyl compositions (e.g. LysoPC 16:0, 16 carbons and 0 double bond) or as sum of total number of carbons and double bonds (e.g. TAG 52:5, total of 52 carbons and 5 double bonds).
Extended Data Fig. 5
Extended Data Fig. 5. The levels of fatty acids were altered by AMPK activation or inactivation
a, List of 17 lipid species significantly changed (Two-tailed, unpaired Welch’s t-test, Fold change ≥ 1.5 and FDR-corrected p-value < 0.05) in both MEFs (vehicle versus A769662) and ACHN (AMPK WT versus DKO) cells. Refer to Extended Data Fig. 4 for detailed sample information. b, c, The relative signal intensities of the indicated free fatty acids involved in long chain fatty acid biosynthesis in MEFs (b) or ACHN (c) cells with the indicated treatment and genotypes. Data show the mean ± s.d., n = 6 (b) or n = 8 (c) independent experiments. Statistical analysis was performed using unpaired, two-tailed t-test. Numerical source data are provided in Source Data Extended Data Fig. 5.
Extended Data Fig. 6
Extended Data Fig. 6. AMPK activation suppresses PUFA biosynthesis
a, b, The relative signal intensities of PE 18:0_20:4 and PE 18:0_22:4 in MEFs treated with A769662 (a) or AMPK WT and DKO ACHN cells (b). c, Immunoblot indicating the loss of ACSL4 in AMPK DKO ACHN cells. The experiment was repeated twice, independently, with similar results. d, Cell death in AMPK DKO ACHN cells with ACSL4 WT and KO upon treatment of 2 μM erastin. e, f, The relative signal intensities of PE 18:0_22:4 (e) and PE 18:0_20:4 (f) in ACHN cells treated with 20 μM dihomo-γ-linolenic acid or arachidonic acid for 42 h. g, h, Cell viability measurement in ACHN cells incubated with palmitic acid (g) or stearic acid (h) with a series of concentration (0 μM-40 μM) and treated with or without ferrostatin-1 (Ferr-1) or erastin as indicated. i, Heat map of significantly changed lipid species (One-way ANOVA, FDR corrected p-value < 0.05) in MEFs treated with vehicle, 25 μM TOFA, 2 μM erastin, or 25μM TOFA+2 μM erastin combined positive and negative ionization modes. There are three biologically independent samples in each group and the samples analyzed in duplicates (technical replicates) on the UPLC-MS. Each row represents z-score-normalized relative signal intensities of the identified lipid species. Each column represents a sample. The relative abundance of each lipid is color-coded with red indicating high signal intensity and blue indicating low signal intensity. j, The relative signal intensities of the indicated fatty acids in MEFs treated with vehicle or 25 μM TOFA. Data show the mean ± s.d., n = 3 (d, g, h), n = 6 (a, e, f, j) or n = 8 (b) independent experiments. Statistical analysis was performed using unpaired, two-tailed t-test. Scanned images of unprocessed blots are shown in Source Data Extended Data Fig. 6. Numerical source data are provided in Source Data Extended Data Fig. 6.
Extended Data Fig. 7
Extended Data Fig. 7. Lipidomics analysis in MEFs treated with A769662 or TOFA
a, b, The relative signal intensities of the same PUFA-containing PEs in MEFs treated with 25 μM TOFA (a) or 200 μM A769662 (b). c, d, The relative signal intensities of TAGs with the same number of carbons and double bonds in MEFs treated with 25 μM TOFA (c) or 200 μM A769662 (d). Data show the mean ± s.d., n = 6 independent experiments. Statistical analysis was performed using unpaired, two-tailed t-test. Numerical source data are provided in Source Data Extended Data Fig. 7.
Extended Data Fig. 8
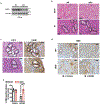
Extended Data Fig. 8. Renal ischemia reperfusion injury in in AMPK α1/α2L/L or AMPKα1/α2L/L, Rosa26-CreERT2 mice
a, Immunoblot showing the levels of AMPK α expression in kidneys of three individual AMPK α1/α2L/L or AMPKα1/α2L/L, Rosa26-CreERT2 mice (referred to as AMPK WT and KO mice). The experiment was repeated three times, independently, with similar results. b, Representative images of hematoxylin and eosin (H&E) staining of the renal cortex in sham-treated and IR-operated AMPK WT or DKO mice. Damaged renal tubules are marked by black dotted lines. Scale bars, 50 μm. The experiment was repeated more than ten times, independently, with similar results. c, Representative images of H&E staining and immunohistochemical staining of 4-HNE from mouse renal cortex after IR. Damaged renal tubules are marked with black dotted lines and 4-HNE stained tubules are marked with red dotted lines. Scale bars, 50 μm. The experiment was repeated more than ten times, independently, with similar results. d, e, Representative images showing MDA immunohistochemical staining from mouse renal cortex with the indicated genotypes and treatment conditions (d; dark brown stained tubules indicate MDA positive staining, Scale bars, 50 μm). Bar graphs presenting the percentages of MDA positive tubules per visual field (e). Data show the mean ± s.d., n = 4 (AICAR) or n = 5 (vehicle) independent experiments. Statistical analysis was performed using unpaired, two-tailed t-test. Scanned images of unprocessed blots are shown in Source Data Extended Data Fig. 8. Numerical source data are provided in Source Data Extended Data Fig. 8.
Extended Data Fig. 9
Extended Data Fig. 9. A schematic model describing the roles of AMPK-mediated energy stress signaling in regulating ferroptosis
See discussion for the detailed description. ACC: acetyl-CoA carboxylase; PUFAs: polyunsaturated fatty acids; AA: arachidonic acid; PUFA-PLs: polyunsaturated fatty acid-containing phospholipids; ACSL4: acyl-CoA synthetase long chain family member 4; LPCAT3: lysophosphatidylcholine acyltransferase 3; 15-LOX: 15-lipoxygenase.
Fig. 1.
Fig. 1.. Energy stress inhibits ferroptotic cell death.
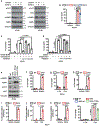
a, Representative images showing the induction of cell death in immortalized MEFs treated with 2 μM erastin cultured in 25 mM or 0 mM glucose for 16 h. Scale bars, 100 μm. b-d, Cell death measurement in MEFs cultured in 25 mM or 0 mM glucose and treated with 2 μM erastin for 16 h (b), cultured in cysteine-free media for 8 h (c), or treated with 100 nM RLS3 for 16 h (d). e, Cell death measurement in GPX4 WT and KO Caki-1 cells cultured in 25 or 0 mM glucose for 16 h and immunoblot showing the levels of GPX4. f-h, Cell death measurement in MEFs treated with energy stress inducer/mimetic agents including A769662 (200 μM), AICAR (2 mM), 2DG (5 mM), 0 mM glucose with simultaneous treatment of 2 μM erastin for 16 h (f), cystine-free media for 8 h (g), or 100 nM RSL3 for 16 h (h). P values correspond to the comparison between control and each treatment in red bars. i-k, Lipid peroxidation in MEFs treated with energy stress inducer/mimetic agents and 2 μM erastin for 8 h (i), cystine-free media for 6 h (j), or 100 nM RSL3 for 8 h (k). P values correspond to the comparison between control and each treatment in red bars. Data show the mean ± s.d., n = 3 independent experiments. Statistical analysis was performed using unpaired, two-tailed t-test. Numerical source data are provided in Source Data Fig. 1. Scanned images of unprocessed blots are shown in Source Data Fig. 1.
Fig. 2.
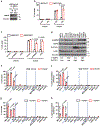
Fig. 2.. Energy stress inhibits ferroptotic cell death partly through AMPK.
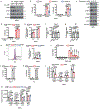
a, Immunoblot showing the levels of AMPKα in AMPK α1/α2 WT and DKO MEFs. b,c, Cell death measurement in AMPK WT and DKO MEFs treated with erastin (2 μM) cultured in 25 or 0 mM glucose for 16 h (b), or co-treated with A769662 (200 μM) or 2DG (5 mM) for 16 h (c). d, Immunoblot showing the levels of AMPK T172 phosphorylation, AMPK, SLC7A11 and LKB1 in cell lines as indicated. e, Cell death measurement in the indicated cell lines at 24 h after 2 μM erastin treatment. f, Lipid peroxidation measurement in the indicated cell lines treated with 2 μM of erastin for 24 h, except MEFs (8 h), Caki-1 (16 h), and BJ (16 h) cell lines. g, h, The measurement of cell death (g) and lipid peroxidation (h) in the indicated cell lines cultured in cystine free media for 36 h and 16 h, respectively. Lipid peroxidation in MEFs was measured at 6 h. Data show the mean ± s.d., n = 3 independent experiments. Statistical analysis was performed using unpaired, two-tailed t-test. Numerical source data are provided in Source Data Fig. 2. Scanned images of unprocessed blots are shown in Source Data Fig. 2.
Fig. 3.
Fig. 3.. AMPK inactivation sensitizes cells to ferroptotic cell death.
a,b, Cell death measurement in ACHN cells treated with AMPK inhibitor compound C, cell death inhibitors, and 2 μM erastin for 12 h (a) or in cysteine-free media for 36 h (b). Ferr-1: 1 μM ferrostatin-1; Z-V: 20 μM Z-VAD-FMK; Nec: 2 μM necrostatin-1s; NAC: 5 mM N-acetyl-cysteine. c, Transmission electron microscopy of ACHN cells with the indicated treatment for 9 h. Black arrows indicate nuclei; white arrows indicate mitochondria. Control: vehicle; Comp C: 10 μM Compound C; erastin: 2 μM erastin. Scale bars: left, 2 μm; right, 500 nm. d, Immunoblot showing the expression of AMPK CA in Caki-1 cells. e, Cell death measurement in Caki-1 cells expressing AMPK CA treated with 2 μM erastin for 16 h. f, Immunoblot indicating the loss of AMPK α1/α2 in AMPK DKO ACHN cell lines generated using CRISPR/Cas9 system. g, Representative phase-contrast images showing cell death induced by 2 μM erastin (24 h) or cystine withdrawal (36 h) in AMPK DKO ACHN cells. Scale bars, 100 μm. h, I, Cell death measurement in AMPK WT and DKO ACHN cells treated with 2 μM erastin for 18 h (h), or cultured in cystine-free media for 36 h (i). j, k, Lipid peroxidation measurement in AMPK WT and DKO ACHN cells treated with 2 μM erastin for 12 h (j), or cultured in cystine-free media for 18 h (k). l, Immunoblot showing the AMPK expression in ACHN cells as indicated. m, Measurement of cell death at 36 h post cystine withdrawal in ACHN cells as indicated. Data show the mean ± s.d., n = 3 independent experiments. Statistical analysis was performed using unpaired, two-tailed t-test. Numerical source data are provided in Source Data Fig. 3. Scanned images of unprocessed blots are shown in Source Data Fig. 3.
Fig. 4.
Fig. 4.. AMPK-mediated phosphorylation of ACC inhibits ferroptosis.
a-c, Lipid peroxidation measurement in MEFs treated with or without 25 μM TOFA and 2 μM erastin for 8 h (a), cystine-free media for 6 h (b), or 100 nM RSL3 for 8 h (c). d-f, Cell death measurement in MEFs treated with or without 25 μM TOFA and 2 μM erastin for 16 h (d), cystine-free media for 8 h (e), or 100 nM RSL3 for 16 h (f). g, h, The measurement of lipid peroxidation (g) and cell death (h) in AMPK WT and DKO ACHN cells treated with 50 μM TOFA and 2 μM erastin for 12 h and 18 h, respectively. I, Immunoblot of ACC WT and ACC1 (S79A)/ACC2 (S212A) mutant double knock-in (DKI) immortalized MEFs. j, Cell death measurement in ACC WT and DKI MEFs treated with 2 μM erastin and 200 μM A769662 for 16 h. k, Cell death measurement in ACC DKI MEFs treated with erastin, A769662, and various cell death inhibitors or NAC. Fer: 1 μM ferrostatin-1; DFO: 100 μM deferoxamine; Z-V: 20 μM Z-VAD-FMK; Nec: 2 μM necrostatin-1s; NAC: 5 mM N-acetyl-cysteine. l, Cell death measurement in ACC WT and DKI MEFs treated with 2 μM erastin and 2 mM AICAR or 0 mM glucose for 36 h. Data show the mean ± s.d., n = 3 independent experiments. Statistical analysis was performed using unpaired, two-tailed t-test. Numerical source data are provided in Source Data Fig. 4. Scanned images of unprocessed blots are shown in Source Data Fig. 4.
Fig. 5.
Fig. 5.. AMPK regulates PUFA-containing lipid accumulation.
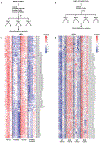
a, b, Heat maps of significantly changed lipid species (Two-tailed, unpaired Welch’s t-test; fold change threshold = 1.5, FDR corrected p-value < 0.05; n =3 biologically independent samples) in vehicle- versus A769662-treated MEFs (a) and vehicle-treated AMPK WT versus DKO ACHN cells (b) measured in duplicates using UPLC-MS. Each row represents z-score-normalized intensities of the detected lipid species. Each column represents a sample. The relative abundance of each lipid is color-coded with red indicating high signal intensity and blue indicating low signal intensity (FA, free fatty acid; Cer, ceramide; PC, phosphatidylcholine; LysoPC, lysophosphatidylcholine; PC O, ether-linked PC; PC P, plasmalogen PC; LysoPC O, ether-linked LysoPC; PE, phosphatidylethanolamine; LysoPE, lysophosphatidylethanolamine; PE O, ether-linked PE; PE P, plasmalogen PE; LysoPE O, ether-linked LysoPE; LysoPE P, plasmalogen LysoPE P; PG, phosphatidylglycerol; LysoPG, lyso phosphatidylglycerol; PI, phosphatidylinositol; LysoPI, lyso phosphatidylinositol; PA, phosphatidic acid; PS, phosphatidylserine; TAG, triacylglycerol; CE, cholesteryl ester; CoQ9, coenzyme Q9). Lipids are annotated based on the fatty acyl compositions (e.g. LysoPC 16:0, 16 carbons and 0 double bond) or as sum of total number of carbons and double bonds (e.g. TAG 52:5, total of 52 carbons and 5 double bonds). c, Venn diagram depicting the numbers of significantly altered lipids from the comparison of MEFs and ACHN cells. d, e, Relative signal intensities of dihomo-γ-linolenic acid and arachidonic acid in MEFs (d) and ACHN cells (e) with the indicated treatment and genotypes. f, g, Cell viability measurement in MEFs treated with A769662 (f) or ACHN WT cells (g) incubated with the indicated fatty acids with a series of concentrations (0 μM-40 μM) and treated with or without ferrostatin-1 (Ferr-1) or erastin as indicated. Data show the mean ± s.d., n = 3 (f,g), n = 6 (d) or n = 8 (e) independent experiments. Statistical analysis was performed using unpaired, two-tailed t-test. Numerical source data are provided in Source Data Fig. 5.
Fig.6.
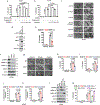
Fig.6.. AMPK activation protects renal ischemia reperfusion injury.
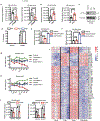
a, Transmission electron microscopy of cortical renal tissues from the mice after ischemia reperfusion (IR) or sham-treatment. Scale bars: left, 2 μm; right, 500 nm. The experiment was repeated three times, independently, with similar results. b-d, Wild-type mice injected with vehicle, AICAR (0.5 mg/g), 2DG (0.5 mg/g), or Ferrostatin-1 (2 μg/g) were subjected to 30 min IR. Western blot analysis showing AMPK activation in the tissue lysates from mouse kidneys (b). The experiment was repeated three times, independently, with similar results (b). Representative images of hematoxylin and eosin (H&E) staining of the renal cortex after IR. Black dotted lines, damaged renal proximal tubules (as characterized by tubular dilatation, tubule brush border loss, flattened epithelial cells, or sloughing of cells) (c). Scale bars, 50 μm. Bar graphs show percent of tubular damages in the renal cortex (d). n = 2 (Sham), n = 3 (IR+Ferr-1), n = 4 (IR+V, IR+AI) or n = 5 (IR+2DG) mice. e-i, AMPKα1/α2L/L or AMPKα1/α2L/L, Rosa26-CreERT2 mice injected with either vehicle or AICAR for 7 days (referred to as AMPK WT and DKO mice) were subjected to IR. Representative images of H&E staining showing the damaged renal cortex after IR (e). Scale bars, 50 μm. Bar graphs show the percentages of tubular damages (f). Data show the mean ± s.d., n = 3 (DKO+vehicle), n = 4 (WT+vehicle), n = 5 (DKO+AICAR) or n = 6 (WT+AICAR) mice. Bar graphs show blood urea nitrogen (BUN) levels (g). Data show the mean ± s.d., n = 3 (DKO+vehicle, WT+AICAR, DKO+AICAR) or n = 4 (WT+vehicle) mice. Representative images showing 4-HNE immunohistochemical staining from mouse renal cortex with the indicated genotypes and treatment conditions (h; dark brown stained tubules indicate 4-HNE positive staining, Scale bars, 50 μm). Bar graphs showing the percentages of 4-HNE positive tubules per visual field (i). Data show the mean ± s.d., n = 4 (AICAR) or 5 (vehicle). Statistical analysis was performed using unpaired, two-tailed t-test. Numerical source data are provided in Source Data Fig. 6. Scanned images of unprocessed blots are shown in Source Data Fig. 6.

Comment in

References

    1. Green DR, Galluzzi L & Kroemer G Cell biology. Metabolic control of cell death. Science 345, 1250256 (2014). - PMC - PubMed
    1. Hardie DG, Ross FA & Hawley SA AMPK: a nutrient and energy sensor that maintains energy homeostasis. Nat Rev Mol Cell Biol 13, 251–262 (2012). - PMC - PubMed
    1. Hardie DG, Schaffer BE & Brunet A AMPK: An Energy-Sensing Pathway with Multiple Inputs and Outputs. Trends in cell biology (2015). - PMC - PubMed
    1. El Mjiyad N, Caro-Maldonado A, Ramirez-Peinado S & Munoz-Pinedo C Sugar-free approaches to cancer cell killing. Oncogene 30, 253–264 (2011). - PubMed
    1. Lin A et al. The FoxO-BNIP3 axis exerts a unique regulation of mTORC1 and cell survival under energy stress. Oncogene 33, 3183–3194 (2014). - PMC - PubMed

Publication types

MeSH terms