Review
. 2020 Mar;21(3):169-178.
doi: 10.1038/s41583-020-0262-x. Epub 2020 Feb 6.

Macroscopic gradients of synaptic excitation and inhibition in the neocortex

Affiliations
Review

Macroscopic gradients of synaptic excitation and inhibition in the neocortex

Xiao-Jing Wang. Nat Rev Neurosci. 2020 Mar.

Erratum in

Abstract

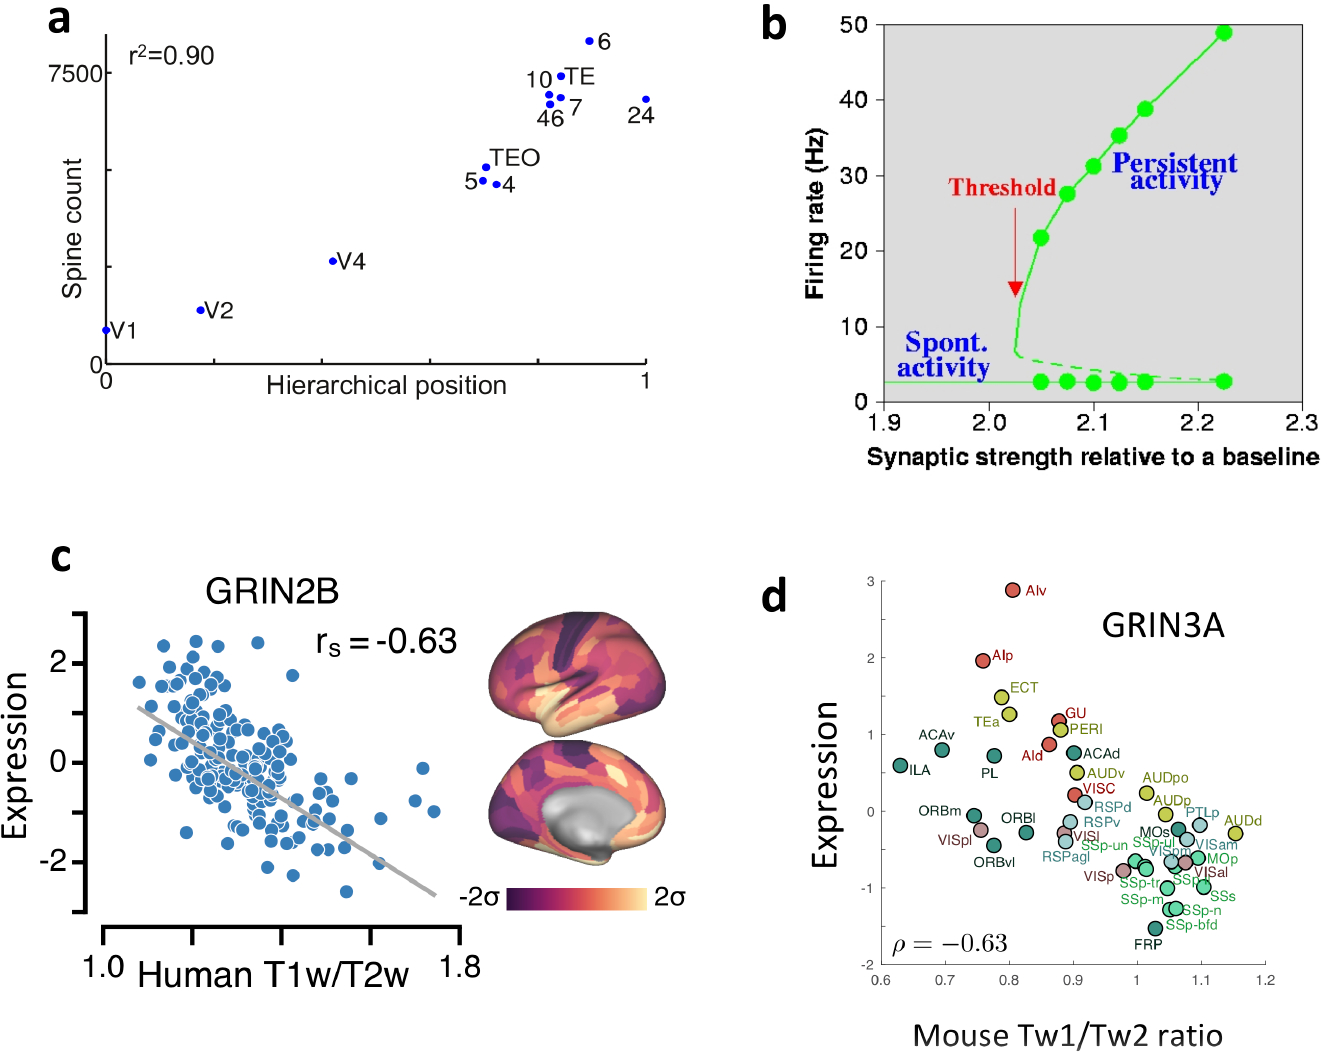
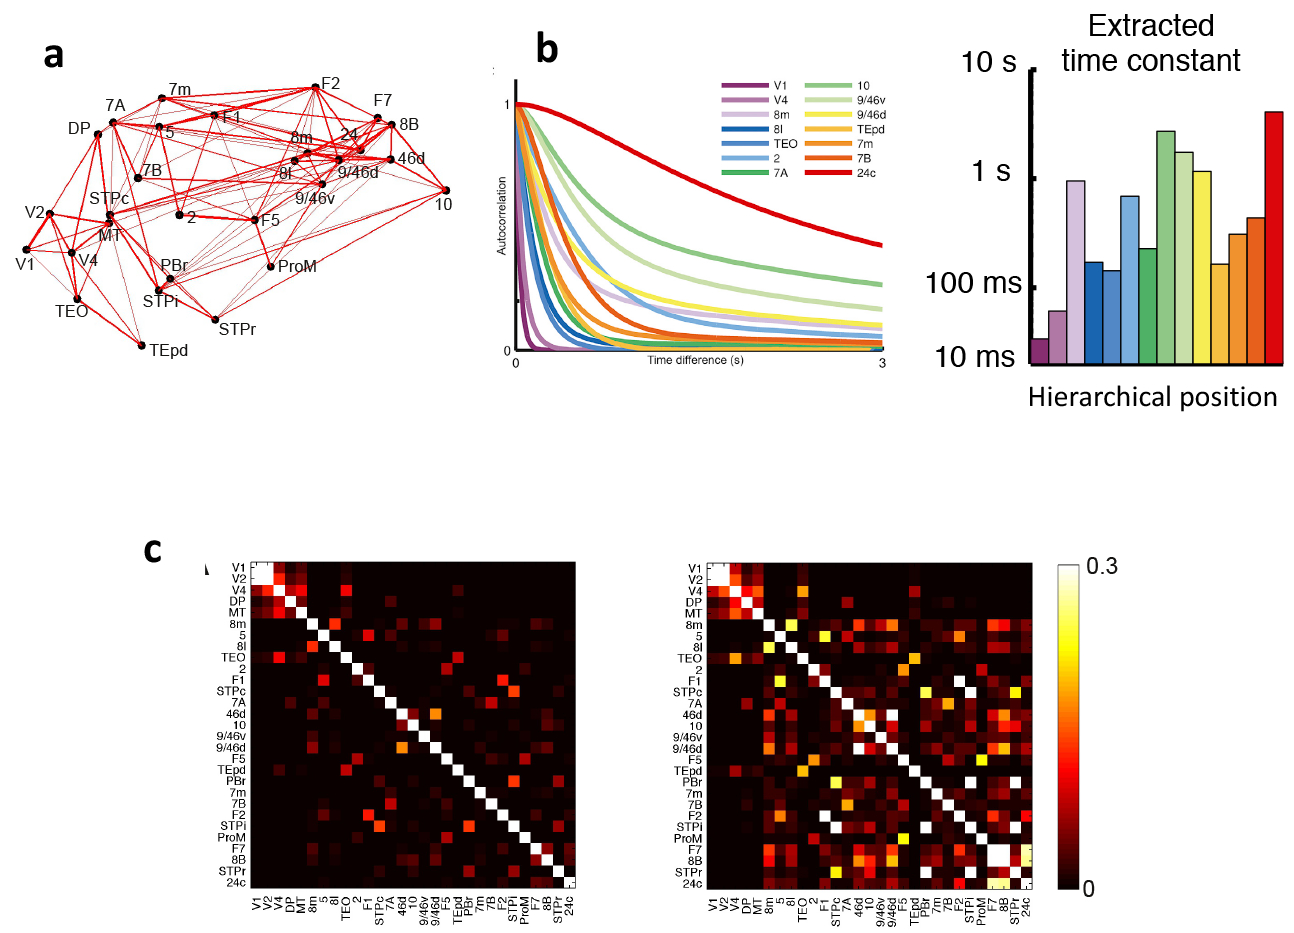
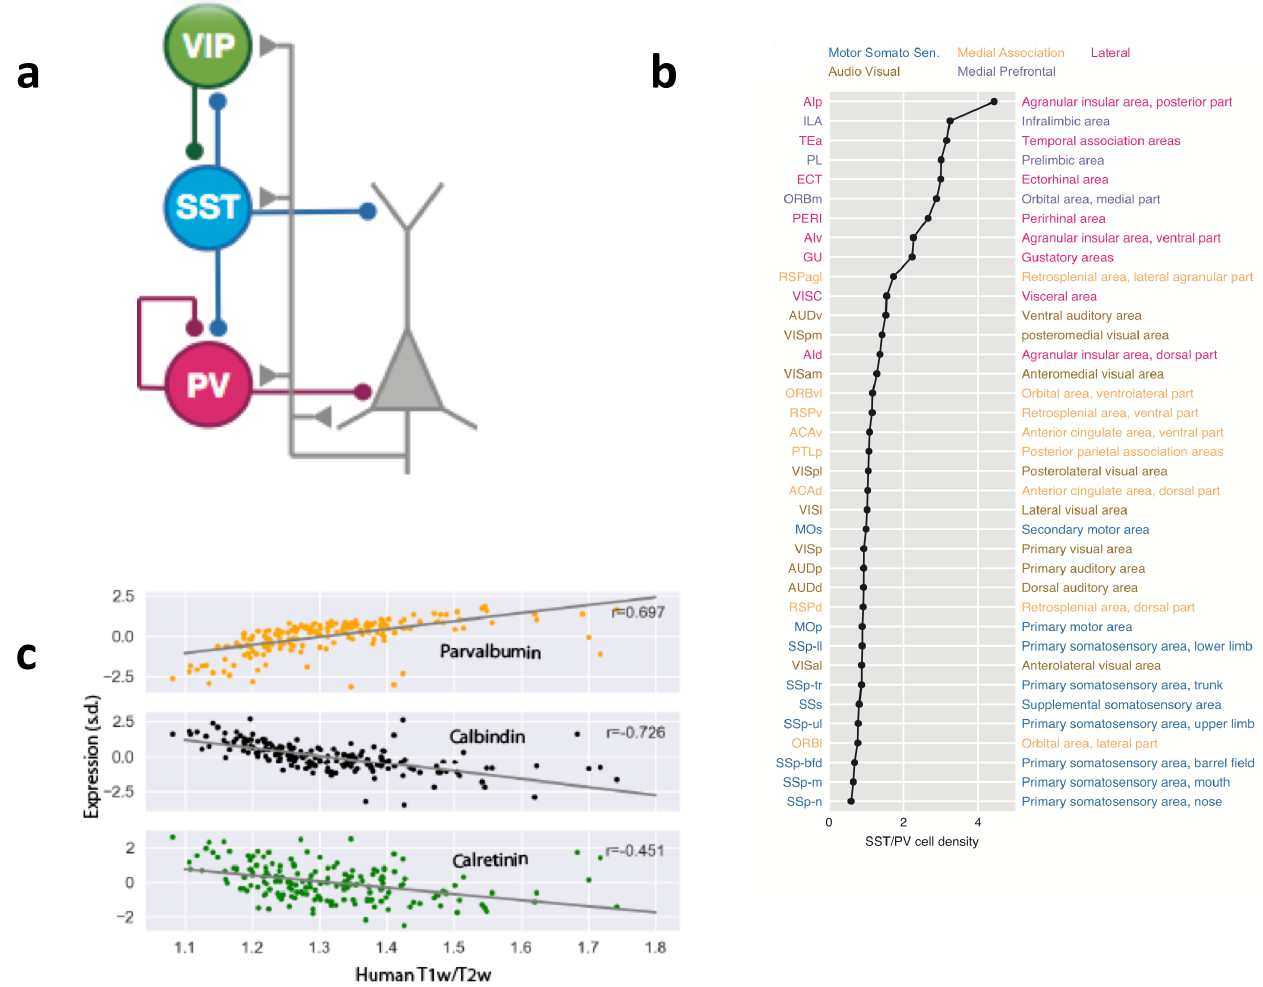
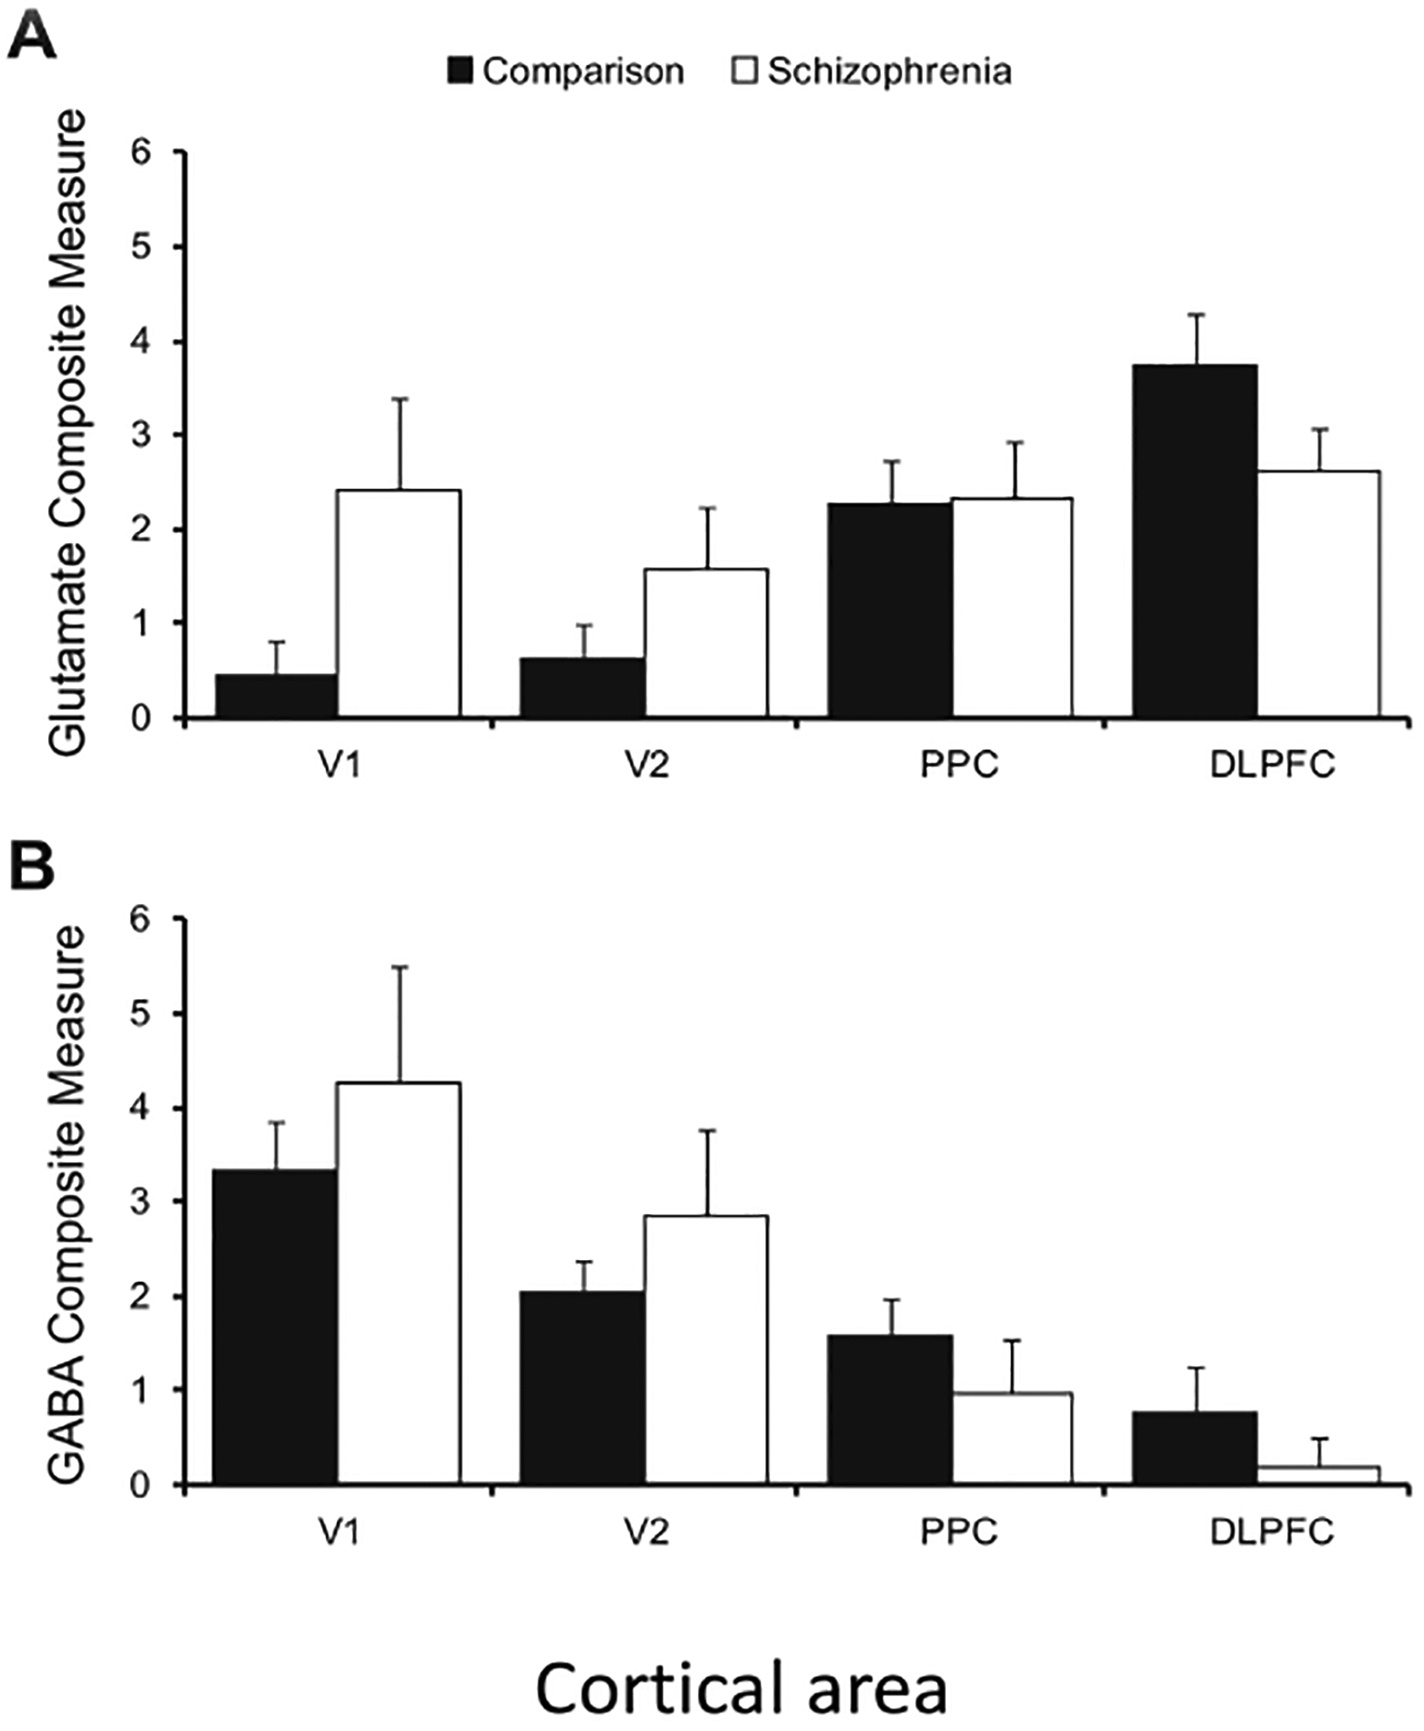
With advances in connectomics, transcriptome and neurophysiological technologies, the neuroscience of brain-wide neural circuits is poised to take off. A major challenge is to understand how a vast diversity of functions is subserved by parcellated areas of mammalian neocortex composed of repetitions of a canonical local circuit. Areas of the cerebral cortex differ from each other not only in their input-output patterns but also in their biological properties. Recent experimental and theoretical work has revealed that such variations are not random heterogeneities; rather, synaptic excitation and inhibition display systematic macroscopic gradients across the entire cortex, and they are abnormal in mental illness. Quantitative differences along these gradients can lead to qualitatively novel behaviours in non-linear neural dynamical systems, by virtue of a phenomenon mathematically described as bifurcation. The combination of macroscopic gradients and bifurcations, in tandem with biological evolution, development and plasticity, provides a generative mechanism for functional diversity among cortical areas, as a general principle of large-scale cortical organization.


Conflict of interest statement

Competing interests

The author declares no competing interests.

Figures

Fig. 1 |
Fig. 1 |. Macroscopic gradients of synaptic excitation and bifurcations.
a | The number of spines on the basal dendrites of layer 3 pyramidal cells in an area of macaque cortex is strongly correlated with the area’s hierarchical position, as determined by layer-dependent projections. b | Self-sustained network states are shown by their neural firing rates (y-axis) as a function of the strength of recurrent synaptic connectivity (x-axis) in a local circuit model. Solid lines represent the spontaneous state and the mnemonic persistent memory state; dashed line: unstable states. Above a critical threshold of synaptic strength, persistent activity appears abruptly as an all-or-none bifurcation phenomenon. c | Across different areas of human cortex, the expression of GRIN2B, which encodes the NMDA receptor subunit NR2B, negatively correlates with MRI-derived T1-weighted/T2-weighted (T1w/T2w) ratio. d | In mouse cortex, Grin3a, which encodes the NMDA receptor NR3A subunit, is expressed as a function of T1w/T2w ratio. ρ, Pearson correlation coefficient; 2, somatosensory area 2; 7A, area 7A; 7B, area 7B; 7m, area 7m; 8l, lateral part of area 8; 8m, medial part of area 8; 9/46d, dorsal part of area 9/46; 9/46v, ventral part of area 9/46; 10, area 10; 24c, area 24c; TEO, area TEO; TEpd, posterior-dorsal part of area TE; rs, Spearman rank coefficient; V1, primary visual cortex; V4, visual area 4. Parts a is adapted from ref. . Part b is adapted from ref. . Part c is adapted from ref. . Part d is adapted from ref. .
Fig. 2 |
Fig. 2 |. Timescale hierarchies and their implications for functional connectivity,
a | Connections between 29 areas in an anatomically constrained dynamical model of macaque cortex. Strong connections are indicated by lines, with line thickness determined by connection strength, b | The model shows a hierarchy of timescales, with sensory areas and association areas characterized by short and long timescales, respectively. The left graph depicts the autocorrelation function of neural activity in each of a subset of areas. From these functions, a dominant time constant was extracted (displayed as a function of the area’s hierarchical position on the right), c | The functional connectivity matrix of the macaque cortex model where areas are assumed to be identical (left) is compared to the matrix when the model includes a macroscopic gradient (right). A gradient of synaptic excitation enhances functional connectivity especially for association areas with slow time constants, whereas functional connectivity of early visual areas (upper left corner of the matrix) is similar with or without a macroscopic gradient. 2, somatosensory area 2; 5, somatosensory area 5; 7A, area 7A; 7B, area 7B; 7m, area 7m; 8B, area 8B; 81, lateral part of area 8; 8m, medial part of area 8; 9/46d, dorsal part of area 9/46; 9/46v, ventral part of area 9/46; 10, area 10; 24c, area 24c; 46d, dorsal part of area 46; DP, dorsal prelunate area; FI, frontal area FI; F2, frontal area F2; F5, frontal area F5; F7, frontal area F7; MT, middle temporal area; PBr, rostral part of the parabelt area; ProM, area ProM; STPc, caudal part of the superior temporal polysensory area; STPi, intermediate part of the superior temporal polysensory area; STPr, rostral part of the superior temporal polysensory area; TEO, area TEO; TEpd, posterior-dorsal part of area TE; VI, primary visual cortex; V2, visual area 2; V4, visual area 4. Parts a-c are adapted from Chaudhuri et al..
Fig. 3 |
Fig. 3 |. Macroscopic gradients of synaptic inhibition.
a | A disinhibitory circuit comprising a parvalbumin-expressing (PV+) interneuron, a somatostatin-expressing (SST+) interneuron and a vasoactive intestinal peptide-expressing (VIP+) interneuron. b | The ratio of SST+ interneuron density to PV+ interneuron density plotted and ranked for different areas of mouse cortex. PV+ neurons are abundant in primary sensory areas, whereas frontal areas are dominated by SST+ neurons. Areas are colour-coded to depict six types of cortical subnetwork to which they belong. c | Genes encoding calbindin (CB), calretinin (CR) and PV exhibit macroscopic gradients in the human cortex. Part a is adapted from ref. . Part b is adapted from an image in ref. that was generated using data in ref. . Part c is adapted from ref. .
Fig. 4 |
Fig. 4 |. Macroscopic gradients in schizophrenia.
A comparison of postmortem brains of healthy controls and individuals with schizophrenia examined composite measures of glutamate-signalling-related and GABA-signalling-related transcripts in the visuospatial working-memory network. In control brains (filled bar), the composite glutamate signalling (top) and GABA signalling measures (bottom) showed marked, and opposing, caudal-to-rostral gradients. However, in individuals with schizophrenia (open bar), the gradient was lost for the glutamate-signalling measure, but enhanced for the GABA-signalling measure. Error bars represent variability across each group of 20 individuals. DLPFC, dorsolateral prefrontal cortex; PPC, posterior parietal cortex; V1, primary visual cortex; V2, Brodmann area 18. Figure reproduced from ref. .
Fig. 5 |
Fig. 5 |. Two-dimensional gradients of primate cortex.
a |Spatial relationships of seven subnetworks of the human cerebral cortex.. A method called diffusion map was used to deduce two principal gradients from functional activity data in the resting state. The first (radial) gradient defines a hierarchy, with visual, somatosensory and motor areas at the bottom that are arranged along the second (angular) gradient. Association areas are in three higher levels of the hierarchy. Abbreviation: dmn, default-mode network; dorsal attn, dorsal attention network; sal, salience network; somato/mot, somatosensory/motor network. b |Two-dimensional plot of areas of macaque cortex, representing long-range connectivity and hierarchy. The distance of an area from the edge corresponds to its hierarchical position, whereas the angular distance between two areas is inversely related to their connection strength. Each color corresponds to a different cortical lobe: occipital (yellow), temporal (red), parietal (green), frontal subdivided into agranular (cyan) and granular (prefrontal proper, blue). Definitions of individual area abbreviations are included in the legend of Fig. 2. Part a is adapted from ref. . Part b is adapted from ref. .

References

    1. Mountcastle VB The columnar organization of the neocortex. Brain 120, 701–722 (1997). - PubMed
    1. Rakic P Evolution of the neocortex: a perspective from developmental biology. Nat. Rev. Neurosci 10, 724–735 (2009). - PMC - PubMed
    1. Hempel CM, Hartman KH, Wang X-J, Turrigiano G & Nelson SB Multiple forms of short-term plasticity at excitatory synapses in rat medial prefrontal cortex. J. Neurophysiol 83, 3031–3041 (2000). - PubMed
    1. Wang Y et al. Heterogeneity in the pyramidal network of the medial prefrontal cortex. Nat Neurosci 9, 534–542 (2006). - PubMed
    1. Wang H, Stradtman GG, Wang X-J & Gao WJ A specialized NMDA receptor function in layer 5 recurrent microcircuitry of the adult rat prefrontal cortex. Proc. Natl. Acad. Sci. U.S.A 105, 16791–16796 (2008). - PMC - PubMed

Publication types